vue+d3js+fastapi实现天气柱状图折线图饼图
说明:
vue+d3js+fastapi实现天气柱状图折线图饼图
效果图:

step0:postman
1. 生成天气数据(POST请求):URL: http://localhost:8000/generate-data/?year=2024&month=3&seed=42
方法: POST
Headers:Content-Type: application/json
成功响应示例:
{"status": "success","message": "成功生成31条天气数据","year": 2024,"month": 3
}2. 查询天气数据(GET请求):URL: http://localhost:8000/weather-data/?year=2024&month=4
方法: GET
成功响应示例:{"status": "success","count": 31,"year": 2024,"month": 3,"data": [{"record_date": "2024-03-01","temperature": 16.4,"humidity": 72,"precipitation": 0.0,"wind_speed": 7.2,"weather_condition": "Cloudy"},{"record_date": "2024-03-31","temperature": 17.3,"humidity": 62,"precipitation": 3.8,"wind_speed": 1.4,"weather_condition": "Rain"}]
}
step1:sql
CREATE TABLE weather_data (id INT AUTO_INCREMENT PRIMARY KEY,record_date DATE NOT NULL,temperature DECIMAL(4,1) NOT NULL,  -- 格式:-99.9 到 99.9humidity TINYINT UNSIGNED NOT NULL,  -- 范围:0-100precipitation DECIMAL(5,1) NOT NULL, -- 最大999.9mmwind_speed DECIMAL(4,1) NOT NULL,   -- 最大99.9m/sweather_condition VARCHAR(50) NOT NULL,  -- 修改列名INDEX (record_date)
) ENGINE=InnoDB DEFAULT CHARSET=utf8mb4;select *from weather_data;
step2:python test
C:\Users\wangrusheng\PycharmProjects\FastAPIProject1\hello.py
import random
from datetime import date
from decimal import Decimal
import calendar
import pymysql.cursors
import json
# 数据库配置(根据实际情况修改)
DB_CONFIG = {'host': 'localhost','user': 'root','password': '123456','db': 'db_school','charset': 'utf8mb4','cursorclass': pymysql.cursors.DictCursor
}def generate_temperature(rng, min_temp=10.0, max_temp=20.0):"""生成温度数据(均匀分布)"""temp = rng.uniform(min_temp, max_temp)return round(temp, 1)def generate_humidity(rng):"""生成湿度数据(正态分布)"""humidity = rng.gauss(60, 15)humidity = max(0, min(humidity, 100))return int(round(humidity))def generate_precipitation(rng):"""生成降水量数据(20%概率下雨)"""if rng.random() < 0.2:amount = rng.expovariate(1 / 5.0)  # 平均5mmamount = max(0.1, min(amount, 30.0))return round(amount, 1)return 0.0def generate_wind_speed(rng):"""生成风速数据(伽马分布)"""speed = rng.gammavariate(2, 2)speed = max(0.0, min(speed, 20.0))return round(speed, 1)def get_weather_condition(temperature, precipitation, humidity, rng):"""根据天气参数判断天气状况"""if precipitation > 0:return 'Snow' if temperature < 3.0 else 'Rain'if humidity >= 70:return 'Cloudy'if humidity <= 30:return 'Sunny'return rng.choice(['Partly Cloudy', 'Mostly Cloudy'])def generate_monthly_weather_data(year, month, rng=None):"""生成整月天气数据"""if rng is None:rng = random.Random()_, num_days = calendar.monthrange(year, month)data = []for day in range(1, num_days + 1):record_date = date(year, month, day)temperature = generate_temperature(rng)humidity = generate_humidity(rng)precipitation = generate_precipitation(rng)wind_speed = generate_wind_speed(rng)condition = get_weather_condition(temperature, precipitation, humidity, rng)data.append({'record_date': record_date,'temperature': temperature,'humidity': humidity,'precipitation': precipitation,'wind_speed': wind_speed,'weather_condition': condition})return datadef insert_weather_data(data):"""批量插入天气数据到数据库"""connection = pymysql.connect(**DB_CONFIG)try:with connection.cursor() as cursor:sql = """INSERT INTO weather_data (record_date, temperature, humidity, precipitation, wind_speed, weather_condition)VALUES (%s, %s, %s, %s, %s, %s)"""params = [(d['record_date'],d['temperature'],d['humidity'],d['precipitation'],d['wind_speed'],d['weather_condition'])for d in data]cursor.executemany(sql, params)connection.commit()return len(data)except Exception as e:connection.rollback()raise efinally:connection.close()def get_weather_data(year: int, month: int) -> list:"""从数据库获取指定年月的天气数据并转换为JSON兼容格式"""connection = pymysql.connect(**DB_CONFIG)try:with connection.cursor() as cursor:sql = """SELECT record_date, temperature, humidity, precipitation, wind_speed, weather_conditionFROM weather_dataWHERE YEAR(record_date) = %s AND MONTH(record_date) = %sORDER BY record_date"""cursor.execute(sql, (year, month))results = cursor.fetchall()# 转换日期和数值类型for record in results:record['record_date'] = record['record_date'].isoformat()# 处理Decimal类型(如果存在)for key in ['temperature', 'precipitation', 'wind_speed']:if isinstance(record[key], Decimal):record[key] = float(record[key])return resultsfinally:connection.close()if __name__ == '__main__':# 示例:生成并插入2024年4月的天气数据year = 2024month = 4# 创建带种子的随机生成器(保证结果可复现)rng = random.Random(42)try:# 生成模拟数据weather_data = generate_monthly_weather_data(year, month, rng)# 插入数据库# inserted_count = insert_weather_data(weather_data)# print(f"成功插入{inserted_count}条天气数据")# 获取并打印JSON数据weather_json = get_weather_data(year, month)print(json.dumps(weather_json, indent=2, ensure_ascii=False))except Exception as e:print(f"操作失败: {str(e)}")
step3:python fastapi
C:\Users\wangrusheng\PycharmProjects\FastAPIProject1\main.py
from fastapi import FastAPI, HTTPException, Query
from datetime import date
from decimal import Decimal
from typing import Optional
import random
import calendar
import pymysql.cursors
import json
from fastapi.middleware.cors import CORSMiddleware
app = FastAPI()
# CORS配置
app.add_middleware(CORSMiddleware,allow_origins=["*"],allow_credentials=True,allow_methods=["*"],allow_headers=["*"],
)
# 数据库配置(根据实际情况修改)
DB_CONFIG = {'host': 'localhost','user': 'root','password': '123456','db': 'db_school','charset': 'utf8mb4','cursorclass': pymysql.cursors.DictCursor
}# 以下保持原有函数定义不变(generate_temperature、generate_humidity等)
# [原有函数定义区,保持与问题中完全相同的函数实现]def generate_temperature(rng, min_temp=10.0, max_temp=20.0):"""生成温度数据(均匀分布)"""temp = rng.uniform(min_temp, max_temp)return round(temp, 1)def generate_humidity(rng):"""生成湿度数据(正态分布)"""humidity = rng.gauss(60, 15)humidity = max(0, min(humidity, 100))return int(round(humidity))def generate_precipitation(rng):"""生成降水量数据(20%概率下雨)"""if rng.random() < 0.2:amount = rng.expovariate(1 / 5.0)  # 平均5mmamount = max(0.1, min(amount, 30.0))return round(amount, 1)return 0.0def generate_wind_speed(rng):"""生成风速数据(伽马分布)"""speed = rng.gammavariate(2, 2)speed = max(0.0, min(speed, 20.0))return round(speed, 1)def get_weather_condition(temperature, precipitation, humidity, rng):"""根据天气参数判断天气状况"""if precipitation > 0:return 'Snow' if temperature < 3.0 else 'Rain'if humidity >= 70:return 'Cloudy'if humidity <= 30:return 'Sunny'return rng.choice(['Partly Cloudy', 'Mostly Cloudy'])def generate_monthly_weather_data(year, month, rng=None):"""生成整月天气数据"""if rng is None:rng = random.Random()_, num_days = calendar.monthrange(year, month)data = []for day in range(1, num_days + 1):record_date = date(year, month, day)temperature = generate_temperature(rng)humidity = generate_humidity(rng)precipitation = generate_precipitation(rng)wind_speed = generate_wind_speed(rng)condition = get_weather_condition(temperature, precipitation, humidity, rng)data.append({'record_date': record_date,'temperature': temperature,'humidity': humidity,'precipitation': precipitation,'wind_speed': wind_speed,'weather_condition': condition})return datadef insert_weather_data(data):"""批量插入天气数据到数据库"""connection = pymysql.connect(**DB_CONFIG)try:with connection.cursor() as cursor:sql = """INSERT INTO weather_data (record_date, temperature, humidity, precipitation, wind_speed, weather_condition)VALUES (%s, %s, %s, %s, %s, %s)"""params = [(d['record_date'],d['temperature'],d['humidity'],d['precipitation'],d['wind_speed'],d['weather_condition'])for d in data]cursor.executemany(sql, params)connection.commit()return len(data)except Exception as e:connection.rollback()raise efinally:connection.close()def get_weather_data(year: int, month: int) -> list:"""从数据库获取指定年月的天气数据并转换为JSON兼容格式"""connection = pymysql.connect(**DB_CONFIG)try:with connection.cursor() as cursor:sql = """SELECT record_date, temperature, humidity, precipitation, wind_speed, weather_conditionFROM weather_dataWHERE YEAR(record_date) = %s AND MONTH(record_date) = %sORDER BY record_date"""cursor.execute(sql, (year, month))results = cursor.fetchall()# 转换日期和数值类型for record in results:record['record_date'] = record['record_date'].isoformat()# 处理Decimal类型(如果存在)for key in ['temperature', 'precipitation', 'wind_speed']:if isinstance(record[key], Decimal):record[key] = float(record[key])return resultsfinally:connection.close()@app.post("/generate-data/")
async def generate_weather_data(year: int = Query(..., ge=2000, le=2100, description="年份"),month: int = Query(..., ge=1, le=12, description="月份"),seed: Optional[int] = Query(None, description="随机种子(可选)")
):"""生成并插入指定月份的天气数据"""try:rng = random.Random(seed) if seed else random.Random()weather_data = generate_monthly_weather_data(year, month, rng)inserted_count = insert_weather_data(weather_data)return {"status": "success","message": f"成功生成{inserted_count}条天气数据","year": year,"month": month}except ValueError as e:raise HTTPException(status_code=400, detail=str(e))except Exception as e:raise HTTPException(status_code=500, detail=f"数据库操作失败: {str(e)}")@app.get("/weather-data/")
async def get_weather(year: int = Query(..., ge=2000, le=2100, description="年份"),month: int = Query(..., ge=1, le=12, description="月份")
):"""获取指定月份的天气数据"""try:data = get_weather_data(year, month)return {"status": "success","count": len(data),"year": year,"month": month,"data": data}except Exception as e:raise HTTPException(status_code=500, detail=f"数据查询失败: {str(e)}")if __name__ == "__main__":import uvicornuvicorn.run(app, host="0.0.0.0", port=8000)
step4:vue
C:\Users\wangrusheng\PycharmProjects\untitled3\src\views\Lottery.vue
<template><div><div class="controls"><input v-model.number="year" type="number" placeholder="年份"><input v-model.number="month" type="number" placeholder="月份" min="1" max="12"><button @click="fetchData">查询</button><button @click="generateData">生成数据</button></div><div class="charts-container"><div class="chart-box"><h3>每日温度柱状图</h3><div ref="barChart" class="chart"></div></div><div class="chart-box"><h3>温度趋势折线图</h3><div ref="lineChart" class="chart"></div></div><div class="chart-box"><h3>天气状况分布饼图</h3><div ref="pieChart" class="chart"></div></div></div></div>
</template><script>
import * as d3 from 'd3';
import axios from 'axios';export default {data() {return {weatherData: [],year: null,month: null};},methods: {async fetchData() {if (!this.validateInput()) return;try {const response = await axios.get('http://localhost:8000/weather-data/', {params: { year: this.year, month: this.month }});this.weatherData = response.data.data;this.redrawCharts();} catch (error) {this.handleError(error, '查询');}},async generateData() {if (!this.validateInput()) return;try {const response = await axios.post('http://localhost:8000/generate-data/', null, {params: { year: this.year, month: this.month, seed: 42 },headers: { 'Content-Type': 'application/json' }});alert(`生成成功:${response.data.message}`);await this.fetchData();} catch (error) {this.handleError(error, '生成');}},validateInput() {if (!this.year || !this.month) {alert('请填写年份和月份');return false;}if (this.month < 1 || this.month > 12) {alert('月份必须为1-12');return false;}return true;},handleError(error, operation) {console.error(`${operation}失败:`, error);alert(`${operation}失败,请检查控制台`);},redrawCharts() {this.clearCharts();this.drawBarChart();this.drawLineChart();this.drawPieChart();},clearCharts() {[this.$refs.barChart, this.$refs.lineChart, this.$refs.pieChart].forEach(ref => ref.innerHTML = '');},// 各图表绘制方法(保持原有实现,开头添加清除逻辑)// 绘制柱状图drawBarChart() {const margin = { top: 30, right: 30, bottom: 50, left: 60 };const width = 800 - margin.left - margin.right;const height = 400 - margin.top - margin.bottom;const svg = d3.select(this.$refs.barChart).append('svg').attr('width', width + margin.left + margin.right).attr('height', height + margin.top + margin.bottom).append('g').attr('transform', `translate(${margin.left},${margin.top})`);// 创建比例尺const x = d3.scaleBand().domain(this.weatherData.map(d => d.record_date)).range([0, width]).padding(0.2);const y = d3.scaleLinear().domain([0, d3.max(this.weatherData, d => d.temperature)]).range([height, 0]);// 添加柱状svg.selectAll("rect").data(this.weatherData).join("rect").attr("x", d => x(d.record_date)).attr("y", d => y(d.temperature)).attr("width", x.bandwidth()).attr("height", d => height - y(d.temperature)).attr("fill", "#4CAF50");// 添加坐标轴svg.append("g").attr("transform", `translate(0,${height})`).call(d3.axisBottom(x).tickValues(x.domain().filter((d,i) => !(i%5))));svg.append("g").call(d3.axisLeft(y));// 添加标签svg.append("text").attr("transform", `translate(${width/2}, ${height + 40})`).style("text-anchor", "middle").text("日期");svg.append("text").attr("transform", "rotate(-90)").attr("y", 0 - margin.left).attr("x",0 - (height / 2)).attr("dy", "1em").style("text-anchor", "middle").text("温度(℃)");},// 绘制折线图drawLineChart() {const margin = { top: 30, right: 30, bottom: 50, left: 60 };const width = 800 - margin.left - margin.right;const height = 400 - margin.top - margin.bottom;const svg = d3.select(this.$refs.lineChart).append('svg').attr('width', width + margin.left + margin.right).attr('height', height + margin.top + margin.bottom).append('g').attr('transform', `translate(${margin.left},${margin.top})`);// 创建比例尺const x = d3.scaleBand().domain(this.weatherData.map(d => d.record_date)).range([0, width]);const y = d3.scaleLinear().domain([d3.min(this.weatherData, d => d.temperature) - 2, d3.max(this.weatherData, d => d.temperature) + 2]).range([height, 0]);// 创建折线生成器const line = d3.line().x(d => x(d.record_date) + x.bandwidth()/2).y(d => y(d.temperature));// 绘制折线svg.append("path").datum(this.weatherData).attr("fill", "none").attr("stroke", "#2196F3").attr("stroke-width", 2).attr("d", line);// 添加坐标轴svg.append("g").attr("transform", `translate(0,${height})`).call(d3.axisBottom(x).tickValues(x.domain().filter((d,i) => !(i%5))));svg.append("g").call(d3.axisLeft(y));},// 绘制饼图drawPieChart() {const width = 400;const height = 400;const radius = Math.min(width, height) / 2;const svg = d3.select(this.$refs.pieChart).append('svg').attr('width', width).attr('height', height).append('g').attr('transform', `translate(${width/2},${height/2})`);// 统计天气状况const data = Array.from(d3.rollup(this.weatherData,v => v.length,d => d.weather_condition),([name, value]) => ({name, value}));// 创建颜色比例尺const color = d3.scaleOrdinal().domain(data.map(d => d.name)).range(d3.schemeCategory10);// 饼图生成器const pie = d3.pie().value(d => d.value);// 弧形生成器const arc = d3.arc().innerRadius(0).outerRadius(radius);// 绘制扇形const arcs = svg.selectAll("arc").data(pie(data)).enter().append("g").attr("class", "arc");arcs.append("path").attr("d", arc).attr("fill", d => color(d.data.name)).attr("stroke", "white").style("stroke-width", "2px");// 添加标签arcs.append("text").attr("transform", d => `translate(${arc.centroid(d)})`).attr("text-anchor", "middle").text(d => d.data.name);}}
};
</script><style>
.controls {padding: 1rem;display: flex;gap: 1rem;align-items: center;
}.controls input {padding: 0.5rem;border: 1px solid #ddd;border-radius: 4px;width: 120px;
}.controls button {padding: 0.5rem 1rem;background: #2196F3;color: white;border: none;border-radius: 4px;cursor: pointer;
}.controls button:hover {background: #1976D2;
}.charts-container {display: flex;flex-direction: column;gap: 2rem;padding: 2rem;
}.chart-box {background: white;padding: 1rem;border-radius: 8px;box-shadow: 0 2px 4px rgba(0,0,0,0.1);width: 100%;
}.chart-box h3 {margin: 0 0 1rem;color: #333;
}.chart {width: 100%;height: 400px;
}
</style>
end
//我是分割线
step101: old vue
下面的代码修改:1.年份 月份 改为可选,
2.新增两个按钮,查询和添加
3.查询和添加,需要做网络请求
4.三个图表 需要垂直排列1. 生成天气数据(POST请求):URL: http://localhost:8000/generate-data/?year=2024&month=3&seed=42
方法: POST
Headers:Content-Type: application/json
成功响应示例:
{"status": "success","message": "成功生成31条天气数据","year": 2024,"month": 3
}<template><div class="charts-container"><div class="chart-box"><h3>每日温度柱状图</h3><div ref="barChart" class="chart"></div></div><div class="chart-box"><h3>温度趋势折线图</h3><div ref="lineChart" class="chart"></div></div><div class="chart-box"><h3>天气状况分布饼图</h3><div ref="pieChart" class="chart"></div></div></div>
</template><script>
import * as d3 from 'd3';
import axios from 'axios';export default {data() {return {weatherData: []};},async mounted() {try {const response = await axios.get('http://localhost:8000/weather-data/?year=2024&month=4');this.weatherData = response.data.data;this.drawBarChart();this.drawLineChart();this.drawPieChart();} catch (error) {console.error('数据获取失败:', error);}},methods: {// 绘制柱状图drawBarChart() {const margin = { top: 30, right: 30, bottom: 50, left: 60 };const width = 800 - margin.left - margin.right;const height = 400 - margin.top - margin.bottom;const svg = d3.select(this.$refs.barChart).append('svg').attr('width', width + margin.left + margin.right).attr('height', height + margin.top + margin.bottom).append('g').attr('transform', `translate(${margin.left},${margin.top})`);// 创建比例尺const x = d3.scaleBand().domain(this.weatherData.map(d => d.record_date)).range([0, width]).padding(0.2);const y = d3.scaleLinear().domain([0, d3.max(this.weatherData, d => d.temperature)]).range([height, 0]);// 添加柱状svg.selectAll("rect").data(this.weatherData).join("rect").attr("x", d => x(d.record_date)).attr("y", d => y(d.temperature)).attr("width", x.bandwidth()).attr("height", d => height - y(d.temperature)).attr("fill", "#4CAF50");// 添加坐标轴svg.append("g").attr("transform", `translate(0,${height})`).call(d3.axisBottom(x).tickValues(x.domain().filter((d,i) => !(i%5))));svg.append("g").call(d3.axisLeft(y));// 添加标签svg.append("text").attr("transform", `translate(${width/2}, ${height + 40})`).style("text-anchor", "middle").text("日期");svg.append("text").attr("transform", "rotate(-90)").attr("y", 0 - margin.left).attr("x",0 - (height / 2)).attr("dy", "1em").style("text-anchor", "middle").text("温度(℃)");},// 绘制折线图drawLineChart() {const margin = { top: 30, right: 30, bottom: 50, left: 60 };const width = 800 - margin.left - margin.right;const height = 400 - margin.top - margin.bottom;const svg = d3.select(this.$refs.lineChart).append('svg').attr('width', width + margin.left + margin.right).attr('height', height + margin.top + margin.bottom).append('g').attr('transform', `translate(${margin.left},${margin.top})`);// 创建比例尺const x = d3.scaleBand().domain(this.weatherData.map(d => d.record_date)).range([0, width]);const y = d3.scaleLinear().domain([d3.min(this.weatherData, d => d.temperature) - 2, d3.max(this.weatherData, d => d.temperature) + 2]).range([height, 0]);// 创建折线生成器const line = d3.line().x(d => x(d.record_date) + x.bandwidth()/2).y(d => y(d.temperature));// 绘制折线svg.append("path").datum(this.weatherData).attr("fill", "none").attr("stroke", "#2196F3").attr("stroke-width", 2).attr("d", line);// 添加坐标轴svg.append("g").attr("transform", `translate(0,${height})`).call(d3.axisBottom(x).tickValues(x.domain().filter((d,i) => !(i%5))));svg.append("g").call(d3.axisLeft(y));},// 绘制饼图drawPieChart() {const width = 400;const height = 400;const radius = Math.min(width, height) / 2;const svg = d3.select(this.$refs.pieChart).append('svg').attr('width', width).attr('height', height).append('g').attr('transform', `translate(${width/2},${height/2})`);// 统计天气状况const data = Array.from(d3.rollup(this.weatherData,v => v.length,d => d.weather_condition),([name, value]) => ({name, value}));// 创建颜色比例尺const color = d3.scaleOrdinal().domain(data.map(d => d.name)).range(d3.schemeCategory10);// 饼图生成器const pie = d3.pie().value(d => d.value);// 弧形生成器const arc = d3.arc().innerRadius(0).outerRadius(radius);// 绘制扇形const arcs = svg.selectAll("arc").data(pie(data)).enter().append("g").attr("class", "arc");arcs.append("path").attr("d", arc).attr("fill", d => color(d.data.name)).attr("stroke", "white").style("stroke-width", "2px");// 添加标签arcs.append("text").attr("transform", d => `translate(${arc.centroid(d)})`).attr("text-anchor", "middle").text(d => d.data.name);}}
};
</script><style>
.charts-container {display: grid;grid-template-columns: repeat(auto-fit, minmax(400px, 1fr));gap: 2rem;padding: 2rem;
}.chart-box {background: white;padding: 1rem;border-radius: 8px;box-shadow: 0 2px 4px rgba(0,0,0,0.1);
}.chart-box h3 {margin: 0 0 1rem;color: #333;
}.chart {width: 100%;height: 400px;
}
</style>
step102:c++ 模拟数据
C:\Users\wangrusheng\source\repos\CMakeProject1\CMakeProject1\CMakeProject1.cpp
#include <iostream>
#include <random>
#include <vector>
#include <string>
#include <iomanip>
#include <cmath>struct WeatherData {int day;double temperature;int humidity;double precipitation;double wind_speed;std::string condition;
};// 生成温度(可指定范围)
double generate_temperature(std::mt19937& gen, double min_temp = 10.0, double max_temp = 20.0) {std::uniform_real_distribution<double> dist(min_temp, max_temp);return std::round(dist(gen) * 10) / 10.0; // 保留1位小数
}// 生成湿度(正态分布)
int generate_humidity(std::mt19937& gen) {std::normal_distribution<double> dist(60.0, 15.0);double humidity = dist(gen);humidity = std::clamp(humidity, 0.0, 100.0);return static_cast<int>(std::round(humidity));
}// 生成降水量(20%概率下雨)
double generate_precipitation(std::mt19937& gen) {std::bernoulli_distribution rain_dist(0.2);if (rain_dist(gen)) {std::exponential_distribution<double> amount_dist(1.0 / 5.0); // 平均5mmdouble amount = amount_dist(gen);amount = std::clamp(amount, 0.1, 30.0);return std::round(amount * 10) / 10.0; // 保留1位小数}return 0.0;
}// 生成风速(伽马分布)
double generate_wind_speed(std::mt19937& gen) {std::gamma_distribution<double> dist(2.0, 2.0);double speed = dist(gen);speed = std::clamp(speed, 0.0, 20.0);return std::round(speed * 10) / 10.0; // 保留1位小数
}// 生成天气状况
std::string get_condition(double temp, double precip, int humidity) {if (precip > 0) {return (temp < 3.0) ? "Snow" : "Rain";}if (humidity >= 70) return "Cloudy";if (humidity <= 30) return "Sunny";// 随机选择部分多云或阴天static std::vector<std::string> options = { "Partly Cloudy", "Mostly Cloudy" };std::uniform_int_distribution<int> dist(0, 1);std::mt19937 temp_gen(std::random_device{}());return options[dist(temp_gen)];
}// 生成完整月份数据
std::vector<WeatherData> generate_april_data(std::mt19937& gen) {std::vector<WeatherData> data;for (int day = 1; day <= 30; ++day) {WeatherData wd;wd.day = day;wd.temperature = generate_temperature(gen);wd.humidity = generate_humidity(gen);wd.precipitation = generate_precipitation(gen);wd.wind_speed = generate_wind_speed(gen);wd.condition = get_condition(wd.temperature, wd.precipitation, wd.humidity);data.push_back(wd);}return data;
}int main() {// 初始化随机数生成器std::random_device rd;std::mt19937 gen(rd());// 生成数据auto weather_data = generate_april_data(gen);// 输出CSV格式std::cout << "Day,Temperature,Humidity,Precipitation,Wind Speed,Condition\n";for (const auto& wd : weather_data) {std::cout << wd.day << ","<< std::fixed << std::setprecision(1) << wd.temperature << "°C,"<< wd.humidity << "%,"<< wd.precipitation << "mm,"<< wd.wind_speed << "m/s,"<< wd.condition << "\n";}return 0;
}
end
相关文章:
vue+d3js+fastapi实现天气柱状图折线图饼图
说明: vued3jsfastapi实现天气柱状图折线图饼图 效果图: step0:postman 1. 生成天气数据(POST请求):URL: http://localhost:8000/generate-data/?year2024&month3&seed42 方法: POST Headers:Content-Type:…...

vue:前端预览 / chrome浏览器设置 / <iframe> 方法预览 doc、pdf / vue-pdf 预览pdf
一、本文目标 <iframe> 方法预览 pdf 、word vue-pdf 预览pdf 二、<iframe> 方法 2.1、iframe 方法预览需要 浏览器 设置为: chrome:设置-隐私设置和安全性-网站设置-更多内容设置-PDF文档 浏览器访问: chrome://settings/co…...

【NLP 56、实践 ⑬ LoRA完成NER任务】
目录 一、数据文件 二、模型配置文件 config.py 三、数据加载文件 loader.py 1.导入文件和类的定义 2.初始化 3.数据加载方法 代码运行流程 4.文本编码 / 解码方法 ① encode_sentence(): ② decode(): 代码运行流程 ③ padding(): 代码…...

Java性能调优2025:从JVM到Kubernetes的全链路优化策略
摘要 📝 本文将带你深入探讨2025年Java全链路性能调优的最新实践,从JVM底层优化到Kubernetes集群调优,涵盖GC策略选择、JIT优化、容器化最佳实践等核心内容。通过大量实践案例和代码示例,帮助你构建完整的性能优化知识体系。 目…...
【力扣hot100题】(076)买卖股票的最佳时机
终于来到了最考验智商的贪心算法。 之前做过,但花了不少时间思考,所以这次做的很快。 思路就是记录最小价格,然后一路遍历边调整新的最小价格边比较目前价格和最小价格差价。 class Solution { public:int maxProfit(vector<int>&am…...

Java基础 4.9
1.方法递归调用练习 //请使用递归的方式求出斐波那契数1, 1, 2, 3, 5, 8, 13 //给你一个整数n, 求出它的值是多少 /* 思路 n 1 1 n 2 1 n > 3 前两个数的和 递归的思路 */ public class RecursionExercise01 {public static void main(String[] args) {Mathod mathod ne…...

NDK开发:音视频处理基础
音视频处理基础 一、音视频基础 1.1 音视频基本概念 视频编码格式 H.264/AVCH.265/HEVCVP8/VP9AV1音频编码格式 AACMP3PCMOPUS封装格式 MP4FLVMKVTS1.2 音视频处理流程 视频处理流程 采集(Camera/Screen)预处理(美颜/滤镜)编码(H.264/H.265)封装传输/存储音频处理流程 …...

WPF 组件的宽高绑定另一个组件的宽高的指定比值
0.此方法比较适用于响应式界面,组件的大小需要根据窗体大小改变。 1.创建转换函数,并传入比值 public class SizeConverter : IValueConverter{public object Convert(object value, Type targetType, object parameter, CultureInfo culture){if (value is double d &&…...

c#的form实现叠叠乐游戏
说明: 我希望用c#的form实现叠叠乐的游戏,玩家需要堆叠方块来建造高塔。 效果图: step1:游戏规则 游戏实现步骤: a. 处理事件,玩家可以释放摆动的方块,方块会下落。 b. 更新摆动方块的位移,根…...

k8s 1.23升级1.24
0、简介 这里只用3台服务器来做一个简单的集群,当前版本是1.23.17目标升级到1.24.17 地址主机名192.168.160.40kuber-master-1192.168.160.41kuber-master-2192.168.160.42kuber-node-1 我这里设置的master2可调度pod,将master2的污点去掉 kubectl de…...
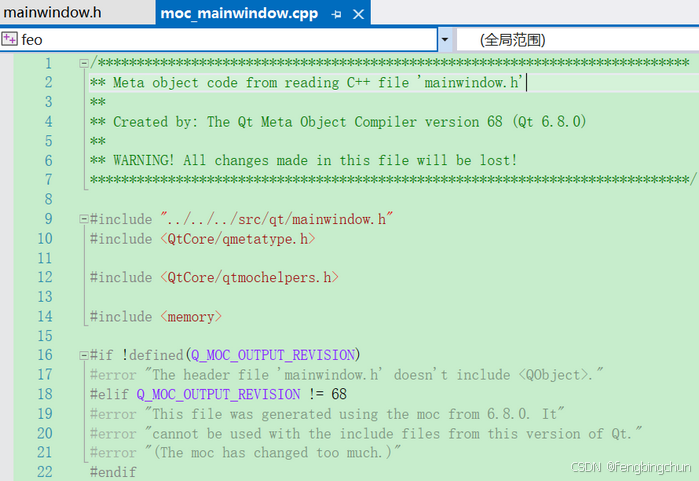
Qt中的元对象系统
Qt的元对象系统(Meta-Object System)提供了对象间通信的信号和槽机制、运行时类型信息和动态属性系统。 元对象系统基于以下三个方面: (1).QObject类:为可以利用元对象系统的对象提供了基类。 (2).Q_OBJECT宏:用于启用元对象功能,…...
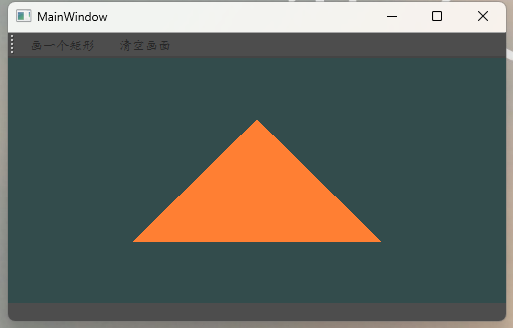
qt之opengl使用
使用qt中的openglWidget绘制一个三角形。自定义的类继承关系sunOpengl : public QOpenGLWidget,QOpenGLFunctions_3_3_Core 代码如下 /*----MainWindow.cpp----------------------------------------------*/ #include "mainwindow.h" #include "./ui_mainwin…...

晋城市电子健康证上传照片尺寸要求及手机拍照制作方法
晋城市餐饮从业人员健康证电子照片上传有着明确的技术规范。根据"晋城市从业人员电子健康证明服务平台"要求,照片尺寸应为358像素(宽)441像素(高),这一比例符合标准证件照的规格。照片底色可选择…...

python基础语法11-文件读写
在 Python 中,文件操作是日常编程中的常见任务之一。Python 提供了简单且强大的工具来读取和写入文件。通过使用内置的 open() 函数、read()、readline()、write() 等方法,我们可以轻松实现对文件的操作。此外,Python 的 with 语句可以帮助我…...

js实现跨域下载,展示下载进度以及自定义下载名称功能
一、 下载进度 loading弹窗结构 // loading状态DOM function setLoading() {let content document.querySelector(.loading)content.innerHTML content.innerHTML <div class"loading_content"><div class"contentBox"><div class&quo…...

MCP 实战系列(Day 2)- 动手搓个文件系统 MCP 服务器
上期回顾:MCP 实战系列(Day 1)- 什么是 MCP? 在上期文章中,我们详细介绍了 Model Context Protocol(MCP)的基本概念和应用场景。本节将带领大家开发一个简易的 Filesystem MCP Serverÿ…...

LabVIEW运动控制(三):EtherCAT运动控制器的高效加工指令自定义封装
ZMC408CE 高性能总线型运动控制器 ZMC408CE是正运动推出的一款多轴高性能EtherCAT总线运动控制器,具有EtherCAT、EtherNET、RS232、CAN和U盘等通讯接口,ZMC系列运动控制器可应用于各种需要脱机或联机运行的场合。 ZMC408CE支持PLC、Basic、HMI组态三种编…...

Java接口性能优化面试问题集锦:高频考点与深度解析
1. 如何定位接口性能瓶颈?常用哪些工具? 考察点:性能分析工具的使用与问题定位能力。 核心答案: 工具:Arthas(在线诊断)、JProfiler(内存与CPU分析)、VisualVM、Prometh…...
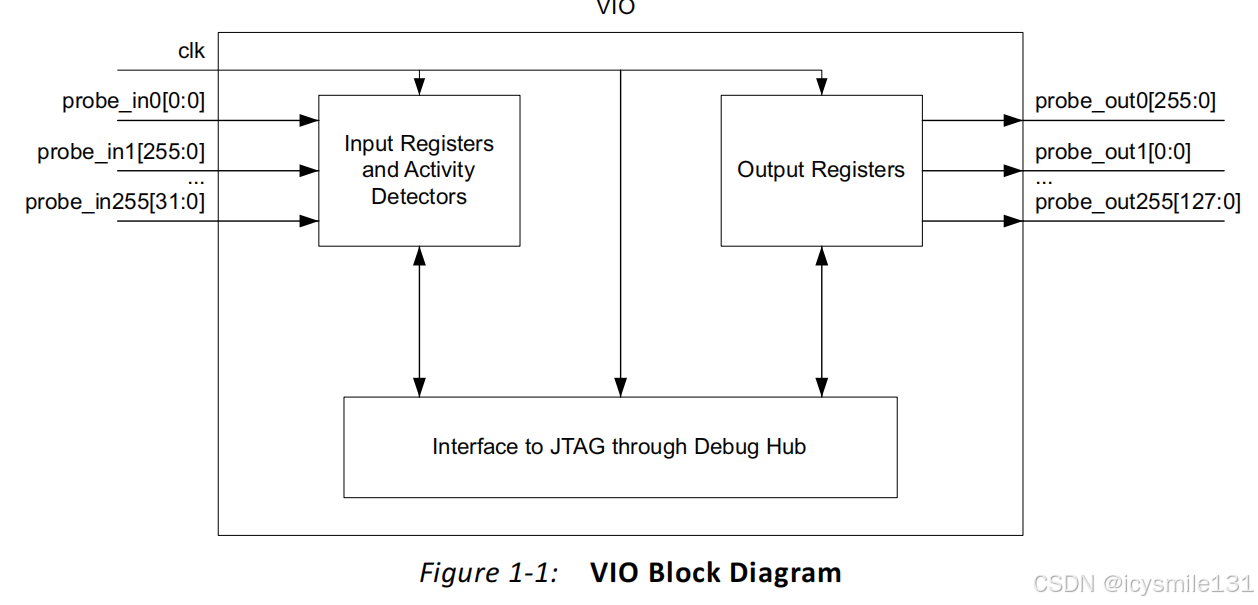
Xilinx虚拟输入/输出(VIO)IP核详细介绍及使用示例
LogiCORE™ IP虚拟输入/输出(VIO)内核是一款可定制化的内核,能够实时监控和驱动FPGA(现场可编程门阵列)内部信号。其输入和输出端口的数量及位宽均可根据需求定制,以便与FPGA设计进行接口对接。由于VIO内核与被监控和/或驱动的设计保持同步,因此应用于您设计中的所有设计…...
Vue3+Vite+TypeScript+Element Plus开发-09.登录成功跳转主页
系列文档目录 Vue3ViteTypeScript安装 Element Plus安装与配置 主页设计与router配置 静态菜单设计 Pinia引入 Header响应式菜单缩展 Mockjs引用与Axios封装 登录设计 登录成功跳转主页 多用户动态加载菜单 Pinia持久化 动态路由-配置 文章目录 目录 系列文档目…...

网络安全应急响应-启动项和任务计划排查
应急响应-启动项排查 在应急响应排查中,启动项和任务计划是攻击者常用的持久化手段。以下是对Windows和Linux系统的详细排查指南,涵盖基础步骤及扩展注意事项: 一、启动项排查 Windows系统 系统配置(msconfig) 运行 …...

Linux : 内核中的信号捕捉
目录 一 前言 二 信号捕捉的方法 1.sigaction()编辑 2. sigaction() 使用 三 可重入函数 四 volatile 关键字 一 前言 如果信号的处理动作是用户自定义函数,在信号递达时就调用这个函数,这称为捕捉信号。在Linux: 进程信号初识-CSDN博客 这一篇中已经学习到了一种信号…...

开发效率提升200%——cursor
cursor带来的编程"革命" 高级语言编程转为"自然语言编程"借助cursor,直接超越初级后台开发、超越初级前端开发、超越初级测试、超越初级UI,产研一体linux命令只用学不用记,语言描述就是命令给一个表结构流程提示词&…...

微软庆祝它成立整整50周年
每周跟踪AI热点新闻动向和震撼发展 想要探索生成式人工智能的前沿进展吗?订阅我们的简报,深入解析最新的技术突破、实际应用案例和未来的趋势。与全球数同行一同,从行业内部的深度分析和实用指南中受益。不要错过这个机会,成为AI领…...
SpringBoot 整合 MCP
SpringBoot 整合 MCP MCP MCP 协议主要分为: Client 客户端(一般就是指 openai,deepseek 这些大模型)Server 服务端(也就是我们的业务系统)我们要做的就是把我们存量系统配置成 MCP Server 环境 JDK17…...
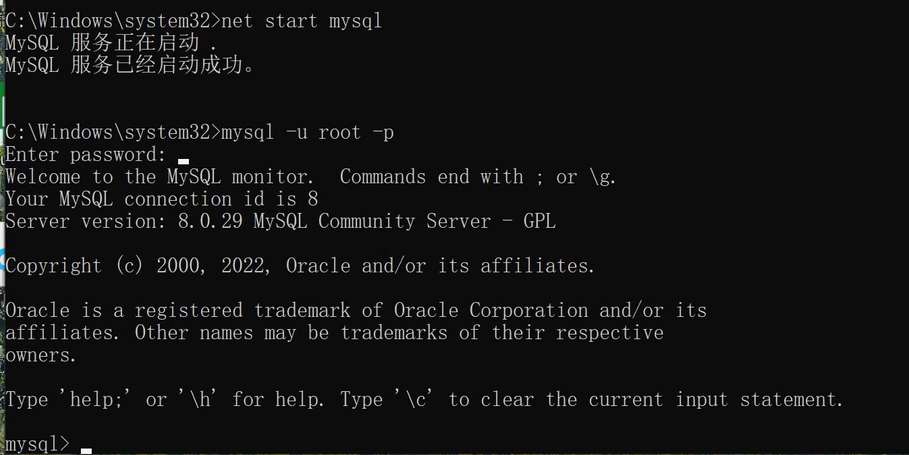
【详细】MySQL 8 安装解压即用 (包含MySQL 5 卸载)
卸载MySQL 1.卸载 2.安装目录删除残余文件(当初安装的位置) 3.删除programData下面的mysql数据文件 4.检查mysql服务是否存在,如果存在则删除(先暂停mysql服务) sc delete mysql 5.删除注册表中残留信息 安装MySQL 8&…...
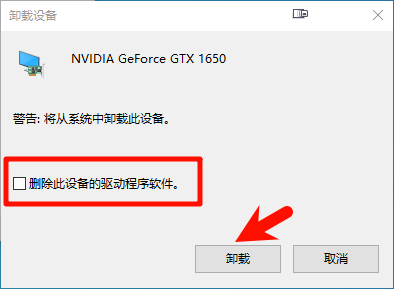
显示器各类异常处理方法
显示器各类异常处理方法 导航 文章目录 显示器各类异常处理方法导航画面无显示/黑屏/无HDMI信号输入显示器闪烁显示器花屏显示画面模糊或扭曲显示器颜色异常显示器出现死点或亮点 画面无显示/黑屏/无HDMI信号输入 首先应该检查的是显示器电源(真的有人弄掉电源…...

关于Spring MVC中@RequestParam注解的详细说明,用于在前后端参数名称不一致时实现参数映射。包含代码示例和总结表格
以下是关于Spring MVC中RequestParam注解的详细说明,用于在前后端参数名称不一致时实现参数映射。包含代码示例和总结表格: 1. 核心作用 RequestParam用于显式绑定HTTP请求参数到方法参数,支持以下场景: 参数名不一致࿱…...

HTML的svg元素
<svg>元素 <svg>是一种用于描述二维矢量图形的 XML 格式,可以直接嵌入 HTML 文档中。 <svg>基本用法 <svg>的几种基本用法,包括圆形,正方形,三角形,直线 ,折线等 <body><svg widt…...
一、简单的 Django 服务
一、配置虚拟环境 1.1 创建一个文件夹在导航栏输入cmd打开 1.2 安装依赖两个库 pip install virtualenv virtualenvwrapper-win -i https://pypi.tuna.tsinghua.edu.cn/simple验证是否安装成功 virtualenv --version pip show virtualenvwrapper-win 1.3 创建虚拟环境 mkvi…...