Valgrind内存诊断工具的使用笔记
Valgrind是一款用于内存调试、内存泄漏检测以及性能分析的神器,能够帮助我们快速定位到程序的内存问题,比如内存泄漏导致的 段错误 (核心已转储)
包含以下工具:
Memcheck:检查程序中的内存问题,如泄漏、越界、非法指针等Callgrind:主要用来检查程序中函数调用过程中出现的问题。Cachegrind:分析CPU的cache命中率、丢失率,用于进行代码优化。Helgrind:主要用来检查多线程程序中出现的竞争问题。Massif:主要用来检查程序中堆栈使用中出现的问题。Extension:可利用core提供的功能,自己编写特定的内存调试工具
使用语法如下:
valgrind [options] ./prog_fileusage: valgrind [options] prog-and-argstool-selection option, with default in [ ]:--tool=<name> use the Valgrind tool named <name> [memcheck]basic user options for all Valgrind tools, with defaults in [ ]:-h --help show this message--help-debug show this message, plus debugging options--version show version-q --quiet run silently; only print error msgs-v --verbose be more verbose -- show misc extra info--trace-children=no|yes Valgrind-ise child processes (follow execve)? [no]--trace-children-skip=patt1,patt2,... specifies a list of executablesthat --trace-children=yes should not trace into--trace-children-skip-by-arg=patt1,patt2,... same as --trace-children-skip=but check the argv[] entries for children, ratherthan the exe name, to make a follow/no-follow decision--child-silent-after-fork=no|yes omit child output between fork & exec? [no]--vgdb=no|yes|full activate gdbserver? [yes]full is slower but provides precise watchpoint/step--vgdb-error=<number> invoke gdbserver after <number> errors [999999999]to get started quickly, use --vgdb-error=0and follow the on-screen directions--vgdb-stop-at=event1,event2,... invoke gdbserver for given events [none]where event is one of:startup exit valgrindabexit all none--track-fds=no|yes track open file descriptors? [no]--time-stamp=no|yes add timestamps to log messages? [no]--log-fd=<number> log messages to file descriptor [2=stderr]--log-file=<file> log messages to <file>--log-socket=ipaddr:port log messages to socket ipaddr:portuser options for Valgrind tools that report errors:--xml=yes emit error output in XML (some tools only)--xml-fd=<number> XML output to file descriptor--xml-file=<file> XML output to <file>--xml-socket=ipaddr:port XML output to socket ipaddr:port--xml-user-comment=STR copy STR verbatim into XML output--demangle=no|yes automatically demangle C++ names? [yes]--num-callers=<number> show <number> callers in stack traces [12]--error-limit=no|yes stop showing new errors if too many? [yes]--error-exitcode=<number> exit code to return if errors found [0=disable]--error-markers=<begin>,<end> add lines with begin/end markers before/aftereach error output in plain text mode [none]--show-below-main=no|yes continue stack traces below main() [no]--default-suppressions=yes|noload default suppressions [yes]--suppressions=<filename> suppress errors described in <filename>--gen-suppressions=no|yes|all print suppressions for errors? [no]--input-fd=<number> file descriptor for input [0=stdin]--dsymutil=no|yes run dsymutil on Mac OS X when helpful? [yes]--max-stackframe=<number> assume stack switch for SP changes largerthan <number> bytes [2000000]--main-stacksize=<number> set size of main thread's stack (in bytes)[min(max(current 'ulimit' value,1MB),16MB)]user options for Valgrind tools that replace malloc:--alignment=<number> set minimum alignment of heap allocations [16]--redzone-size=<number> set minimum size of redzones added before/afterheap blocks (in bytes). [16]--xtree-memory=none|allocs|full profile heap memory in an xtree [none]and produces a report at the end of the executionnone: no profiling, allocs: current allocatedsize/blocks, full: profile current and cumulativeallocated size/blocks and freed size/blocks.--xtree-memory-file=<file> xtree memory report file [xtmemory.kcg.%p]uncommon user options for all Valgrind tools:--fullpath-after= (with nothing after the '=')show full source paths in call stacks--fullpath-after=string like --fullpath-after=, but only show thepart of the path after 'string'. Allows removalof path prefixes. Use this flag multiple timesto specify a set of prefixes to remove.--extra-debuginfo-path=path absolute path to search for additionaldebug symbols, in addition to existing defaultwell known search paths.--debuginfo-server=ipaddr:port also query this server(valgrind-di-server) for debug symbols--allow-mismatched-debuginfo=no|yes [no]for the above two flags only, accept debuginfoobjects that don't "match" the main object--smc-check=none|stack|all|all-non-file [all-non-file]checks for self-modifying code: none, only forcode found in stacks, for all code, or for allcode except that from file-backed mappings--read-inline-info=yes|no read debug info about inlined function callsand use it to do better stack traces. [yes]on Linux/Android/Solaris for Memcheck/Helgrind/DRDonly. [no] for all other tools and platforms.--read-var-info=yes|no read debug info on stack and global variablesand use it to print better error messages intools that make use of it (Memcheck, Helgrind,DRD) [no]--vgdb-poll=<number> gdbserver poll max every <number> basic blocks [5000] --vgdb-shadow-registers=no|yes let gdb see the shadow registers [no]--vgdb-prefix=<prefix> prefix for vgdb FIFOs [/tmp/vgdb-pipe]--run-libc-freeres=no|yes free up glibc memory at exit on Linux? [yes]--run-cxx-freeres=no|yes free up libstdc++ memory at exit on Linuxand Solaris? [yes]--sim-hints=hint1,hint2,... activate unusual sim behaviours [none] where hint is one of:lax-ioctls lax-doors fuse-compatible enable-outerno-inner-prefix no-nptl-pthread-stackcache fallback-llsc none--fair-sched=no|yes|try schedule threads fairly on multicore systems [no]--kernel-variant=variant1,variant2,...handle non-standard kernel variants [none]where variant is one of:bproc android-no-hw-tlsandroid-gpu-sgx5xx android-gpu-adreno3xx none--merge-recursive-frames=<number> merge frames between identicalprogram counters in max <number> frames) [0]--num-transtab-sectors=<number> size of translated code cache [32]more sectors may increase performance, but use more memory.--avg-transtab-entry-size=<number> avg size in bytes of a translatedbasic block [0, meaning use tool provided default]--aspace-minaddr=0xPP avoid mapping memory below 0xPP [guessed]--valgrind-stacksize=<number> size of valgrind (host) thread's stack(in bytes) [1048576]--show-emwarns=no|yes show warnings about emulation limits? [no]--require-text-symbol=:sonamepattern:symbolpattern abort run if thestated shared object doesn't have the statedtext symbol. Patterns can contain ? and *.--soname-synonyms=syn1=pattern1,syn2=pattern2,... synonym sonamespecify patterns for function wrapping or replacement.To use a non-libc malloc library that isin the main exe: --soname-synonyms=somalloc=NONEin libxyzzy.so: --soname-synonyms=somalloc=libxyzzy.so--sigill-diagnostics=yes|no warn about illegal instructions? [yes]--unw-stack-scan-thresh=<number> Enable stack-scan unwind if fewerthan <number> good frames found [0, meaning "disabled"]NOTE: stack scanning is only available on arm-linux.--unw-stack-scan-frames=<number> Max number of frames that can berecovered by stack scanning [5]--resync-filter=no|yes|verbose [yes on MacOS, no on other OSes]attempt to avoid expensive address-space-resync operations--max-threads=<number> maximum number of threads that valgrind canhandle [500]user options for Memcheck:--leak-check=no|summary|full search for memory leaks at exit? [summary]--leak-resolution=low|med|high differentiation of leak stack traces [high]--show-leak-kinds=kind1,kind2,.. which leak kinds to show?[definite,possible]--errors-for-leak-kinds=kind1,kind2,.. which leak kinds are errors?[definite,possible]where kind is one of:definite indirect possible reachable all none--leak-check-heuristics=heur1,heur2,... which heuristics to use forimproving leak search false positive [all]where heur is one of:stdstring length64 newarray multipleinheritance all none--show-reachable=yes same as --show-leak-kinds=all--show-reachable=no --show-possibly-lost=yessame as --show-leak-kinds=definite,possible--show-reachable=no --show-possibly-lost=nosame as --show-leak-kinds=definite--xtree-leak=no|yes output leak result in xtree format? [no]--xtree-leak-file=<file> xtree leak report file [xtleak.kcg.%p]--undef-value-errors=no|yes check for undefined value errors [yes]--track-origins=no|yes show origins of undefined values? [no]--partial-loads-ok=no|yes too hard to explain here; see manual [yes]--expensive-definedness-checks=no|yesUse extra-precise definedness tracking [no]--freelist-vol=<number> volume of freed blocks queue [20000000]--freelist-big-blocks=<number> releases first blocks with size>= [1000000]--workaround-gcc296-bugs=no|yes self explanatory [no]. Deprecated.Use --ignore-range-below-sp instead.--ignore-ranges=0xPP-0xQQ[,0xRR-0xSS] assume given addresses are OK--ignore-range-below-sp=<number>-<number> do not report errors foraccesses at the given offsets below SP--malloc-fill=<hexnumber> fill malloc'd areas with given value--free-fill=<hexnumber> fill free'd areas with given value--keep-stacktraces=alloc|free|alloc-and-free|alloc-then-free|nonestack trace(s) to keep for malloc'd/free'd areas [alloc-and-free]--show-mismatched-frees=no|yes show frees that don't match the allocator? [yes]
博主最常用的是内存诊断工具,使用方法如下:
valgrid --tool=memcheck ./test_file
注意: 编译时添加-g选项,使用memcheck检查时的错误信息可精确到行。
相关文章:

Valgrind内存诊断工具的使用笔记
Valgrind是一款用于内存调试、内存泄漏检测以及性能分析的神器,能够帮助我们快速定位到程序的内存问题,比如内存泄漏导致的 段错误 (核心已转储) 包含以下工具: Memcheck:检查程序中的内存问题,如泄漏、越界、非法指…...
docker安装Nacos
哈喽!大家好,我是旷世奇才李先生 文章持续更新,可以微信搜索【小奇JAVA面试】第一时间阅读,回复【资料】更有我为大家准备的福利哟,回复【项目】获取我为大家准备的项目 文章目录 一、Nacos是什么1、简介2、功能1、服务…...
【Linux】线程安全-死锁
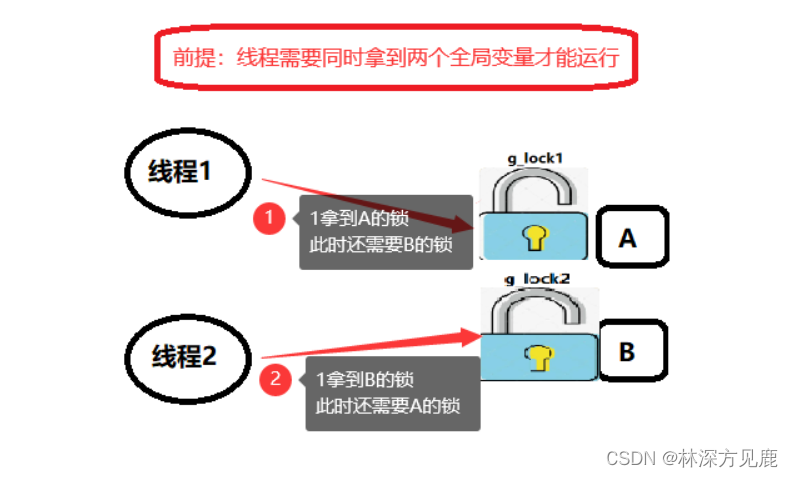
文章目录 死锁问题场景1场景2死锁的gdb调试造成死锁的必要条件不可剥夺循环等待互斥条件请求和保持 预防死锁破坏必要条件,循环等待&请求和保持加锁顺序一致避免锁没有被释放资源一次性分配 死锁问题 死锁的两种场景: 场景1 线程加锁之后一直没有将锁…...
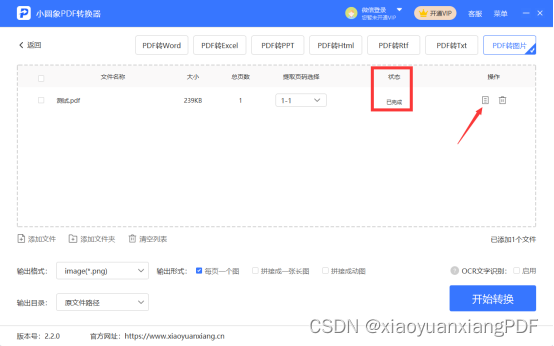
pdf转换成图片免费软件用哪个?pdf转换成图片就用它
随着技术的发展,现在企业办公运用到的电子文档各种各样,我们日常需要掌握的技能越来越高要求,其中pdf和图片是我们经常接触的文件格式之一,而且这两个文件格式我们会经常将它们进行转换,那么pdf转换成图片怎么操作呢?…...
【LeetCode】《LeetCode 101》第十二章:字符串
文章目录 12.1 字符串比较242 . 有效的字母异位词(简单)205. 同构字符串(简单)647. 回文子串(中等)696 . 计数二进制子串(简单) 12.2 字符串理解224. 基本计算器(困难&am…...

Android去掉视频声音
【Android】使用MediaExtractor、MediaMuxer去掉视频文件中的音频数据_android 去掉视频音频_little_fat_sheep的博客-CSDN博客 void removeSound() {try {String path Environment.getExternalStorageDirectory().getPath();String filename "no_sound_" input_p…...

java-thread-affinity线程绑核
通过将线程绑定到指定的cpu上,可以提高执行效率。因为每次都是相同的cpu,可以充分利用高速缓存,在java中可以使用以下依赖来使用。 <dependency><groupId>net.openhft</groupId><artifactId>affinity</artifactId><ver…...

Springboot - 5.test集成
👀1. 简介 spring-boot-starter-test是Spring Boot框架中的一个模块,用于支持在项目中进行单元测试和集成测试。它提供了一些依赖项和工具,使得编写和运行测试变得更加方便。以下是关于spring-boot-starter-test的全面介绍: ✌1…...

弯道超车必做好题集锦三(C语言编程题)
目录 前言: 1.单词倒排 方法1:scanf匹配特定字符法 方法2: 双指针法 2.统计每个月兔子的总数 方法1:斐波那契数列 方法2:斐波那契的递归 3.珠玑妙算 方法:遍历 4.寻找奇数(单身狗&#…...

JavaScript基础语法03——JS注释、结束符
哈喽,大家好,我是雷工! 今天继续学习JavaScript基础语法知识,注释和结束符,以下为学习笔记。 一、JavaScript注释 JavaScript注释有什么作用? JavaScript注释可以提高代码的可读性,能够帮助像…...
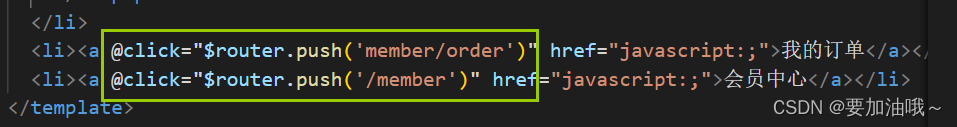
常见路由跳转的几种方式
常见的路由跳转有以下四种: 1. <router-link to"跳转路径"> /* 不带参数 */ <router-link :to"{name:home}"> <router-link :to"{path:/home}"> // 更建议用name // router-link链接中,带/ 表示从根…...

25.选择排序,归并排序,基数排序
目录 一. 选择排序 (1)简单选择排序 (2)堆排序 二. 归并排序 三. 基数排序 四. 各种排序方法的比较 (1)时间性能 (2)空间性能 (3)排序方法的稳定性能…...

DataX DorisWriter 插件DorisStreamLoadObserver类详细解读
DorisStreamLoadObserver 类是一个用于将数据加载到 Doris(以前称为 Palo)数据库中并监视加载过程的 Java 类。该类提供了一组方法,用于构建 HTTP 请求、处理 HTTP 响应以及监控数据加载的状态。以下是每个方法的具体作用: Doris…...
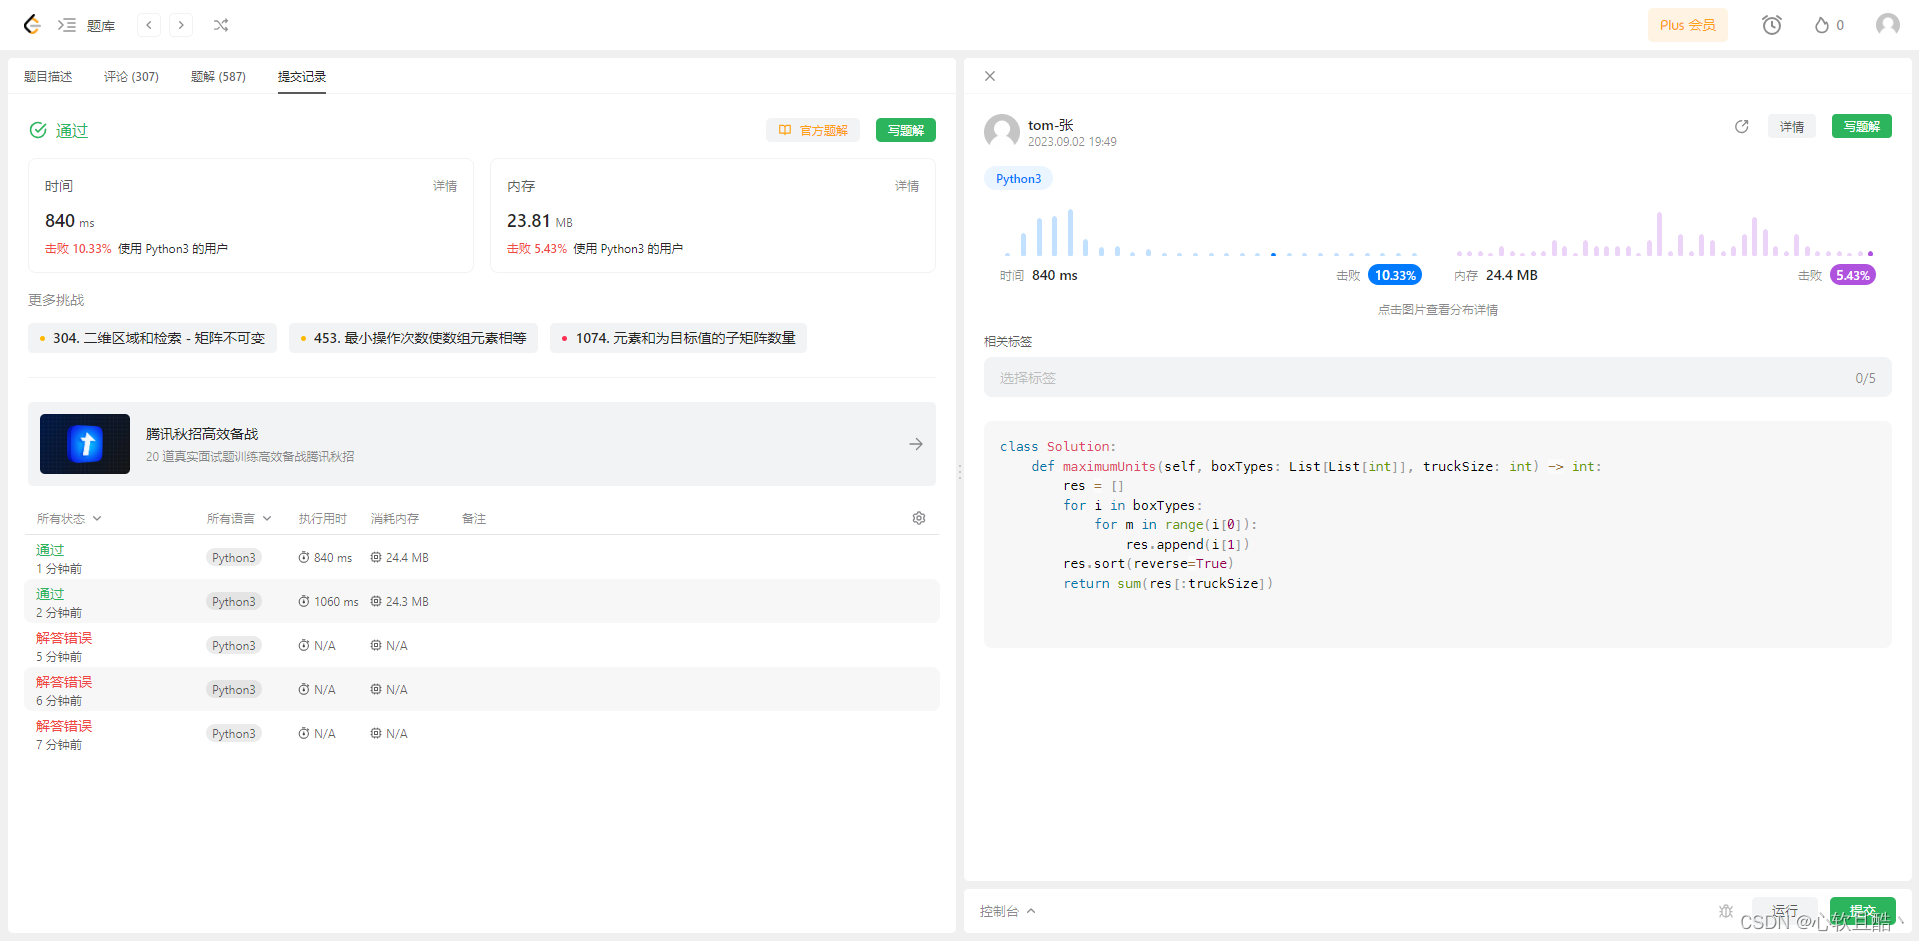
leetcode:1710. 卡车上的最大单元数(python3解法)
难度:简单 请你将一些箱子装在 一辆卡车 上。给你一个二维数组 boxTypes ,其中 boxTypes[i] [numberOfBoxesi, numberOfUnitsPerBoxi] : numberOfBoxesi 是类型 i 的箱子的数量。numberOfUnitsPerBoxi 是类型 i 每个箱子可以装载的单元数量。…...

Spring_JDBC的使用
Spring 是个一站式框架:Spring 自身也提供了控制层的 SpringMVC和持久层的 Spring JdbcTemplate。 配置信息 1.下载 Spring JdbcTemplate 的 jar 包,在pom.xml中导入 <dependency><groupId>org.springframework</groupId><artifactId>spr…...
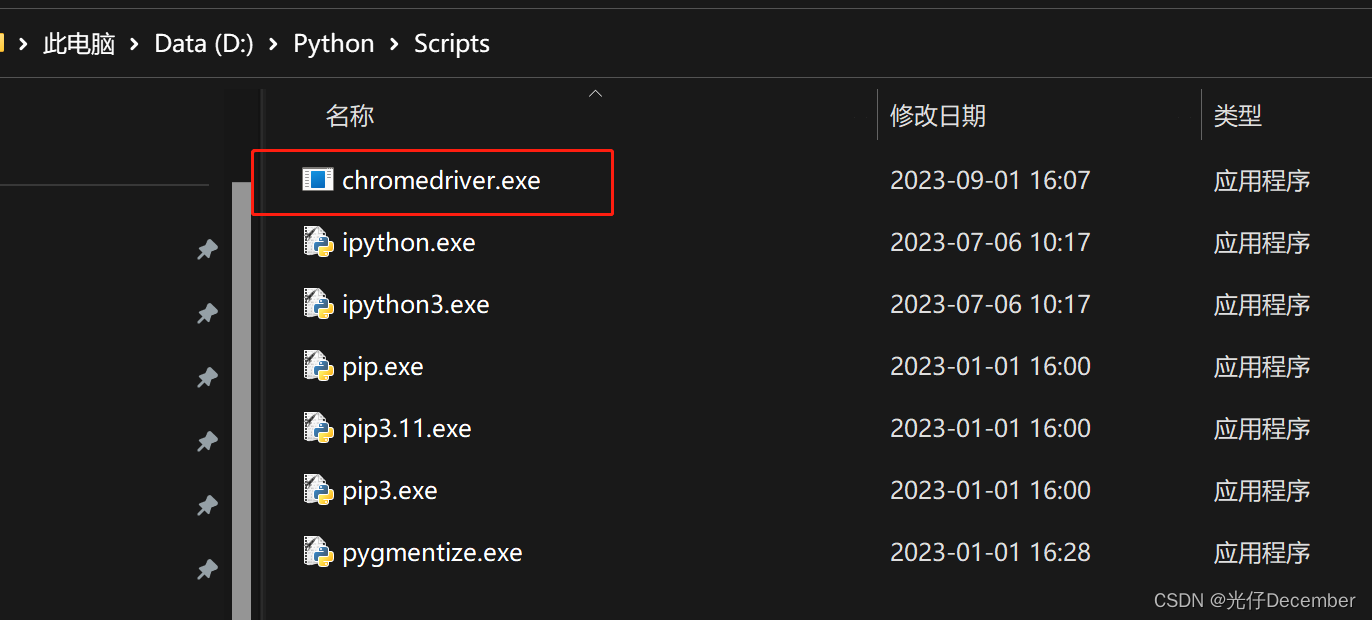
【Python从入门到进阶】34、selenium基本概念及安装流程
接上篇《33、使用bs4获取星巴克产品信息》 上一篇我们介绍了如何使用bs4来解析星巴克网站,获取其产品信息。本篇我们来了解selenium技术的基础。 一、什么是selenium? Selenium是一种用于自动化Web浏览器操作的开源工具。它提供了一组API(应…...

如何确保ChatGPT在文本生成中遵循道德和伦理准则?
确保ChatGPT在文本生成中遵循道德和伦理准则是一个复杂而重要的任务。人工智能(AI)系统,特别是语言模型,具有强大的生成能力,但如果不受到道德和伦理准则的约束,可能会导致一系列问题,包括歧视、…...

RISC-V Linux系统rootfs制作
文章目录 1、下载2、配置与编译3、运行 buildroot 是一个构建嵌入式Linux系统的框架。整个 buildroot 是由Makefile(*.mk) 脚本和 Kconfig(Config.in) 配置文件构成的,因此可以像配置 Linux 内核一样执行 make menuconfig 进行配置,编译出一个完整的、可…...

git常用场景记录 | 拉取远程分支A合并到本地分支B
文章目录 git常用场景记录拉取远程分支A合并到本地分支B本地分支B存在未add与commit的代码 git常用场景记录 doing,最后更新9.1 拉取远程分支A合并到本地分支B 需求描述 在团队合作时,我自己的本地分支B功能已经实现并合并到feature,之后发现…...

如何利用Linux进行数据管理和分析?
Linux是一款非常强大的操作系统,它不仅可以帮助你管理数据,还可以让你成为一名数据分析大师。只要你会使用命令行,你就可以用Linux进行数据管理和分析。 现在,让我们来看看如何使用Linux进行数据管理。 使用sort命令对数据进行排…...

使用TaoTokenCLI工具一键配置多开发环境下的API接入
🚀 告别海外账号与网络限制!稳定直连全球优质大模型,限时半价接入中。 👉 点击领取海量免费额度 使用TaoTokenCLI工具一键配置多开发环境下的API接入 在团队协作或个人多项目开发中,为每个项目或每台机器手动配置大模…...

Perplexity地理信息查询性能断崖式下跌?20年GIS架构师曝出隐藏瓶颈:HTTP/2连接复用失效+TLS 1.3握手阻塞链
更多请点击: https://codechina.net 第一章:Perplexity地理信息查询性能断崖式下跌现象全景透视 近期多个生产环境观测到,Perplexity模型在处理含经纬度坐标、行政区划嵌套(如“北京市朝阳区三里屯街道附近500米内POI”ÿ…...

颈椎健康互助平台
颈椎健康互助平台选题背景分析随着信息技术的飞速发展和现代社会工作、生活方式的深刻变革,颈椎健康问题已从一个单纯的医学议题,演变为一个影响广泛、亟待社会协同解决的公共健康挑战。颈椎健康互助平台的选题,正是在这一宏观背景下应运而生…...

Rerank:为什么它是 RAG 效果的分水岭?
在一个典型 RAG 流程中: 很多 Demo 系统会省略中间这一步: 直接把 Top-K 丢给模型 看起来能跑,但一旦进入真实场景,很快就会出现: 命中了,但排在后面噪声太多,污染上下文模型“理解错重点” 本…...

CLup使用:一键创建Doris存算一体集群
通过 CLup 数据库管理平台的可视化界面,一键自动化部署 Apache Doris 存算一体集群,自动完成环境检查、配置初始化、节点部署与集群注册,无需手动执行复杂的 FE/BE 配置与启动命令,大幅降低部署门槛。CLup安装部署请看:…...

如何用Python自动化脚本提升大麦网抢票成功率:完整配置指南
如何用Python自动化脚本提升大麦网抢票成功率:完整配置指南 【免费下载链接】DamaiHelper 大麦网演唱会演出抢票脚本。 项目地址: https://gitcode.com/gh_mirrors/dama/DamaiHelper 还在为抢不到周杰伦、五月天演唱会门票而烦恼吗?大麦网抢票脚本…...

vscode过滤文件
const fs require(fs); const { exec } require(child_process);// 在这里输入你的关键词,每行一个 const keywordsStr BV1wmXwBCEsZ BV1MR6wBREhY BV1DuoSYuEpX ; // // 将多行字符串按换行符分割,过滤掉空行 const keywords keywordsStr.trim()…...

中小企业老板必看:收藏这份AI转型轻装上阵指南,领跑AI浪潮!
文章指出,在AI浪潮下,中小企业并非处于劣势。通过“轻装上阵”策略,摆脱历史包袱,利用流程未固化、决策链短等优势,中小企业可以弯道超车。文章提出了五个AI转型方法论:1)轻装上阵,利…...
安装ROCm 4.5.2驱动及完整工具链)
保姆级教程:在Ubuntu 22.04上为DCU-Z100(ZiFang)安装ROCm 4.5.2驱动及完整工具链
国产AI加速卡DCU-Z100(ZiFang)全栈部署指南:从驱动安装到开发环境配置 在人工智能计算领域,国产硬件正逐步崭露头角。DCU-Z100(代号ZiFang)作为一款自主研发的深度学习计算单元,为开发者提供了全…...

工具推荐:HTML5+AI开发必备的前端调试工具
工具推荐:HTML5AI开发必备的前端调试工具 工具推荐:HTML5AI开发必备的前端调试工具📝 本章学习目标:本章聚焦职业发展,帮助读者规划HTML5AI的学习与职业路径。通过本章学习,你将全面掌握"工具推荐&…...