clusterprolifer go kegg msigdbr 富集分析应该使用哪个数据集,GO?KEGG?Hallmark?
关注微信:生信小博士
5 Overview of enrichment analysis
Chapter 5 Overview of enrichment analysis | Biomedical Knowledge Mining using GOSemSim and clusterProfiler
5.1.2 Gene Ontology (GO)
Gene Ontology defines concepts/classes used to describe gene function, and relationships between these concepts. It classifies functions along three aspects:
- MF: Molecular Function
- molecular activities of gene products
- CC: Cellular Component
- where gene products are active
- BP: Biological Process
- pathways and larger processes made up of the activities of multiple gene products
GO terms are organized in a directed acyclic graph, where edges between terms represent parent-child relationship.
5.1.3 Kyoto Encyclopedia of Genes and Genomes (KEGG)
KEGG is a collection of manually drawn pathway maps representing molecular interaction and reaction networks. These pathways cover a wide range of biochemical processes that can be divided into 7 broad categories:
- Metabolism
- Genetic information processing
- Environmental information processing
- Cellular processes
- Organismal systems
- Human diseases
- Drug development.
5.1.4 Other gene sets
GO and KEGG are the most frequently used for functional analysis. They are typically the first choice because of their long-standing curation and availability for a wide range of species.
Other gene sets include but are not limited to Disease Ontology (DO), Disease Gene Network (DisGeNET), wikiPathways, Molecular Signatures Database (MSigDb).
富集分析的原理
Over Representation Analysis (ORA)和Gene Set Enrichment Analysis (GSEA)是用于分析基因表达数据的两种常见方法。ORA基于预定义的基因集,用超几何分布计算差异表达基因与该基因集中的基因数之间的显著性,适用于已知基因集和差异表达较大情况。GSEA考虑所有基因,根据基因在表型排序上的变化来寻找整个基因集是否显著富集,比ORA更适用于寻找微小但协调变化的基因集。GSEA还包括较新的leading edge analysis和core enriched genes等功能,能够帮助确定影响基因富集的关键基因。两种方法各有优缺点,在不同的研究问题中可以灵活选用。
5.2 原理1 Over Representation Analysis
Example: Suppose we have 17,980 genes detected in a Microarray study and 57 genes were differentially expressed. Among the differentially expressed genes, 28 are annotated to a gene set1.
d <- data.frame(gene.not.interest=c(2613, 15310), gene.in.interest=c(28, 29))
row.names(d) <- c("In_category", "not_in_category")
d
## gene.not.interest gene.in.interest
## In_category 2613 28
## not_in_category 15310 29Whether the overlap(s) of 25 genes are significantly over represented in the gene set can be assessed using a hypergeometric distribution. This corresponds to a one-sided version of Fisher’s exact test.
fisher.test(d, alternative = "greater")5.3 原理2 Gene Set Enrichment Analysis
ORA的方法,对于差异明显的对比结果较好,但是对于差异小的结果不好
A common approach to analyzing gene expression profiles is identifying differentially expressed genes that are deemed interesting. The ORA enrichment analysis is based on these differentially expressed genes. This approach will find genes where the difference is large and will fail where the difference is small, but evidenced in coordinated way in a set of related genes. Gene Set Enrichment Analysis (GSEA)(Subramanian et al. 2005) directly addresses this limitation. All genes can be used in GSEA; GSEA aggregates the per gene statistics across genes within a gene set, therefore making it possible to detect situations where all genes in a predefined set change in a small but coordinated way. This is important since it is likely that many relevant phenotypic differences are manifested by small but consistent changes in a set of genes.
Genes are ranked based on their phenotypes. Given apriori defined set of gene S (e.g., genes sharing the same DO category), the goal of GSEA is to determine whether the members of S are randomly distributed throughout the ranked gene list (L) or primarily found at the top or bottom.
There are three key elements of the GSEA method:
- Calculation of an Enrichment Score.
- The enrichment score (ES) represents the degree to which a set S is over-represented at the top or bottom of the ranked list L. The score is calculated by walking down the list L, increasing a running-sum statistic when we encounter a gene in S and decreasing when it is not encountered. The magnitude of the increment depends on the gene statistics (e.g., correlation of the gene with phenotype). The ES is the maximum deviation from zero encountered in the random walk; it corresponds to a weighted Kolmogorov-Smirnov(KS)-like statistic (Subramanian et al. 2005).
- Esimation of Significance Level of ES.
- The p-value of the ES is calculated using a permutation test. Specifically, we permute the gene labels of the gene list L and recompute the ES of the gene set for the permutated data, which generate a null distribution for the ES. The p-value of the observed ES is then calculated relative to this null distribution.
- Adjustment for Multiple Hypothesis Testing.
- When the entire gene sets are evaluated, the estimated significance level is adjusted to account for multiple hypothesis testing and also q-values are calculated for FDR control.
We implemented the GSEA algorithm proposed by Subramanian (Subramanian et al. 2005). Alexey Sergushichev implemented an algorithm for fast GSEA calculation in the fgsea (Korotkevich, Sukhov, and Sergushichev 2019) package. In our packages (clusterProfiler, DOSE, meshes and ReactomePA), users can use the GSEA algorithm implemented in DOSE or fgsea by specifying the parameter by="DOSE" or by="fgsea". By default, the fgsea method will be used since it is much more faster.
5.4 原理3 Leading edge analysis and core enriched genes
Leading edge analysis reports Tags to indicate the percentage of genes contributing to the enrichment score, List to indicate where in the list the enrichment score is attained and Signal for enrichment signal strength.
It would also be very interesting to get the core enriched genes that contribute to the enrichment. Our packages (clusterProfiler, DOSE, meshes and ReactomePA) support leading edge analysis and report core enriched genes in GSEA analysis.
详细的富集分析使用范围及其原理
1 GO 富集
GO comprises three orthogonal ontologies, i.e. molecular function (MF), biological process (BP), and cellular component (CC).
6.1 Supported organisms
GO analyses (groupGO(), enrichGO() and gseGO()) support organisms that have an OrgDb object available (see also session 2.2).
If a user has GO annotation data (in a data.frame format with the first column as gene ID and the second column as GO ID), they can use the enricher() and GSEA() functions to perform an over-representation test and gene set enrichment analysis.
If the genes are annotated by direction annotation, they should also be annotated by their ancestor GO nodes (indirect annotation). If a user only has direct annotation, they can pass their annotation to the buildGOmap function, which will infer indirect annotation and generate a data.frame that is suitable for both enricher() and GSEA().
6.2 groupGo是 对基因的分类
In clusterProfiler, the groupGO() function is designed for gene classification based on GO distribution at a specific level. Here we use the dataset geneList provided by DOSE.
library(clusterProfiler)
data(geneList, package="DOSE")
gene <- names(geneList)[abs(geneList) > 2]# Entrez gene ID
head(gene)
## [1] "4312" "8318" "10874" "55143" "55388" "991"ggo <- groupGO(gene = gene,OrgDb = org.Hs.eg.db,ont = "CC",level = 3,readable = TRUE)head(ggo)6.3 enrichGO()是通过ORA对基因进行富集分析
The clusterProfiler package implements enrichGO() for gene ontology over-representation test.
ego <- enrichGO(gene          = gene,universe      = names(geneList),OrgDb         = org.Hs.eg.db,ont           = "CC",pAdjustMethod = "BH",pvalueCutoff  = 0.01,qvalueCutoff  = 0.05,readable      = TRUE)
head(ego)
gene.df <- bitr(gene, fromType = "ENTREZID",toType = c("ENSEMBL", "SYMBOL"),OrgDb = org.Hs.eg.db)ego2 <- enrichGO(gene = gene.df$ENSEMBL,OrgDb = org.Hs.eg.db,keyType = 'ENSEMBL',ont = "CC",pAdjustMethod = "BH",pvalueCutoff = 0.01,qvalueCutoff = 0.05)
head(ego2, 3) 6.4 gseGO()
gseGO()The clusterProfiler package provides the gseGO() function for gene set enrichment analysis using gene ontology.
ego3 <- gseGO(geneList = geneList,OrgDb = org.Hs.eg.db,ont = "CC",minGSSize = 100,maxGSSize = 500,pvalueCutoff = 0.05,verbose = FALSE)The format of input data, geneList, was documented in the FAQ. Beware that only gene Set size in [minGSSize, maxGSSize] will be tested.
A.1 How to prepare your own geneList
GSEA analysis requires a ranked gene list, which contains three features:
- numeric vector: fold change or other type of numerical variable
- named vector: every number has a name, the corresponding gene ID
- sorted vector: number should be sorted in decreasing order
If you import your data from a csv file, the file should contains two columns, one for gene ID (no duplicated ID allowed) and another one for fold change. You can prepare your own geneList via the following command:
d = read.csv(your_csv_file)
## assume 1st column is ID
## 2nd column is FC## feature 1: numeric vector
geneList = d[,2]## feature 2: named vector
names(geneList) = as.character(d[,1])## feature 3: decreasing orde
geneList = sort(geneList, decreasing = TRUE)
7.2 KEGG pathway ORA
Input ID type can be kegg, ncbi-geneid, ncbi-proteinid or uniprot (see also session 16.1.2). Unlike enrichGO(), there is no readable parameter for enrichKEGG(). However, users can use the setReadable() function if there is an OrgDb available for the species.
data(geneList, package="DOSE")
gene <- names(geneList)[abs(geneList) > 2]kk <- enrichKEGG(gene         = gene,organism     = 'hsa',pvalueCutoff = 0.05)
head(kk)
## ID Description ## hsa04110 hsa04110 Cell cycle ## hsa04114 hsa04114 Oocyte meiosis ## hsa04218 hsa04218 Cellular senescence ## hsa04061 hsa04061 Viral protein interaction with cytokine and cytokine receptor ## hsa03320 hsa03320 PPAR signaling pathway ## hsa04914 hsa04914 Progesterone-mediated oocyte maturation ## GeneRatio BgRatio pvalue p.adjust qvalue ## hsa04110 11/94 126/8142 1.829412e-07 3.841764e-05 3.774365e-05 ## hsa04114 10/94 131/8142 2.368439e-06 2.486861e-04 2.443231e-04 ## hsa04218 10/94 156/8142 1.135672e-05 7.949704e-04 7.810235e-04 ## hsa04061 8/94 100/8142 1.821466e-05 9.562698e-04 9.394931e-04 ## hsa03320 7/94 75/8142 2.285993e-05 9.601169e-04 9.432728e-04 ## hsa04914 7/94 102/8142 1.651911e-04 5.781690e-03 5.680256e-03 ## geneID Count ## hsa04110 8318/991/9133/890/983/4085/7272/1111/891/4174/9232 11 ## hsa04114 991/9133/983/4085/51806/6790/891/9232/3708/5241 10 ## hsa04218 2305/4605/9133/890/983/51806/1111/891/776/3708 10 ## hsa04061 3627/10563/6373/4283/6362/6355/9547/1524 8 ## hsa03320 4312/9415/9370/5105/2167/3158/5346 7 ## hsa04914 9133/890/983/4085/6790/891/5241 7
7.3 KEGG pathway GSEA
kk2 <- gseKEGG(geneList     = geneList,organism     = 'hsa',minGSSize    = 120,pvalueCutoff = 0.05,verbose      = FALSE)
head(kk2)
## ID Description setSize
## hsa05169 hsa05169 Epstein-Barr virus infection 193
## hsa04613 hsa04613 Neutrophil extracellular trap formation 130
## hsa05166 hsa05166 Human T-cell leukemia virus 1 infection 202
## hsa04510 hsa04510 Focal adhesion 190
## hsa04218 hsa04218 Cellular senescence 141
## hsa05170 hsa05170 Human immunodeficiency virus 1 infection 189
## enrichmentScore NES pvalue p.adjust qvalues rank
## hsa05169 0.4335010 1.962039 5.505487e-08 4.239225e-06 2.839672e-06 2820
## hsa04613 0.4496569 1.934454 6.345081e-06 2.442856e-04 1.636363e-04 2575
## hsa05166 0.3893613 1.755469 1.357530e-05 3.484327e-04 2.333999e-04 1955
## hsa04510 -0.4169068 -1.691234 2.771385e-05 5.334917e-04 3.573629e-04 2183
## hsa04218 0.4115945 1.783044 5.168200e-05 7.959028e-04 5.331406e-04 1155
## hsa05170 0.3711150 1.677643 1.118012e-04 1.229814e-03 8.237986e-04 3178
## leading_edge
## hsa05169 tags=39%, list=23%, signal=31%
## hsa04613 tags=37%, list=21%, signal=30%
## hsa05166 tags=26%, list=16%, signal=22%
## hsa04510 tags=27%, list=17%, signal=22%
## hsa04218 tags=17%, list=9%, signal=16%
## hsa05170 tags=38%, list=25%, signal=29%
## core_enrichment
## hsa05169 3627/890/6890/9636/898/9134/6502/6772/3126/3112/4609/917/5709/1869/3654/919/915/4067/4938/864/4940/5713/5336/11047/3066/54205/1871/578/1019/637/916/3383/4939/10213/23586/4793/5603/7979/7128/6891/930/5714/3452/6850/5702/4794/7124/3569/7097/5708/2208/8772/3119/5704/7186/5971/3135/1380/958/5610/4792/10018/8819/3134/10379/9641/1147/5718/6300/3109/811/5606/2923/3108/5707/1432
## hsa04613 820/366/51311/64581/3015/85236/55506/8970/8357/1535/2359/5336/4688/92815/3066/8336/292/1991/3689/8345/5603/4689/5880/10105/1184/6404/3018/6850/5604/3014/7097/1378/8290/1536/834/5605/1183/728/2215/8335/5594/9734/3674/5578/5582/7417/8331/6300
## hsa05166 991/9133/890/4085/7850/1111/9232/8061/701/9700/898/4316/9134/3932/3559/3126/3112/4609/3561/917/1869/1029/915/114/2005/5902/55697/1871/1031/2224/292/1019/3689/916/3383/11200/706/3600/6513/3601/468/5604/7124/1030/3569/4049/4055/10393/3119/5901/5971/1959/3135
## hsa04510 5595/5228/7424/1499/4636/83660/7059/5295/1288/23396/3910/3371/3082/1291/394/3791/7450/596/3685/1280/3675/595/2318/3912/1793/1278/1277/1293/10398/55742/2317/7058/25759/56034/3693/3480/5159/857/1292/3908/3909/63923/3913/1287/3679/7060/3479/10451/80310/1311/1101
## hsa04218 2305/4605/9133/890/983/51806/1111/891/993/3576/1978/898/9134/4609/1869/1029/22808/1871/5499/91860/292/1019/11200/1875
## hsa05170 9133/9582/983/51806/1111/891/6890/200315/917/3654/919/915/5336/54205/91860/578/995/25939/637/1234/916/5603/2792/5880/6891/6921/3452/5604/7124/9978/7097/7852/8772/1174/7186/3135/164/60489/2787/356/7133/5605/27350/6199/1642/5594/4792/3134/5578/4893/8454/5582/2786/1147/3984/6300/200316/811/5606/2923/4775/162/1432/2784/836/5747/5058/3106/2770/5534/5579/46157.4 KEGG module ORA. 这里的module指的是msigdb种收集的其他kegg内容,共有
KEGG Module is a collection of manually defined function units. In some situation, KEGG Modules have a more straightforward interpretation.
mkk <- enrichMKEGG(gene = gene,organism = 'hsa',pvalueCutoff = 1,qvalueCutoff = 1)
head(mkk)
3.KEGG 分类备注
KEGG Pathway可以进行分类汇总。
在KEGG官网(KEGG PATHWAY Database)中,将通路分成了7类:
1. Metabolism (代谢)
2. Genetic Information Processing (遗传信息处理)
3. Environmental Information Processing (环境信息处理)
4. Cellular Processes (细胞过程)
5. Organismal Systems (生物系统)
6. Human Diseases (人类疾病)
7. Drug Development (药物开发)
做出一个分类汇总图,这样可以在更上一层级研究pathway。主要应用于特殊物种的denovo测序注释,也可以应用于我们常规的pathway富集分析。
7.5 KEGG module gene set enrichment analysis
mkk2 <- gseMKEGG(geneList = geneList,organism = 'hsa',pvalueCutoff = 1)
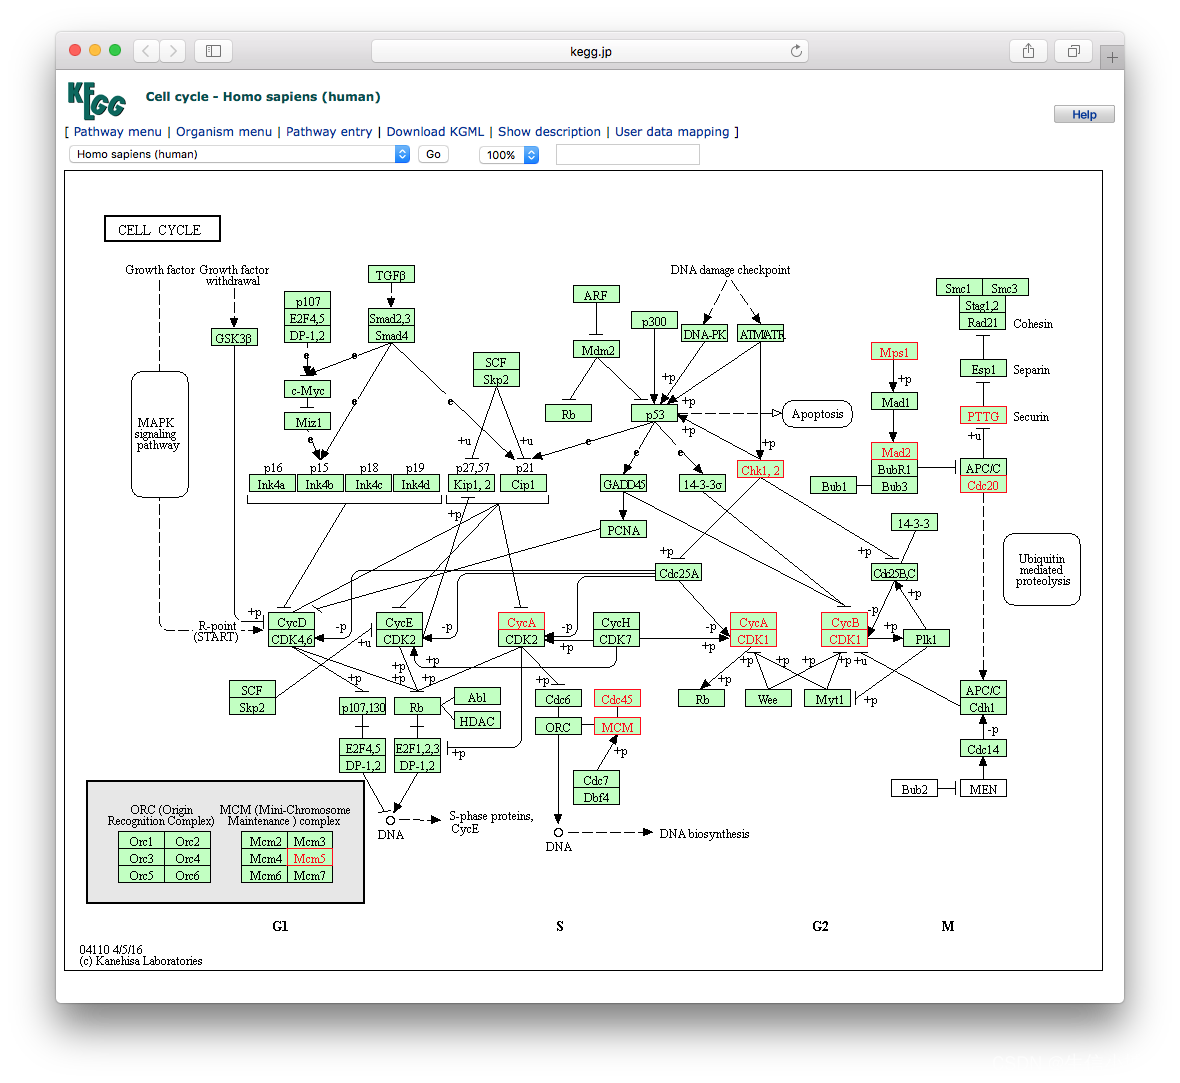
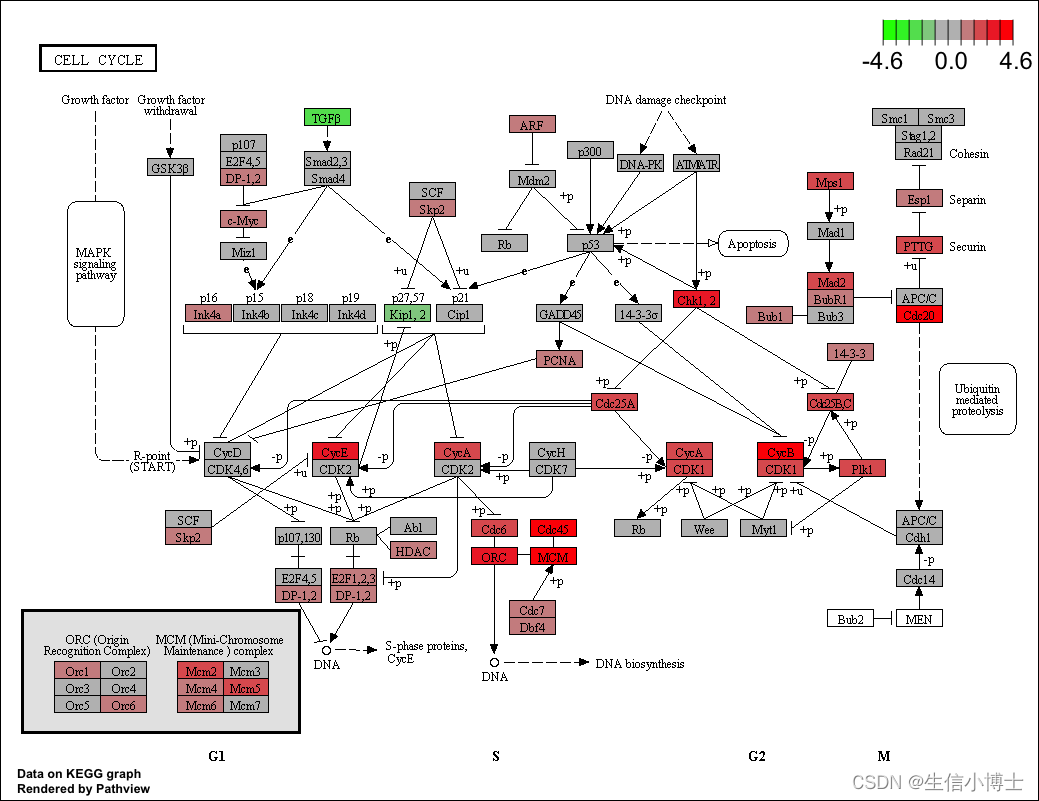
head(mkk2)通路可视化
library("pathview")
 hsa04110 <- pathview(gene.data  = geneList,
                      pathway.id = "hsa04110",
                      species    = "hsa",
                      limit      = list(gene=max(abs(geneList)), cpd=1))
browseKEGG(kk, 'hsa04110')
相关文章:
clusterprolifer go kegg msigdbr 富集分析应该使用哪个数据集,GO?KEGG?Hallmark?
关注微信:生信小博士 5 Overview of enrichment analysis Chapter 5 Overview of enrichment analysis | Biomedical Knowledge Mining using GOSemSim and clusterProfiler 5.1.2 Gene Ontology (GO) Gene Ontology defines concepts/classes used to describ…...

Linux学习笔记1-入门
前言:之前的基于单片机的闭环控制步进电机项目其实已经完成了,但很多时间都花在调试和生产上,实在没时间去做总结笔记,现在又开始做新项目了,从单片机到了Linux,想用这个平台来督促自己继续学习,…...

怎样更有效的运营Etsy店铺?
大家都知道,Etsy作为一个重要的电商平台,给很多人提供了不少机会。但是如何取得etsy店铺运营的成功呢?第一步就是选好辅助工具。 什么是指纹浏览器? VMLogin指纹浏览器(www.vmlogin.com.cn) 是一种工具,通过伪装用户…...

Vue 项目中如何使用Bootstrap5(简单易懂)
Vue 项目中如何使用Bootstrap5(简单易懂) 安装在 src/main.js 文件下引入包在vue文件中使用 Bootstrap官网(中文):https://www.bootcss.com/ Bootstrap5文档:https://v5.bootcss.com/docs/getting-started/…...
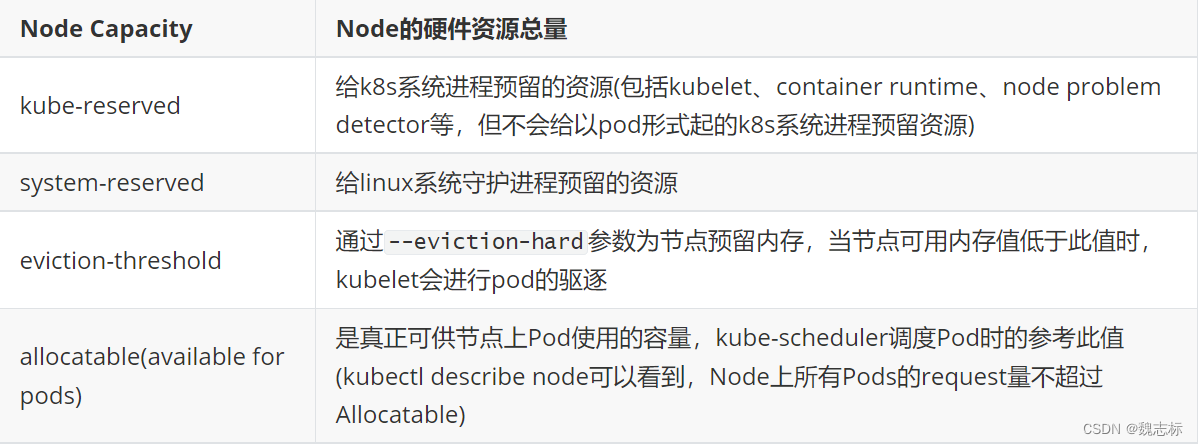
k8s 资源预留
KUBERNETES资源管理之–资源预留 Kubernetes 的节点可以按照 Capacity 调度。node节点本身除了运行不少驱动 OS 和 Kubernetes 的系统守护进程,默认情况下 pod 能够使用节点全部可用容量, 除非为这些系统守护进程留出资源,否则它们将与 pod 争…...
微信小程序自定义弹窗阻止滑动冒泡catchtouchmove之后弹窗内部内容无法滑动
自定义弹窗 如图所示: 自定义弹窗内部有带滚动条的盒子区域 问题: 在盒子上滑动,页面如果超出一屏的话,也会跟着一起上下滚动 解决方案:给自定义弹窗 添加 catchtouchmove 事件,阻止冒泡即可 网上不少…...
Linux 命令速查
Network ping ping -c 3 -i 0.01 127.0.0.1 # -c 指定次数 # -i 指定时间间隔 日志 一般存放位置: /var/log,包含:系统连接日志 进程统计 错误日志 常见日志文件说明 日志功能access-logweb服务访问日志acct/pacct用户命令btmp记录失…...

第22期 | GPTSecurity周报
GPTSecurity是一个涵盖了前沿学术研究和实践经验分享的社区,集成了生成预训练 Transformer(GPT)、人工智能生成内容(AIGC)以及大型语言模型(LLM)等安全领域应用的知识。在这里,您可以…...

JavaScript前端 console 控制台详细解析与代码实例
JavaScript Console(控制台)是一个重要的工具,可以用于调试和测试 JavaScript 代码。在浏览器中,你可以使用控制台来查看 JavaScript 输出、测试代码、调试错误等。在本文中,我们将详细介绍控制台的常用功能和代码实例…...
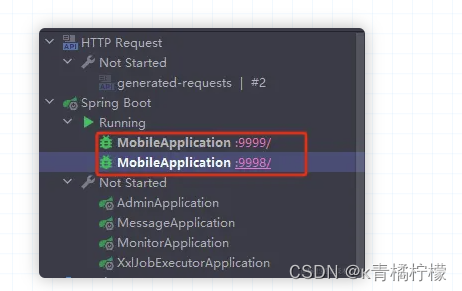
idea中启动多例项目配置
多实例启动 日常本地开发微服务项目时,博主想要验证一下网关的负载均衡以及感知服务上下线能力时,需要用到多实例启动。 那么什么是多实例启动嘞?简单说就是能在本地同时启动多个同一服务。打个比方项目中有一个 MobileApplication 服务&…...
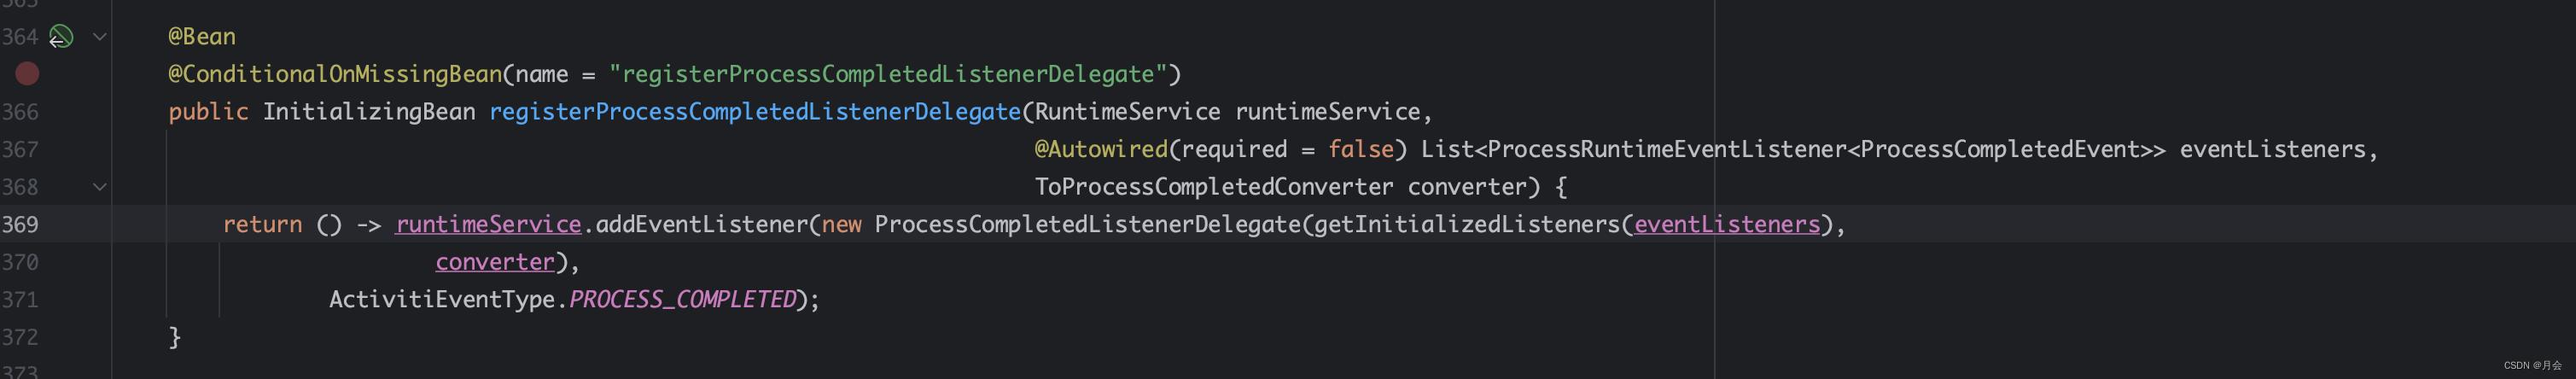
Activiti7流程结束监听事件中,抛出的异常无法被spring全局异常捕捉
ProcessRuntimeEventListener activiti7中,提供了ProcessRuntimeEventListener监听器,用于监听流程实例的结束事件 /*** 流程完成监听器*/ Slf4j Component public class ProcessCompleteListener implements ProcessRuntimeEventListener<ProcessC…...

Android 默认关闭自动旋转屏幕功能
Android 默认关闭自动旋转屏幕功能 接到客户邮件想要默认关闭设备的自动旋转屏幕功能,具体修改参照如下: /vendor/mediatek/proprietary/packages/apps/SettingsProvider/res/values/defaults.xml - <bool name"def_accelerometer_rotati…...

软文推广方案,媒介盒子分享
作为企业宣传的手段,它能用较低的成本获得较好的宣传效果,但有许多企业在进行软文推广时并不起效,这是因为没掌握好方法。今天媒介盒子就来告诉大家,通用的软文推广方案。 一、 明确推广目标以及受众 明确软文推广的目标有助于明…...

CSDN热榜分析6:将实时爬取的热榜数据导入sqlite
文章目录 初始化数据库接口更改数据库写入 初始化数据库 引入数据库的目的不止是为了存储,更多地也是为了便于查询,否则也没必要用一个Text控件来展示信息了。 所以一个正常的工作逻辑是,一打开热榜分析系统,也就同步打开数据库…...

2023年11月1日,Google全新域名来袭:.ing域名现已问世!
2023年11月1日(Oct31,2023美国与中国时差)Google宣布,正式推出.ing域名,这是一种新的顶级域名,旨在为用户提供更多的选择和创意。.ing域名是由Google和国际互联网名称与数字地址分配机构(ICANN)合作开发的,…...
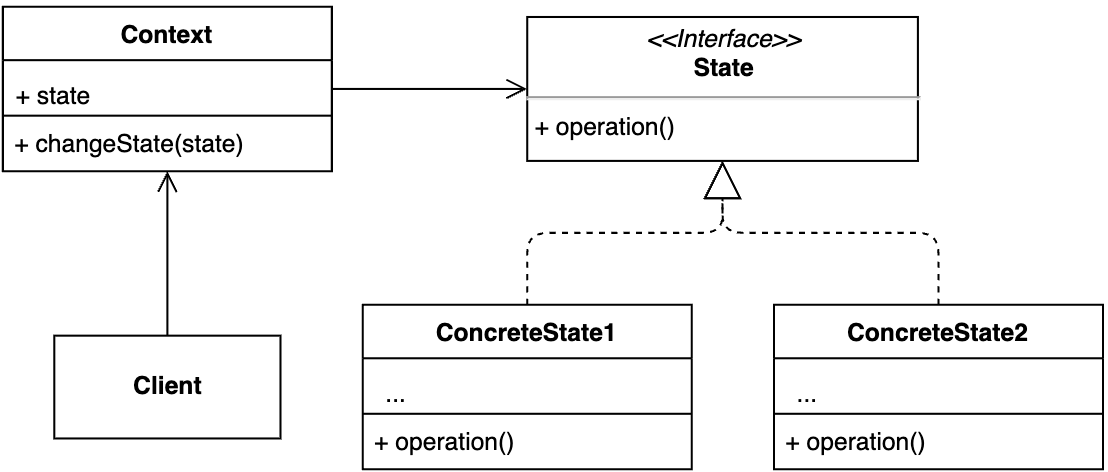
【设计模式】第22节:行为型模式之“状态模式”
一、简介 状态模式一般用来实现状态机,而状态机常用在游戏、工作流引擎等系统开发中。不过,状态机的实现方式有多种,除了状态模式,比较常用的还有分支逻辑法和查表法。该模式允许对象内部状态改变使改变它的行为。 二、适用场景…...

JavaSE21——ArrayList
集合框架 ArrayList 一、概述 ArrayList 类是一个可以动态修改的数组,与普通数组的区别就是它是没有固定大小的限制,我们可以添加或删除元素。 ArrayList 继承了 AbstractList ,并实现了 List 接口。 ArrayList中的元素可以通过索引访问…...
)
找质数(枚举 埃氏筛 线性筛)
输入一个数,返回小于等于这个数的质数。 枚举法: public static int countPrimes(int n) {int cnt0;for(int i2;i<n;i) {if(prime(i))cnt;}return cnt;}private static boolean prime(int x) {for(int i2;i*i<x;i){if(x%i0)return false;}return …...
 - 标志)
第十二章 ObjectScript 系统标志和限定符 (qspec) - 标志
文章目录 第十二章 ObjectScript 系统标志和限定符 (qspec) - 标志 示例取消Negation标志Flags 第十二章 ObjectScript 系统标志和限定符 (qspec) - 标志 类库中的许多方法都接受 qspec 参数,通过该参数,可以控制将外部源导入 IRIS、控制代码的编译方式以…...
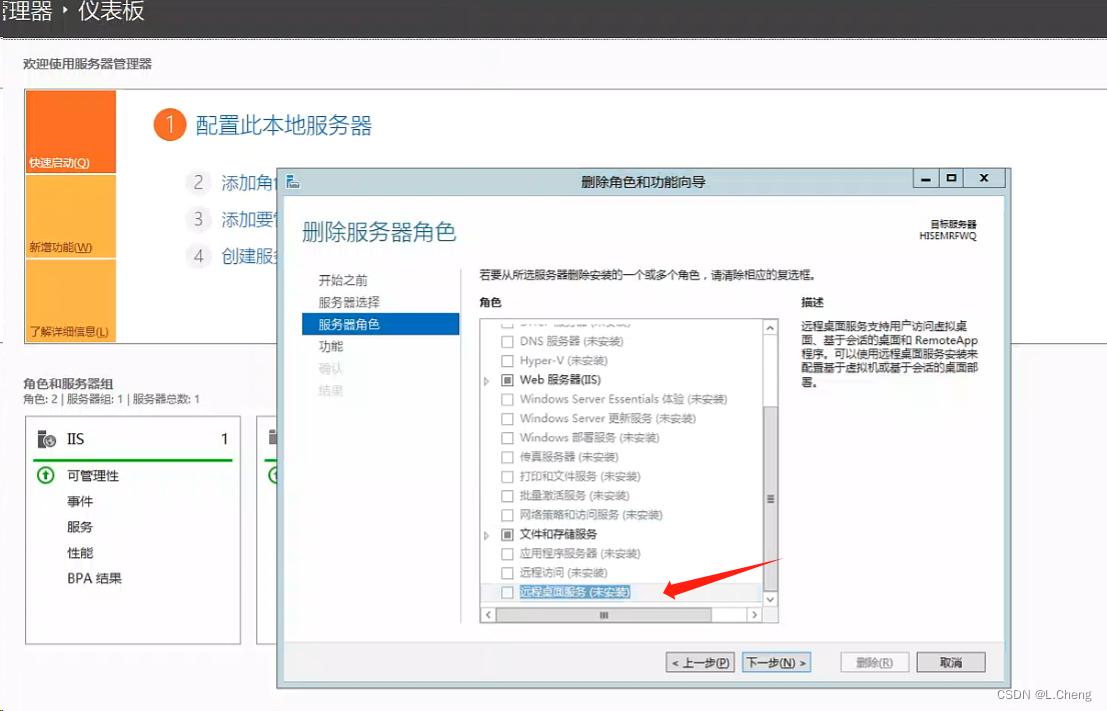
解决Windows Server 2012 由于没有远程桌面授权服务器可以提供需求可证
刚开始提示 之后就登录不了 (如下图提示) 由于windows server 2012 R2 安装了 远程桌面角色,但是这个角色是120天免费的,需要购买授权的。解决方法是取消/删除这个角色,就可以恢复正常的远程 一直下一步 远程桌面服…...

如何轻松配置开源工具:3步实现WeMod高级功能解锁
如何轻松配置开源工具:3步实现WeMod高级功能解锁 【免费下载链接】Wand-Enhancer Advanced UX and interoperability extension for Wand (WeMod) app 项目地址: https://gitcode.com/gh_mirrors/we/Wand-Enhancer 还在为WeMod Pro订阅费烦恼吗?W…...

MySQL 分库分表实战
# MySQL 分库分表实战数据量到了千万级,单表扛不住了,就要分库分表。这篇说说怎么做。## 什么时候需要分库分表? 单表数据量: - < 500万:不用分,加索引、优化 SQL - 500万~2000万࿱…...

Wand-Enhancer终极指南:3步免费解锁WeMod Pro高级功能完整教程
Wand-Enhancer终极指南:3步免费解锁WeMod Pro高级功能完整教程 【免费下载链接】Wand-Enhancer Advanced UX and interoperability extension for Wand (WeMod) app 项目地址: https://gitcode.com/gh_mirrors/we/Wand-Enhancer 还在为每月支付WeMod Pro订阅…...

7自由度机械臂逆运动学求解:13种算法对比与混合策略实战
1. 项目概述:当机械臂遇到“无限可能”的烦恼在机器人领域,让机械臂的“手”(末端执行器)精准地到达一个指定的位置和姿态,是一个看似简单实则复杂的基础问题,这就是逆运动学。对于常见的6自由度机械臂&…...

基于密度距离度量构建高质量科学仿真训练集:从原理到工程实践
1. 项目概述:从仿真数据到高质量训练集的桥梁在计算物理、流体力学或者天体物理模拟这类科学计算项目中,我们常常会生成海量的仿真数据。这些数据,比如一个随时间演化的等离子体密度场,其本身是复杂且高维的。直接把这些“原始矿石…...
)
火焰不飘、不燃、不爆?,Midjourney 6.6火效失效紧急修复方案(含--no参数黑名单清单与替代性热力图引导法)
更多请点击: https://codechina.net 第一章:火焰不飘、不燃、不爆?——Midjourney 6.6火效失效现象的本质溯源 近期大量用户反馈,在 Midjourney v6.6 中使用 fire、 flame、 blazing 等关键词生成图像时,火焰元素普遍…...

ISP模型与硬件平台配置迁移实践指南
1. 理解ISP模型与硬件平台的配置迁移在图像信号处理器(ISP)开发过程中,我们经常需要在软件模型和实际硬件平台之间进行配置迁移。这种迁移的核心挑战在于确保模型仿真结果与硬件输出完全一致。根据我的经验,这涉及到两个主要操作模…...

可解释AI在宏基因组学中的应用:从黑箱预测到透明洞察
1. 项目概述:当宏基因组学遇见可解释AI如果你在生物信息学或精准医疗领域工作,最近几年一定被两个词刷屏了:一个是“宏基因组学”,另一个是“可解释AI”。前者让我们得以窥见人体内万亿微生物构成的复杂宇宙,后者则试图…...

遥感因果分析:多尺度表征拼接技术解析与工程实践
1. 项目概述:从“看”到“理解”的遥感因果分析新思路在遥感图像分析领域,我们早已不满足于仅仅“看到”地物。从土地利用分类到灾害评估,核心目标正从“是什么”转向“为什么”和“会怎样”。比如,我们不仅想知道某片区域是农田&…...

Ubuntu 22.04双网卡配置踩坑记:netplan apply报错‘默认路由冲突’的三种解法
Ubuntu 22.04双网卡路由冲突实战指南:从紧急修复到高阶策略当你为Ubuntu服务器配置双网卡时,netplan apply命令突然抛出"Conflicting default route declarations for IPv4"错误,这种场景对运维工程师来说再熟悉不过。本文将带你深…...