C#基于ScottPlot进行可视化
前言
上一篇文章跟大家分享了用NumSharp实现简单的线性回归,但是没有进行可视化,可能对拟合的过程没有直观的感受,因此今天跟大家介绍一下使用C#基于Scottplot进行可视化,当然Python的代码,我也会同步进行可视化。
Python代码进行可视化
Python代码用matplotlib做了可视化,我就不具体介绍了。
修改之后的python代码如下:
#The optimal values of m and b can be actually calculated with way less effort than doing a linear regression.
#this is just to demonstrate gradient descentimport numpy as np
import matplotlib.pyplot as plt
from matplotlib.animation import FuncAnimation# y = mx + b
# m is slope, b is y-intercept
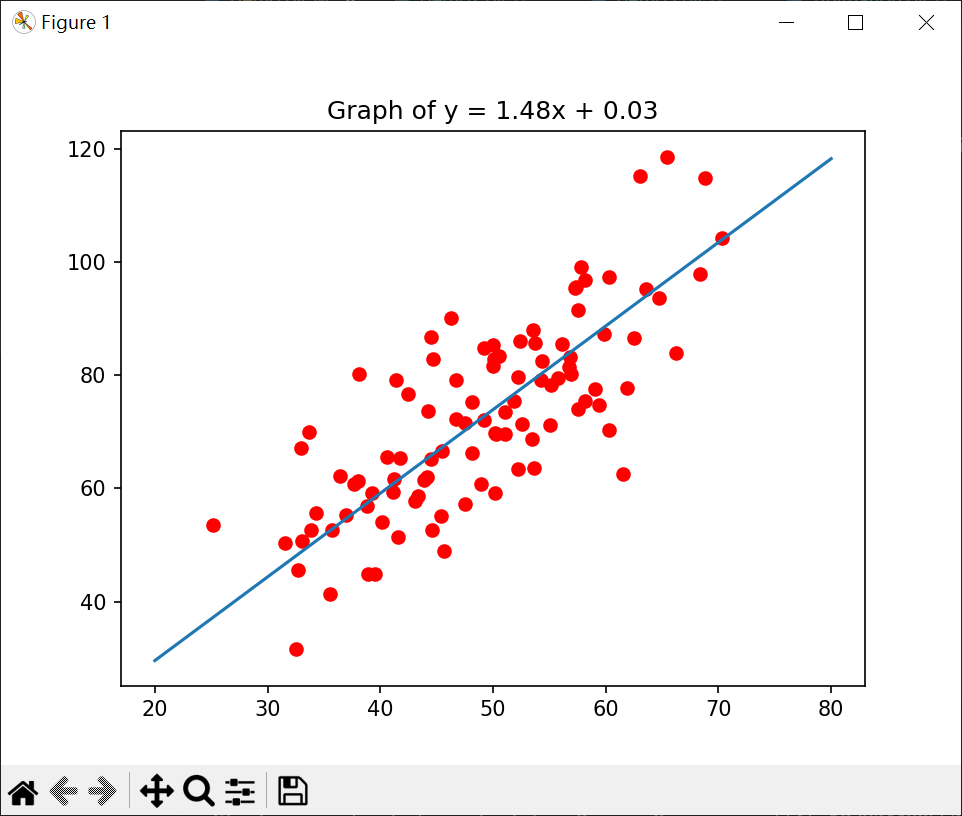
def compute_error_for_line_given_points(b, m, points):totalError = 0for i in range(0, len(points)):x = points[i, 0]y = points[i, 1]totalError += (y - (m * x + b)) ** 2return totalError / float(len(points))def step_gradient(b_current, m_current, points, learningRate):b_gradient = 0m_gradient = 0N = float(len(points))for i in range(0, len(points)):x = points[i, 0]y = points[i, 1]b_gradient += -(2/N) * (y - ((m_current * x) + b_current))m_gradient += -(2/N) * x * (y - ((m_current * x) + b_current))new_b = b_current - (learningRate * b_gradient)new_m = m_current - (learningRate * m_gradient)return [new_b, new_m]def gradient_descent_runner(points, starting_b, starting_m, learning_rate, num_iterations):b = starting_bm = starting_margs_data = []for i in range(num_iterations):b, m = step_gradient(b, m, np.array(points), learning_rate)args_data.append((b,m))return args_dataif __name__ == '__main__':points = np.genfromtxt("data.csv", delimiter=",")learning_rate = 0.0001initial_b = 0 # initial y-intercept guessinitial_m = 0 # initial slope guessnum_iterations = 10print ("Starting gradient descent at b = {0}, m = {1}, error = {2}".format(initial_b, initial_m, compute_error_for_line_given_points(initial_b, initial_m, points)))print ("Running...")args_data = gradient_descent_runner(points, initial_b, initial_m, learning_rate, num_iterations)b = args_data[-1][0]m = args_data[-1][1]print ("After {0} iterations b = {1}, m = {2}, error = {3}".format(num_iterations, b, m, compute_error_for_line_given_points(b, m, points)))data = np.array(points).reshape(100,2)x1 = data[:,0]y1 = data[:,1]x2 = np.linspace(20, 80, 100)y2 = initial_m * x2 + initial_bdata2 = np.array(args_data)b_every = data2[:,0]m_every = data2[:,1]# 创建图形和轴fig, ax = plt.subplots()line1, = ax.plot(x1, y1, 'ro')line2, = ax.plot(x2,y2)# 添加标签和标题plt.xlabel('x')plt.ylabel('y')plt.title('Graph of y = mx + b')# 添加网格plt.grid(True)# 定义更新函数def update(frame):line2.set_ydata(m_every[frame] * x2 + b_every[frame])ax.set_title(f'{frame} Graph of y = {m_every[frame]:.2f}x + {b_every[frame]:.2f}')# 创建动画
animation = FuncAnimation(fig, update, frames=len(data2), interval=500)# 显示动画
plt.show()实现的效果如下所示:
C#代码进行可视化
这是本文重点介绍的内容,本文的C#代码通过Scottplot进行可视化。
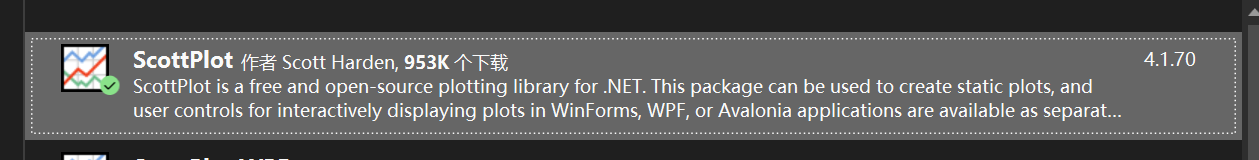
Scottplot简介
ScottPlot 是一个免费的开源绘图库,用于 .NET,可以轻松以交互方式显示大型数据集。
控制台程序可视化
首先我先介绍一下在控制台程序中进行可视化。
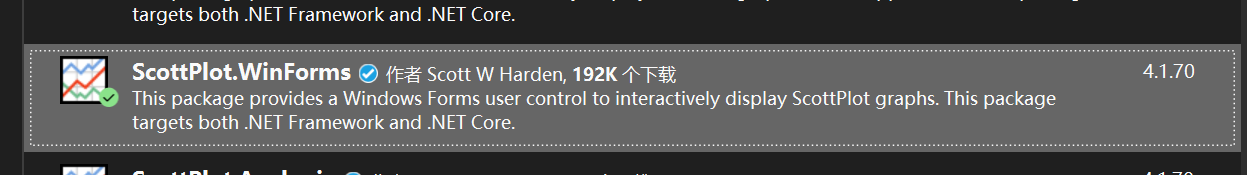
首先添加Scottplot包:
将上篇文章中的C#代码修改如下:
using NumSharp;namespace LinearRegressionDemo
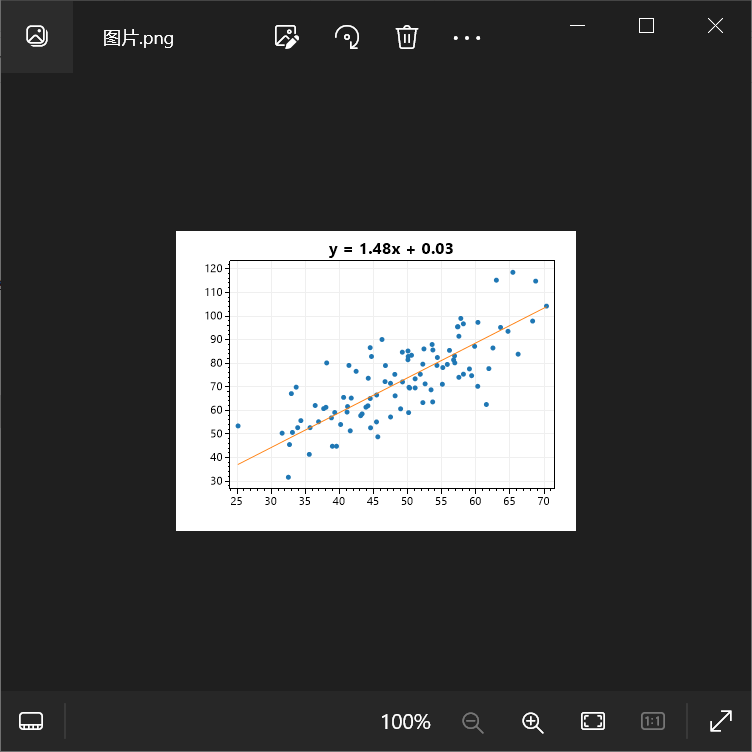
{internal class Program{ static void Main(string[] args){ //创建double类型的列表List<double> Array = new List<double>();List<double> ArgsList = new List<double>();// 指定CSV文件的路径string filePath = "你的data.csv路径";// 调用ReadCsv方法读取CSV文件数据Array = ReadCsv(filePath);var array = np.array(Array).reshape(100,2);double learning_rate = 0.0001;double initial_b = 0;double initial_m = 0;double num_iterations = 10;Console.WriteLine($"Starting gradient descent at b = {initial_b}, m = {initial_m}, error = {compute_error_for_line_given_points(initial_b, initial_m, array)}");Console.WriteLine("Running...");ArgsList = gradient_descent_runner(array, initial_b, initial_m, learning_rate, num_iterations);double b = ArgsList[ArgsList.Count - 2];double m = ArgsList[ArgsList.Count - 1];Console.WriteLine($"After {num_iterations} iterations b = {b}, m = {m}, error = {compute_error_for_line_given_points(b, m, array)}");Console.ReadLine();var x1 = array[$":", 0];var y1 = array[$":", 1];var y2 = m * x1 + b;ScottPlot.Plot myPlot = new(400, 300);myPlot.AddScatterPoints(x1.ToArray<double>(), y1.ToArray<double>(), markerSize: 5);myPlot.AddScatter(x1.ToArray<double>(), y2.ToArray<double>(), markerSize: 0);myPlot.Title($"y = {m:0.00}x + {b:0.00}");myPlot.SaveFig("图片.png");}static List<double> ReadCsv(string filePath){List<double> array = new List<double>();try{// 使用File.ReadAllLines读取CSV文件的所有行string[] lines = File.ReadAllLines(filePath); // 遍历每一行数据foreach (string line in lines){// 使用逗号分隔符拆分每一行的数据string[] values = line.Split(',');// 打印每一行的数据foreach (string value in values){array.Add(Convert.ToDouble(value));} }}catch (Exception ex){Console.WriteLine("发生错误: " + ex.Message);}return array;}public static double compute_error_for_line_given_points(double b,double m,NDArray array){double totalError = 0;for(int i = 0;i < array.shape[0];i++){double x = array[i, 0];double y = array[i, 1];totalError += Math.Pow((y - (m*x+b)),2);}return totalError / array.shape[0];}public static double[] step_gradient(double b_current,double m_current,NDArray array,double learningRate){double[] args = new double[2];double b_gradient = 0;double m_gradient = 0;double N = array.shape[0];for (int i = 0; i < array.shape[0]; i++){double x = array[i, 0];double y = array[i, 1];b_gradient += -(2 / N) * (y - ((m_current * x) + b_current));m_gradient += -(2 / N) * x * (y - ((m_current * x) + b_current));}double new_b = b_current - (learningRate * b_gradient);double new_m = m_current - (learningRate * m_gradient);args[0] = new_b;args[1] = new_m;return args;}public static List<double> gradient_descent_runner(NDArray array, double starting_b, double starting_m, double learningRate,double num_iterations){double[] args = new double[2];List<double> argsList = new List<double>();args[0] = starting_b;args[1] = starting_m;for(int i = 0 ; i < num_iterations; i++) {args = step_gradient(args[0], args[1], array, learningRate);argsList.AddRange(args);}return argsList;}}
}然后得到的图片如下所示:
在以上代码中需要注意的地方:
var x1 = array[$":", 0];var y1 = array[$":", 1];
是在使用NumSharp中的切片,x1表示所有行的第一列,y1表示所有行的第二列。
当然我们不满足于只是保存图片,在控制台应用程序中,再添加一个 ScottPlot.WinForms包:
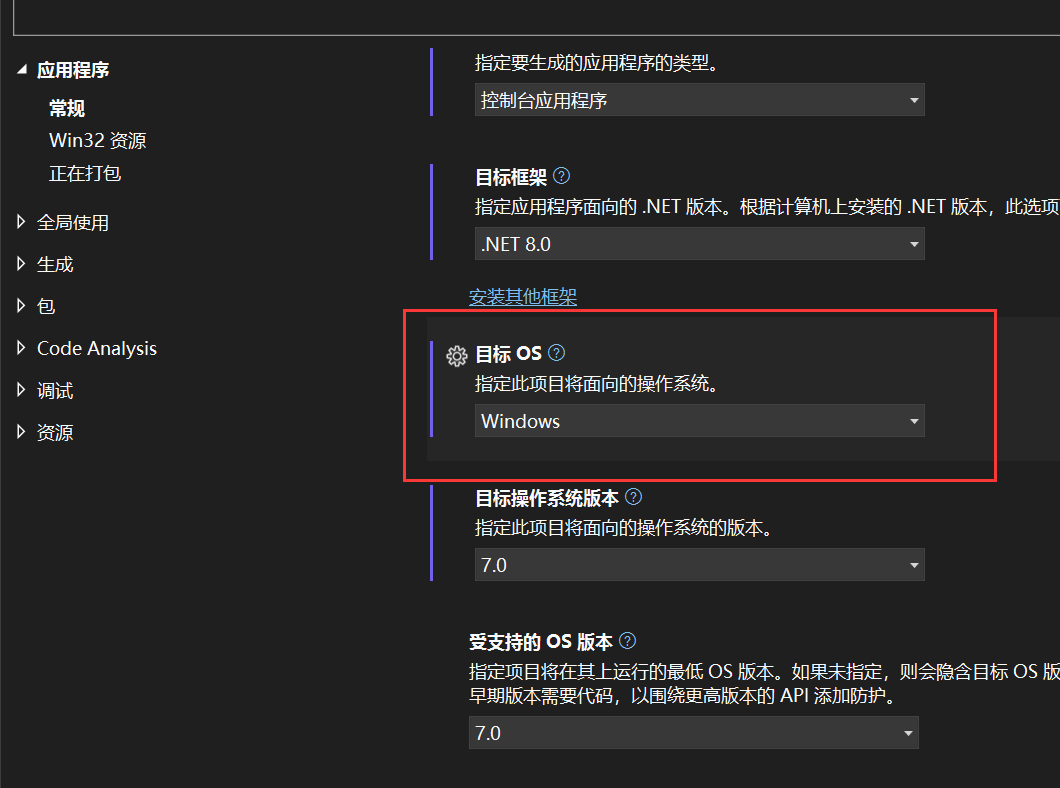
右键控制台项目选择属性,将目标OS改为Windows:
将上述代码中的
myPlot.SaveFig("图片.png");
修改为:
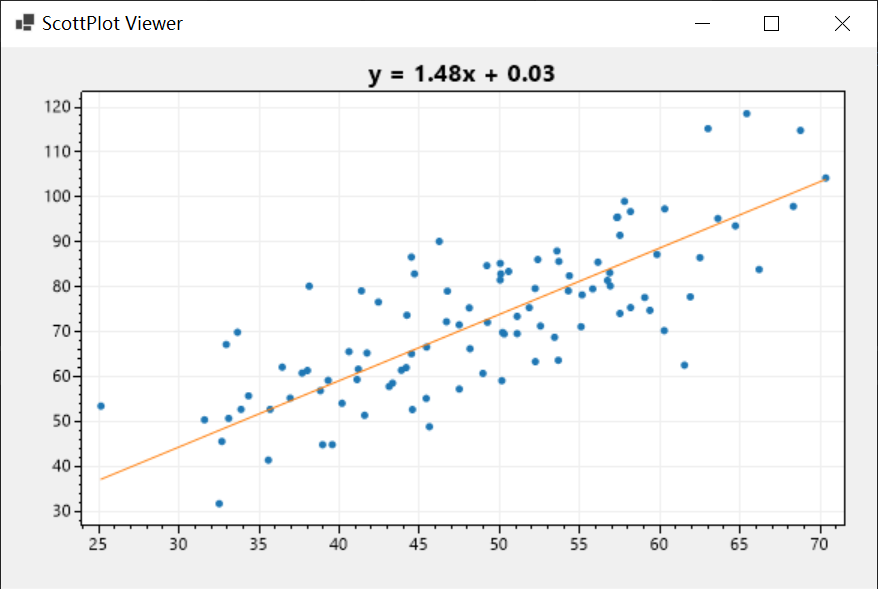
var viewer = new ScottPlot.FormsPlotViewer(myPlot);viewer.ShowDialog();
再次运行结果如下:
winform进行可视化
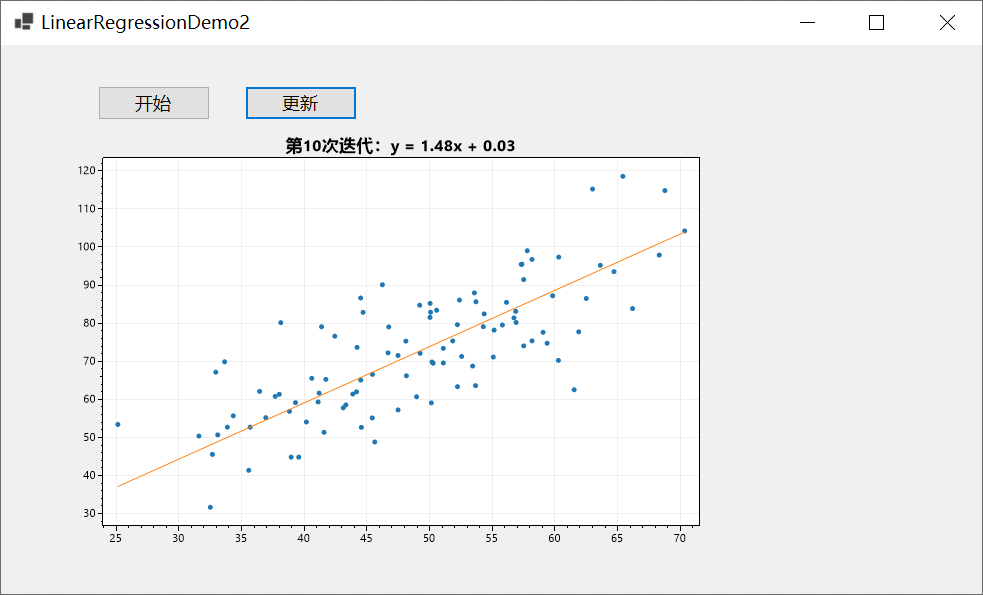
我也想像Python代码中那样画动图,因此做了个winform程序进行演示。
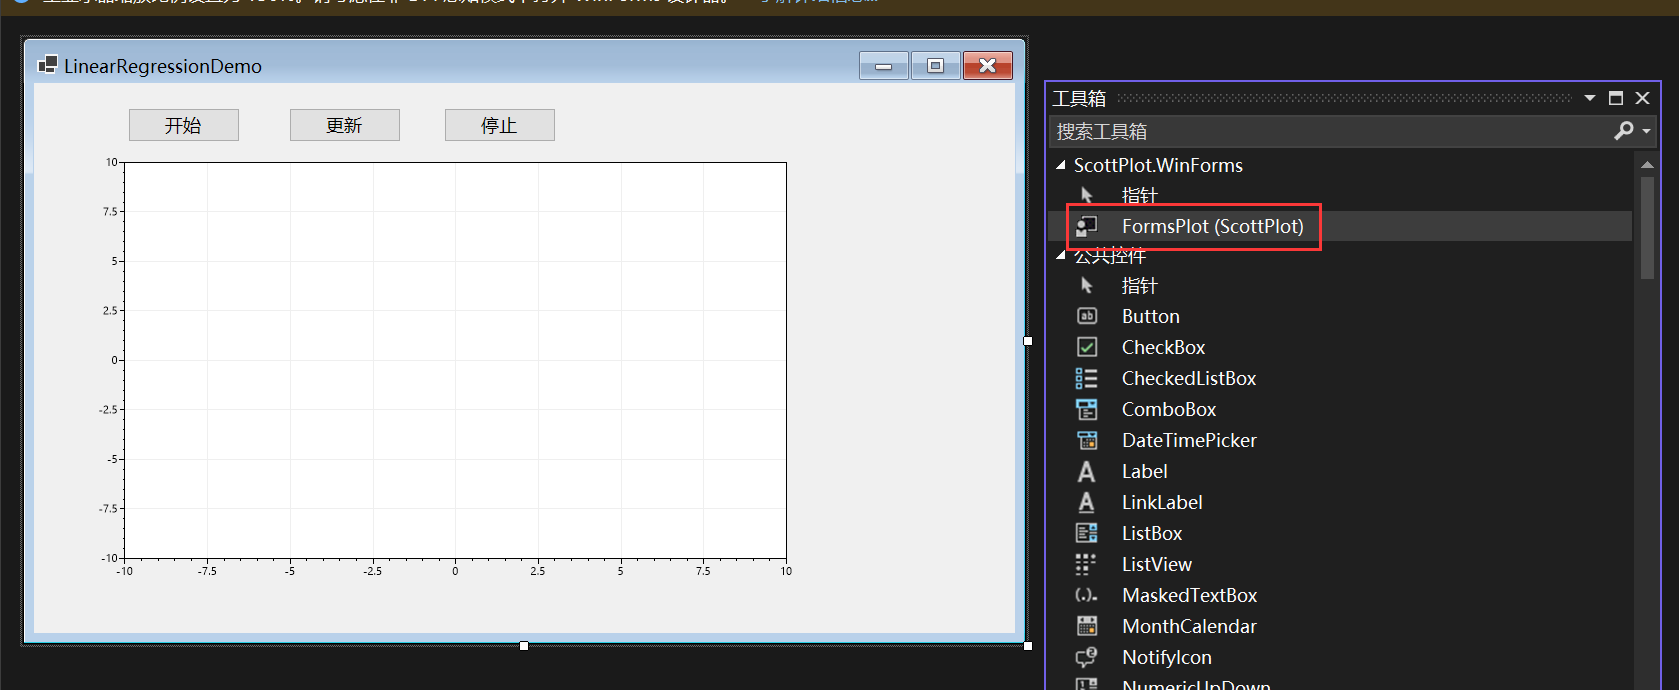
首先创建一个winform,添加ScottPlot.WinForms包,然后从工具箱中添加FormsPlot这个控件:
有两种方法实现,第一种方法用了定时器:
using NumSharp;
namespace WinFormDemo
{public partial class Form1 : Form{System.Windows.Forms.Timer updateTimer = new System.Windows.Forms.Timer();int num_iterations;int count = 0;NDArray? x1, y1, b_each, m_each;public Form1(){InitializeComponent();}private void button1_Click(object sender, EventArgs e){StartLinearRegression();}public void StartLinearRegression(){//创建double类型的列表List<double> Array = new List<double>();List<double> ArgsList = new List<double>();// 指定CSV文件的路径string filePath = "你的data.csv路径";// 调用ReadCsv方法读取CSV文件数据Array = ReadCsv(filePath);var array = np.array(Array).reshape(100, 2);double learning_rate = 0.0001;double initial_b = 0;double initial_m = 0;num_iterations = 10;ArgsList = gradient_descent_runner(array, initial_b, initial_m, learning_rate, num_iterations);x1 = array[$":", 0];y1 = array[$":", 1];var argsArr = np.array(ArgsList).reshape(num_iterations, 2);b_each = argsArr[$":", 0];m_each = argsArr[$":", 1];double b = b_each[-1];double m = m_each[-1];var y2 = m * x1 + b;formsPlot1.Plot.AddScatterPoints(x1.ToArray<double>(), y1.ToArray<double>(), markerSize: 5);//formsPlot1.Plot.AddScatter(x1.ToArray<double>(), y2.ToArray<double>(), markerSize: 0);formsPlot1.Render();}static List<double> ReadCsv(string filePath){List<double> array = new List<double>();try{// 使用File.ReadAllLines读取CSV文件的所有行string[] lines = File.ReadAllLines(filePath);// 遍历每一行数据foreach (string line in lines){// 使用逗号分隔符拆分每一行的数据string[] values = line.Split(',');// 打印每一行的数据foreach (string value in values){array.Add(Convert.ToDouble(value));}}}catch (Exception ex){Console.WriteLine("发生错误: " + ex.Message);}return array;}public static double compute_error_for_line_given_points(double b, double m, NDArray array){double totalError = 0;for (int i = 0; i < array.shape[0]; i++){double x = array[i, 0];double y = array[i, 1];totalError += Math.Pow((y - (m * x + b)), 2);}return totalError / array.shape[0];}public static double[] step_gradient(double b_current, double m_current, NDArray array, double learningRate){double[] args = new double[2];double b_gradient = 0;double m_gradient = 0;double N = array.shape[0];for (int i = 0; i < array.shape[0]; i++){double x = array[i, 0];double y = array[i, 1];b_gradient += -(2 / N) * (y - ((m_current * x) + b_current));m_gradient += -(2 / N) * x * (y - ((m_current * x) + b_current));}double new_b = b_current - (learningRate * b_gradient);double new_m = m_current - (learningRate * m_gradient);args[0] = new_b;args[1] = new_m;return args;}public static List<double> gradient_descent_runner(NDArray array, double starting_b, double starting_m, double learningRate, double num_iterations){double[] args = new double[2];List<double> argsList = new List<double>();args[0] = starting_b;args[1] = starting_m;for (int i = 0; i < num_iterations; i++){args = step_gradient(args[0], args[1], array, learningRate);argsList.AddRange(args);}return argsList;}private void button2_Click(object sender, EventArgs e){// 初始化定时器updateTimer.Interval = 1000; // 设置定时器触发间隔(毫秒)updateTimer.Tick += UpdateTimer_Tick;updateTimer.Start();}private void UpdateTimer_Tick(object? sender, EventArgs e){if (count >= num_iterations){updateTimer.Stop();}else{UpdatePlot(count);}count++;}public void UpdatePlot(int count){double b = b_each?[count];double m = m_each?[count];var y2 = m * x1 + b;formsPlot1.Plot.Clear();formsPlot1.Plot.AddScatterPoints(x1?.ToArray<double>(), y1?.ToArray<double>(), markerSize: 5);formsPlot1.Plot.AddScatter(x1?.ToArray<double>(), y2.ToArray<double>(), markerSize: 0);formsPlot1.Plot.Title($"第{count + 1}次迭代:y = {m:0.00}x + {b:0.00}");formsPlot1.Render();}private void button3_Click(object sender, EventArgs e){updateTimer.Stop();}private void Form1_Load(object sender, EventArgs e){}}
}简单介绍一下思路,首先创建List<double> argsList用来保存每次迭代生成的参数b、m,然后用
var argsArr = np.array(ArgsList).reshape(num_iterations, 2);
将argsList通过np.array()方法转化为NDArray,然后再调用reshape方法,转化成行数等于迭代次数,列数为2,即每一行对应一组参数值b、m。
b_each = argsArr[$":", 0];m_each = argsArr[$":", 1];
argsArr[$":", 0]表示每一行中第一列的值,也就是每一个b,argsArr[$":", 1]表示每一行中第二列的值。
double b = b_each[-1];double m = m_each[-1];
b_each[-1]用了NumSharp的功能表示b_each最后一个元素。
实现效果如下所示:

另一种方法可以通过异步实现:
using NumSharp;namespace WinFormDemo
{public partial class Form2 : Form{      int num_iterations;NDArray? x1, y1, b_each, m_each;public Form2(){InitializeComponent();}private void button1_Click(object sender, EventArgs e){StartLinearRegression();}public void StartLinearRegression(){//创建double类型的列表List<double> Array = new List<double>();List<double> ArgsList = new List<double>();// 指定CSV文件的路径string filePath = "你的data.csv路径";// 调用ReadCsv方法读取CSV文件数据Array = ReadCsv(filePath);var array = np.array(Array).reshape(100, 2);double learning_rate = 0.0001;double initial_b = 0;double initial_m = 0;num_iterations = 10;ArgsList = gradient_descent_runner(array, initial_b, initial_m, learning_rate, num_iterations);x1 = array[$":", 0];y1 = array[$":", 1];var argsArr = np.array(ArgsList).reshape(num_iterations, 2);b_each = argsArr[$":", 0];m_each = argsArr[$":", 1];double b = b_each[-1];double m = m_each[-1];var y2 = m * x1 + b;formsPlot1.Plot.AddScatterPoints(x1.ToArray<double>(), y1.ToArray<double>(), markerSize: 5);      formsPlot1.Render();}static List<double> ReadCsv(string filePath){List<double> array = new List<double>();try{// 使用File.ReadAllLines读取CSV文件的所有行string[] lines = File.ReadAllLines(filePath);// 遍历每一行数据foreach (string line in lines){// 使用逗号分隔符拆分每一行的数据string[] values = line.Split(',');// 打印每一行的数据foreach (string value in values){array.Add(Convert.ToDouble(value));}}}catch (Exception ex){Console.WriteLine("发生错误: " + ex.Message);}return array;}public static double compute_error_for_line_given_points(double b, double m, NDArray array){double totalError = 0;for (int i = 0; i < array.shape[0]; i++){double x = array[i, 0];double y = array[i, 1];totalError += Math.Pow((y - (m * x + b)), 2);}return totalError / array.shape[0];}public static double[] step_gradient(double b_current, double m_current, NDArray array, double learningRate){double[] args = new double[2];double b_gradient = 0;double m_gradient = 0;double N = array.shape[0];for (int i = 0; i < array.shape[0]; i++){double x = array[i, 0];double y = array[i, 1];b_gradient += -(2 / N) * (y - ((m_current * x) + b_current));m_gradient += -(2 / N) * x * (y - ((m_current * x) + b_current));}double new_b = b_current - (learningRate * b_gradient);double new_m = m_current - (learningRate * m_gradient);args[0] = new_b;args[1] = new_m;return args;}public static List<double> gradient_descent_runner(NDArray array, double starting_b, double starting_m, double learningRate, double num_iterations){double[] args = new double[2];List<double> argsList = new List<double>();args[0] = starting_b;args[1] = starting_m;for (int i = 0; i < num_iterations; i++){args = step_gradient(args[0], args[1], array, learningRate);argsList.AddRange(args);}return argsList;}private void Form2_Load(object sender, EventArgs e){}public async Task UpdateGraph(){for (int i = 0; i < num_iterations; i++){double b = b_each?[i];double m = m_each?[i];var y2 = m * x1 + b;formsPlot1.Plot.Clear();formsPlot1.Plot.AddScatterPoints(x1?.ToArray<double>(), y1?.ToArray<double>(), markerSize: 5);formsPlot1.Plot.AddScatter(x1?.ToArray<double>(), y2.ToArray<double>(), markerSize: 0);formsPlot1.Plot.Title($"第{i + 1}次迭代:y = {m:0.00}x + {b:0.00}");formsPlot1.Render();await Task.Delay(1000);}}private async void button2_Click(object sender, EventArgs e){await UpdateGraph();}}
}
点击更新按钮开始执行异步任务:
private async void button2_Click(object sender, EventArgs e){await UpdateGraph();}
public async Task UpdateGraph(){for (int i = 0; i < num_iterations; i++){double b = b_each?[i];double m = m_each?[i];var y2 = m * x1 + b;formsPlot1.Plot.Clear();formsPlot1.Plot.AddScatterPoints(x1?.ToArray<double>(), y1?.ToArray<double>(), markerSize: 5);formsPlot1.Plot.AddScatter(x1?.ToArray<double>(), y2.ToArray<double>(), markerSize: 0);formsPlot1.Plot.Title($"第{i + 1}次迭代:y = {m:0.00}x + {b:0.00}");formsPlot1.Render();await Task.Delay(1000);}
实现效果如下:
总结
本文以一个控制台应用与一个winform程序为例向大家介绍了C#如何基于ScottPlot进行数据可视化,并介绍了实现动态绘图的两种方式,一种是使用定时器,另一种是使用异步操作,希望对你有所帮助。
相关文章:
C#基于ScottPlot进行可视化
前言 上一篇文章跟大家分享了用NumSharp实现简单的线性回归,但是没有进行可视化,可能对拟合的过程没有直观的感受,因此今天跟大家介绍一下使用C#基于Scottplot进行可视化,当然Python的代码,我也会同步进行可视化。 P…...
基于JAVA+ssm开发的在线报名系统设计与实现【附源码】
基于JAVAssm开发的在线报名系统设计与实现【附源码】 🍅 作者主页 央顺技术团队 🍅 欢迎点赞 👍 收藏 ⭐留言 📝 🍅 文末获取源码联系方式 📝 🍅 查看下方微信号获取联系方式 承接各种定制系统 …...
)
蓝桥——第 3 场 小白入门赛(A-D)
文章目录 一、题目A.召唤神坤基本思路:代码 B.聪明的交换策略基本思路:代码 C.怪兽突击基本思路:代码 D.蓝桥快打基本思路代码 一、题目 A.召唤神坤 基本思路: 贪心, 使结果最大,希望两边w[i],w[k]是较大…...
Java项目:06 Springboot的进销存管理系统
作者主页:舒克日记 简介:Java领域优质创作者、Java项目、学习资料、技术互助 文中获取源码 进销存管理系统 介绍 进销存系统是为了对企业生产经营中进货、出货、批发销售、付款等全程进行(从接获订单合同开 始,进入物料采购、入…...
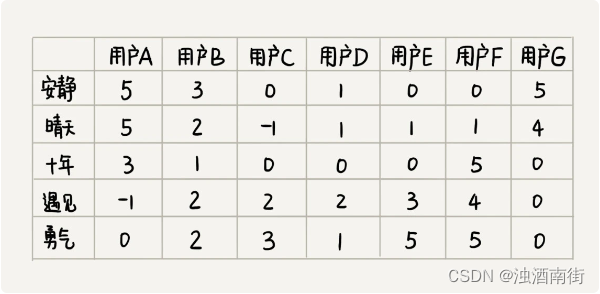
数据结构与算法之美学习笔记:47 | 向量空间:如何实现一个简单的音乐推荐系统?
这里写自定义目录标题 前言算法解析总结引申 前言 本节课程思维导图: 很多人都喜爱听歌,以前我们用 MP3 听歌,现在直接通过音乐 App 在线就能听歌。而且,各种音乐 App 的功能越来越强大,不仅可以自己选歌听࿰…...

5《Linux》
文章目录 查看端口号查看进程号查看IP查看与某台机器连接情况 Linux查看日志的命令?head [-n 行数参数】tail [-n 行数参数】cat [-n 行号展示】tac [-n 行号展示】 Linux操作文本-三剑客grep-擅长过滤正则过滤sed-擅长取行awk-擅长取列 Linux性能监控的命令&#x…...

go-carbon v2.3.5 发布,轻量级、语义化、对开发者友好的 golang 时间处理库
carbon 是一个轻量级、语义化、对开发者友好的 golang 时间处理库,支持链式调用。 目前已被 awesome-go 收录,如果您觉得不错,请给个 star 吧 github.com/golang-module/carbon gitee.com/golang-module/carbon 安装使用 Golang 版本大于…...
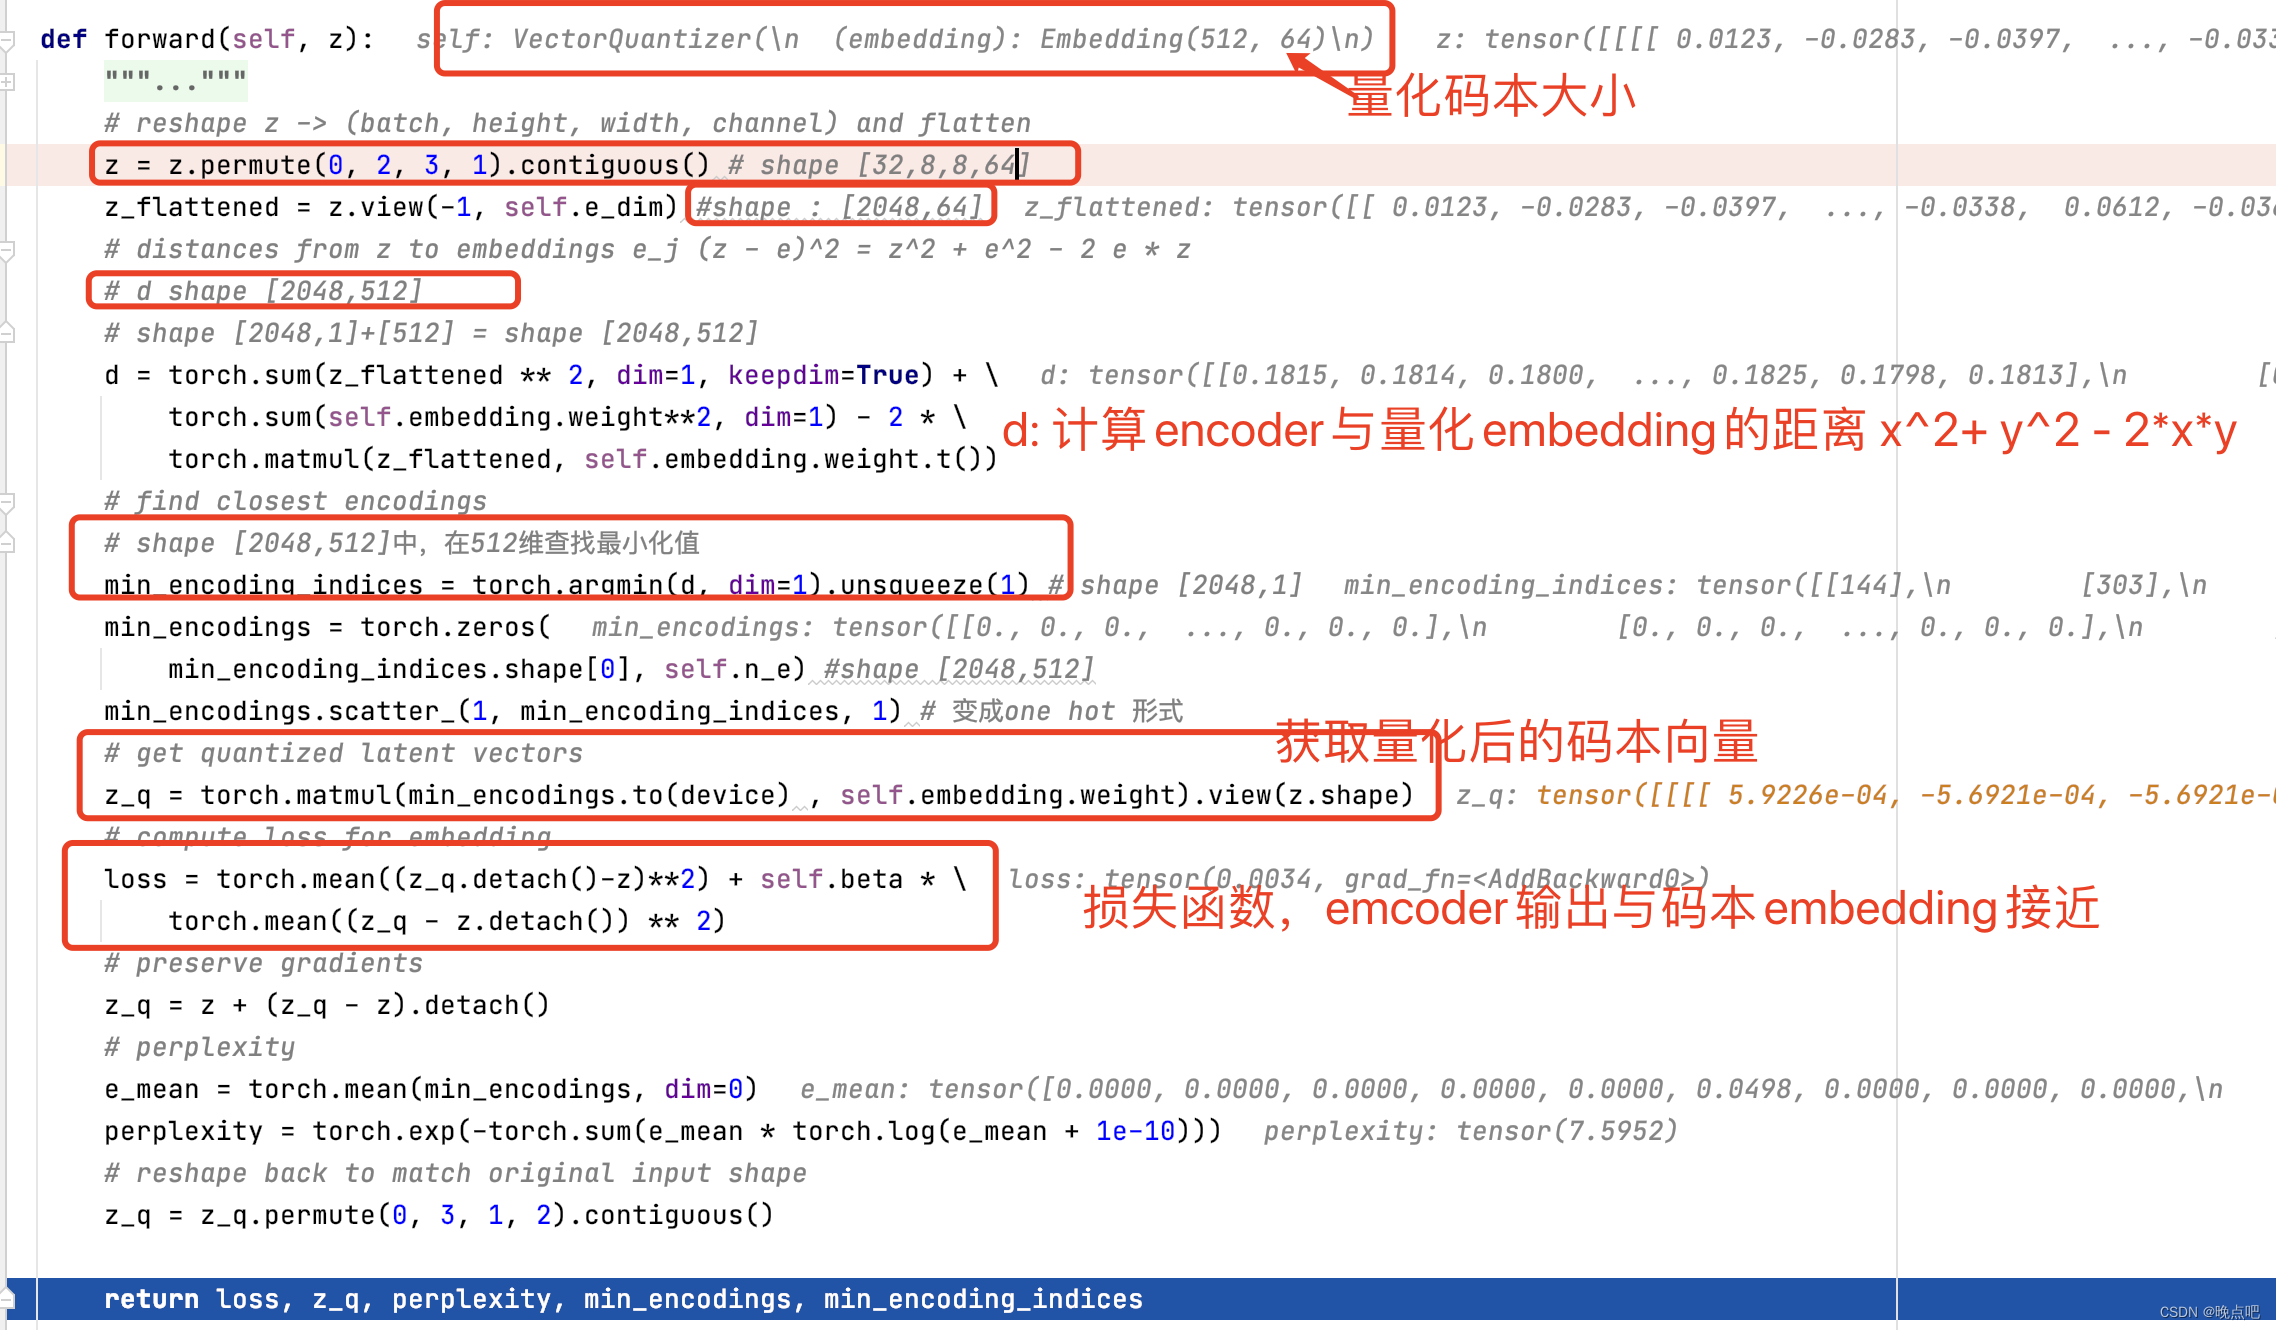
VQ-VAE(Neural Discrete Representation Learning)论文解读及实现
pytorch 实现git地址 论文地址:Neural Discrete Representation Learning 1 论文核心知识点 encoder 将图片通过encoder得到图片点表征 如输入shape [32,3,32,32] 通过encoder后输出 [32,64,8,8] (其中64位输出维度) 量化码本 先随机构建一个码本,维度…...

OpenAI的ChatGPT:引领人工智能交流的未来
如果您在使用ChatGPT工具的过程中感到迷茫,别担心,我在这里提供帮助。无论您是初次接触ChatGPT plus,还是在注册、操作过程中遇到难题,我都将为您提供一对一的指导和支持。(qq:1371410959) 一、ChatGPT简介 OpenAI的ChatGPT是一…...
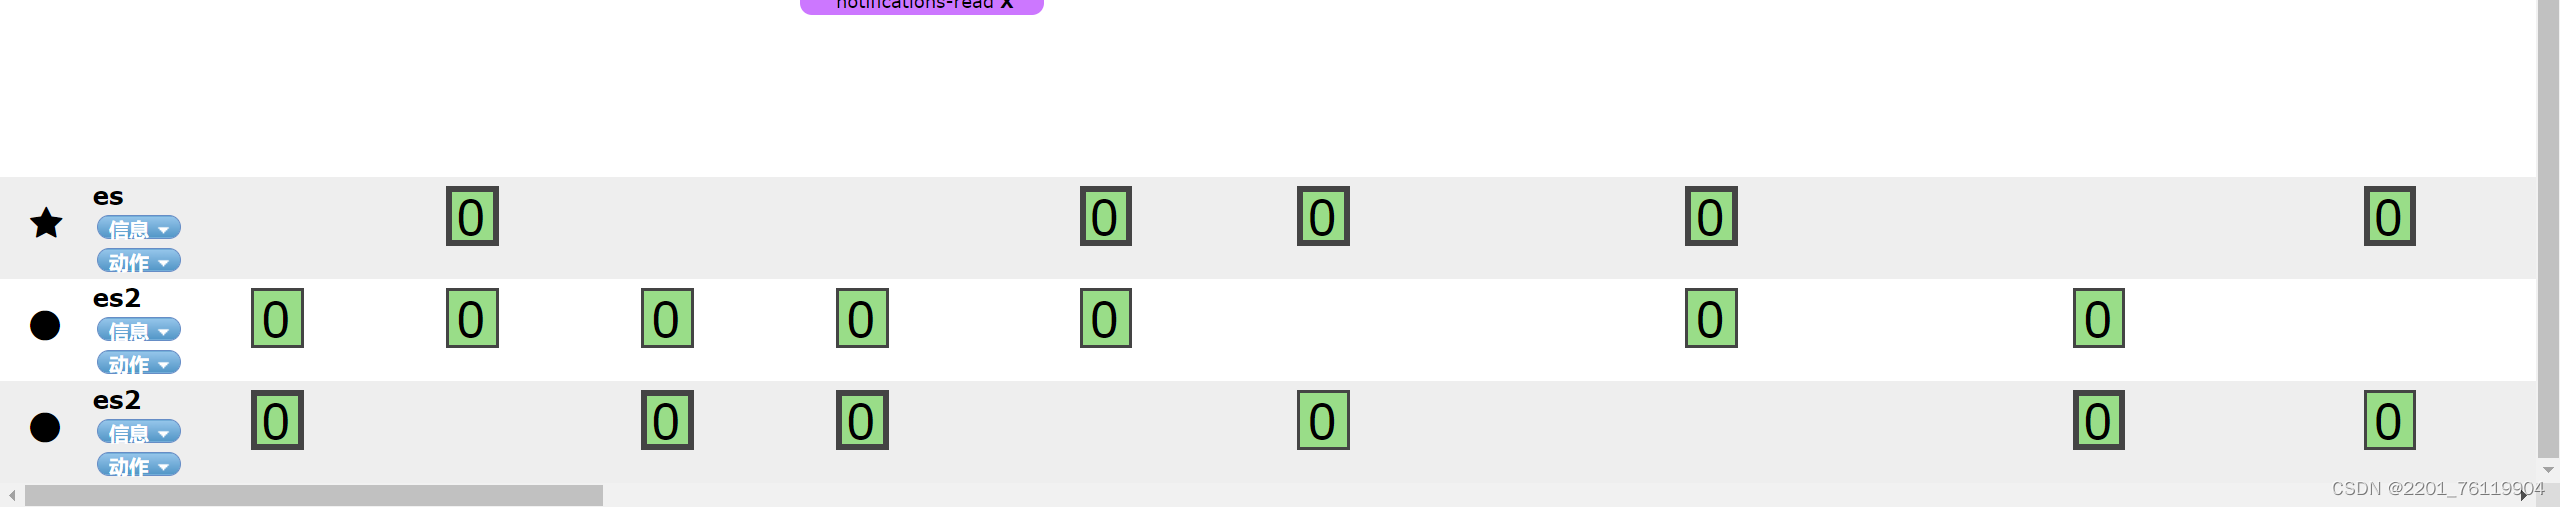
es集群安装及优化
es主节点 192.168.23.100 es节点 192.168.23.101 192.168.23.102 1.安装主节点 1.去官网下载es的yum包 官网下载地址 https://www.elastic.co/cn/downloads/elasticsearch 根据自己的需要下载对应的包 2.下载好之后把所有的包都传到从节点上,安装 [rootlocalho…...

【开源】基于JAVA+Vue+SpringBoot的医院门诊预约挂号系统
目录 一、摘要1.1 项目介绍1.2 项目录屏 二、功能模块2.1 功能性需求2.1.1 数据中心模块2.1.2 科室医生档案模块2.1.3 预约挂号模块2.1.4 医院时政模块 2.2 可行性分析2.2.1 可靠性2.2.2 易用性2.2.3 维护性 三、数据库设计3.1 用户表3.2 科室档案表3.3 医生档案表3.4 医生放号…...
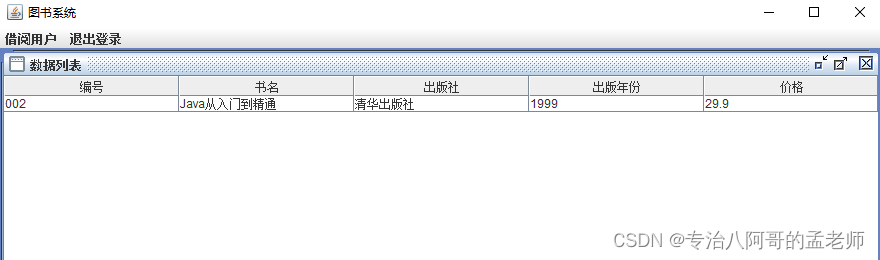
Java Swing 图书借阅系统 窗体项目 期末课程设计 窗体设计
视频教程: 【课程设计】图书借阅系统 功能描述: 图书管理系统有三个角色,系统管理员、图书管理员、借阅者; 系统管理员可以添加借阅用户; 图书管理员可以添加图书,操作图书借阅和归还; 借…...

2024.01.09.Apple_UI_BUG
我是软件行业的,虽然不是手机设计的,但是这个设计真的导致经常看信息不完整,要下拉的。 特别读取文本或者其他文件的时候,上面有个抬头就是看不到,烦,体验感很差...

K8S Nginx Ingress Controller client_max_body_size 上传文件大小限制
现象 k8s集群中,上传图片时,大于1M就会报错 413 Request Entity Too Large Nginx Ingress Controller 的版本是 0.29.0 解决方案 1. 修改configmap kubectl edit configmap nginx-configuration -n ingress-nginx在 ConfigMap 的 data 字段中设置参数…...
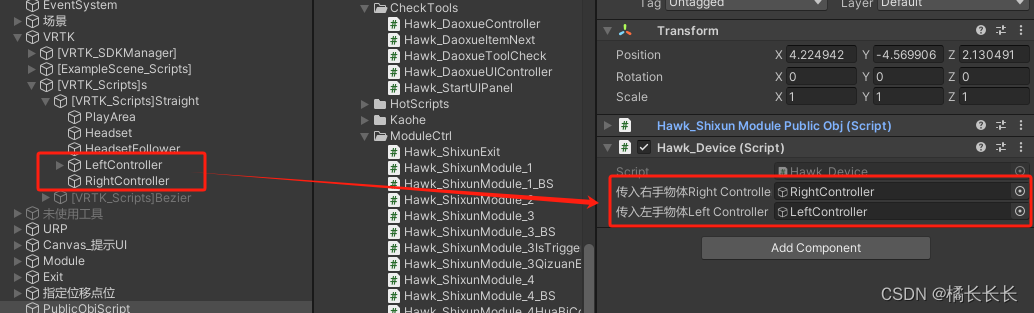
Untiy HTC Vive VRTK 开发记录
目录 一.概述 二.功能实现 1.模型抓取 1)基础抓取脚本 2)抓取物体在手柄上的角度 2.模型放置区域高亮并吸附 1)VRTK_SnapDropZone 2)VRTK_PolicyList 3)VRTK_SnapDropZone_UnityEvents 3.交互滑动条 4.交互旋…...

机器学习指南:如何学习机器学习?
机器学习 一、介绍 你有没有想过计算机是如何从数据中学习和变得更聪明的?这就是机器学习 (ML) 的魔力!这就像计算机科学和统计学的酷炫组合,计算机从大量信息中学习以解决问题并做出预测,就像人类一样。 …...

使用numpy处理图片——分离通道
大纲 读入图片分离通道堆叠法复制修改法 生成图片 在《使用numpy处理图片——滤镜》中,我们剥离了RGB中的一个颜色,达到一种滤镜的效果。 如果我们只保留一种元素,就可以做到PS中分离通道的效果。 读入图片 import numpy as np import PIL.…...

metartc5_jz源码阅读-yang_rtcpush_on_rtcp_ps_feedback
// (Payload-specific FB messages,有效载荷反馈信息),这个函数处理Payload重传 int32_t yang_rtcpush_on_rtcp_ps_feedback(YangRtcContext *context,YangRtcPushStream *pub, YangRtcpCommon *rtcp) {if (context NULL || pub NULL)return ERROR_RTC…...
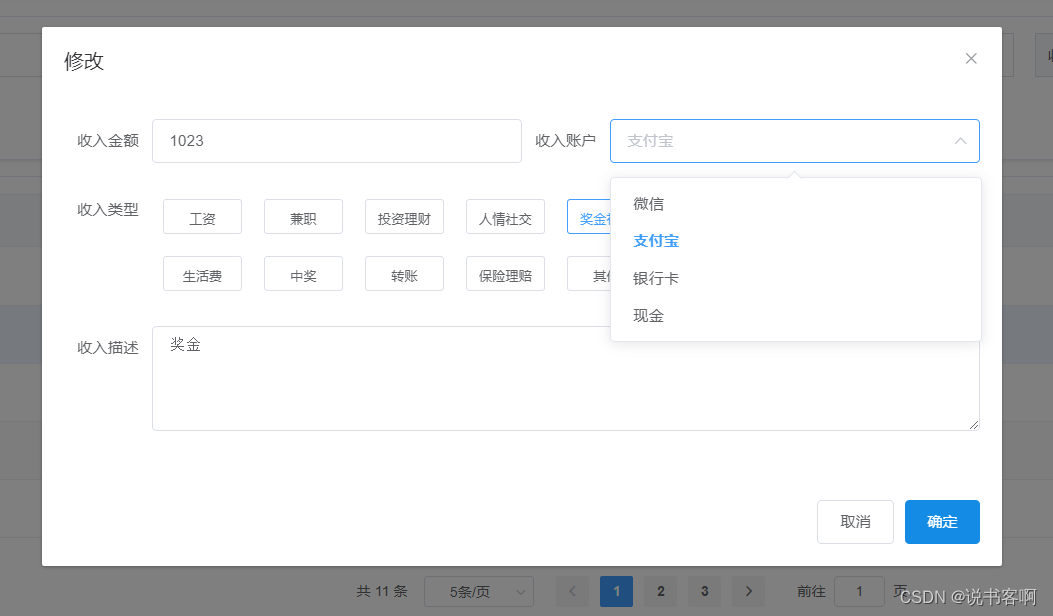
计算机毕业设计 | SpringBoot+vue的家庭理财 财务管理系统(附源码)
1,绪论 1.1 项目背景 网络的发展已经过去了七十多年,网络技术的发展,将会影响到人类的方方面面,网络的出现让各行各业都得到了极大的发展,为整个社会带来了巨大的生机。 现在许多的产业都与因特网息息相关ÿ…...
)
前端面试题集合三(js)
目录 1. 介绍 js 的基本数据类型。2. JavaScript 有几种类型的值?你能画一下他们的内存图吗?3. 什么是堆?什么是栈?它们之间有什么区别和联系?4. 内部属性 [[Class]] 是什么?5. 介绍 js 有哪些内置对象&am…...

AI大模型岗位薪资揭秘:2026大模型岗位薪资,非常详细收藏我这一篇就够了
1. AI系统架构师 薪资范围:100万 - 200万/年 职位要求:需要具备全面的技术背景,精通系统架构设计,能够有效整合AI技术,提升系统性能。要求硕士及以上学历,计算机科学或相关专业背景。 目标院校࿱…...

QGIS 3.28 保姆级配置指南:从中文界面到高德底图,手把手搞定智驾地图工作流
QGIS 3.28 智能驾驶地图工程师开箱指南:从零构建高精度工作流 刚拿到工牌的智能驾驶地图工程师小李,面对全新的QGIS界面有些手足无措。作为空间数据处理的核心工具,QGIS的配置直接决定了后续高精地图生产的效率与精度。本文将带你完成从软件…...

探索:空间网格编码SpatialGridCoding在北斗导航与地理实体管理中的应用
1. 空间网格编码:北斗导航的"数字身份证" 想象一下,当你打开手机导航时,系统如何快速锁定你的位置并规划路线?这背后离不开空间网格编码技术的支持。简单来说,空间网格编码就像给地球表面贴满二维码…...

从SWF中提取加密通信协议:JPEXS Free Flash Decompiler安全分析报告
从SWF中提取加密通信协议:JPEXS Free Flash Decompiler安全分析报告 【免费下载链接】jpexs-decompiler JPEXS Free Flash Decompiler 项目地址: https://gitcode.com/gh_mirrors/jp/jpexs-decompiler 在网络安全分析领域,SWF(Shockwa…...

老码农和你一起学AI系列:ELECTRA
ELECTRA(Efficiently Learning an Encoder that Classifies Token Replacements Accurately)是Google Research在2020年提出的一种自监督预训练方法。它不像BERT那样做“完形填空”,而是让模型扮演一个“作弊检测员”,通过判别输入…...

FPGA信号调试必备:Quartus中keep、preserve、noprune的正确用法与避坑指南
FPGA信号调试必备:Quartus中keep、preserve、noprune的正确用法与避坑指南 在FPGA开发过程中,信号调试是最令人头疼的环节之一。特别是当你发现仿真时明明存在的关键信号,在综合后却神秘消失时,那种挫败感简直难以言表。作为一名长…...

从51job爬虫案例出发,聊聊如何用Selenium优雅地绕过前端反爬机制
从51job爬虫案例解析Selenium反反爬高阶策略 当招聘网站的前端技术不断升级,传统爬虫手段逐渐失效时,如何让自动化工具的行为更像真实用户?这个问题困扰着许多中高级开发者。以51job为例,其动态加载、URL不变的设计让常规爬虫束手…...

BGE嵌入模型突破指南:解锁多模态检索增强的实战路径
BGE嵌入模型突破指南:解锁多模态检索增强的实战路径 【免费下载链接】FlagEmbedding Dense Retrieval and Retrieval-augmented LLMs 项目地址: https://gitcode.com/GitHub_Trending/fl/FlagEmbedding 在信息爆炸的时代,如何让机器精准理解人类语…...

GitHub中文界面终极指南:5分钟让你的GitHub说中文
GitHub中文界面终极指南:5分钟让你的GitHub说中文 【免费下载链接】github-chinese GitHub 汉化插件,GitHub 中文化界面。 (GitHub Translation To Chinese) 项目地址: https://gitcode.com/gh_mirrors/gi/github-chinese 想象一下,你…...

nli-distilroberta-base模型服务监控:使用普罗米修斯与Grafana打造可视化看板
nli-distilroberta-base模型服务监控:使用普罗米修斯与Grafana打造可视化看板 1. 为什么需要模型服务监控 在生产环境中部署的AI模型服务,就像一台24小时运转的机器,需要随时掌握它的运行状态。想象一下,如果你不知道这台机器每…...