MATLAB之数据分析图系列 三
三维堆叠柱状图

Bar3StackPlot.m文件
clc;
clear;
close all;
%三维堆叠柱状图
%% 数据准备
% 读取数据
load data.mat
% 初始化
dataset = X;
s = 0.4; % 柱子宽度
n = size(dataset,3); % 堆叠组数%% 图片尺寸设置(单位:厘米)
figureUnits = 'centimeters';
figureWidth = 18;
figureHeight = 16;%% 窗口设置
figureHandle = figure;
set(gcf, 'Units', figureUnits, 'Position', [0 0 figureWidth figureHeight]);%% 三维堆叠柱状图绘制
% 赋色
map = colormap(nclCM(313)); %color包里选颜色
h = bar3stack(dataset,s,map);
hTitle = title('Bar3Stack Plot');
hXLabel = xlabel('Variable1');
hYLabel = ylabel('Variable2');
hZLabel = zlabel('Variable3');
view(134,25)%% 细节优化
% 坐标区调整
set(gca, 'Box', 'on', ...                                                           % 边框'LineWidth', 1, 'GridLineStyle', '-',...                                   % 坐标轴线宽'XGrid', 'on', 'YGrid', 'on','ZGrid', 'on', ...                            % 网格'TickDir', 'out', 'TickLength', [.015 .015], ...                           % 刻度'XMinorTick', 'off', 'YMinorTick', 'off',  'ZMinorTick', 'off',...         % 小刻度'XColor', [.1 .1 .1],  'YColor', [.1 .1 .1], 'ZColor', [.1 .1 .1],...      % 坐标轴颜色'xtick',1:10,...                                                           % 坐标轴刻度'xticklabels',1:10,...'ytick',1:10,...'ylim',[0.5 10.5],...'yticklabels',1:10,...'ztick',0:10:60,...'zticklabels',0:10:60,...'zlim',[0 60])
% Legend设置
hLegend = legend(h,...'Samp1','Samp2','Samp3','Samp4','Samp5', ...'Location', 'northwest',...'Orientation','vertical');% Legend位置微调
P = hLegend.Position;
hLegend.Position = P + [0.05 -0.2 0 0];
% 字体和字号
set(gca, 'FontName', 'Arail', 'FontSize', 10)
set([hLegend,hXLabel, hYLabel,hZLabel], 'FontName', 'Arail', 'FontSize', 10)
set(hTitle, 'FontSize', 12, 'FontWeight' , 'bold')
% 背景颜色
set(gcf,'Color',[1 1 1])%% 图片输出
figW = figureWidth;
figH = figureHeight;
set(figureHandle,'PaperUnits',figureUnits);
set(figureHandle,'PaperPosition',[0 0 figW figH]);
fileout = 'test';
print(figureHandle,[fileout,'.png'],'-r300','-dpng');
bar3stack.m
function h = bar3stack(z,s,c)% z   - m*n*l matrix
% s   - width of the bars (0 to 1)
% c   - l*3 color scheme matrixx = 1:size(z,2);
y = 1:size(z,1);
ngroups = size(z,3); % get bin centers
[x1,y1] = meshgrid(x,y);
% initial zldata
z1 = zeros(size(z,1),size(z,2));for i = 1:ngroupsz2 = z1;z1 = z1+squeeze(z(:,:,i));h(i) = bar3level(x1, y1, z2, z1, c(i,1:3), s);hold on
end
% axis tight
set(gca,'ydir','reverse')
set(gca,'xlim',[1-s/2 max(x)+s/2])
dx = diff(get(gca,'xlim'));
dy = size(z,1)+1;
dz = (sqrt(5)-1)/2*dy;
set(gca,'PlotBoxAspectRatio',[dx dy dz])
view(gca, 3);
grid on
box on
endfunction h = bar3level(x,y,zl,zu,color,scale)% assign default values for undeclared parameters
width = 1*scale;
x = x(:);
y = y(:);
zl = zl(:);
zu = zu(:);
nx = length(x);sx = width/2;
sy = width/2;% plot the bars
for i=1:nxx1=x(i); y1=y(i); zl1=zl(i); zu1=zu(i);% set verticesverts=[x1-sx y1-sy zl1x1-sx y1+sy zl1x1+sx y1-sy zl1x1+sx y1+sy zl1x1-sx y1-sy zu1x1-sx y1+sy zu1x1+sx y1-sy zu1x1+sx y1+sy zu1];% set facesfaces=[1 2 6 5;3 1 5 7;4 3 7 8;2 4 8 6;5 6 8 7;1 2 4 3];patchinfo.Vertices = verts;patchinfo.Faces = faces;patchinfo.FaceColor = color;h=patch(patchinfo,'CDataMapping','scaled','Edgecolor','k');hold on;
end
end
data.mat数据包
val(:,:,1) =-Inf -Inf -Inf 0 0 0 0 0 -Inf -Inf-Inf -Inf 0 -Inf 0 0 0 0 0 -Inf-Inf 0 0 0.6931 1.6094 1.0986 0.6931 -Inf 0.6931 0-Inf 0 0 1.6094 2.9444 2.8904 1.7918 1.0986 0.6931 00 0 0.6931 2.0794 3.8067 3.9703 2.0794 1.3863 0 00 0 0.6931 1.6094 2.4849 2.5649 1.6094 1.0986 0 0.69310 0 0 1.3863 1.7918 1.0986 0 0 0 00 0 0 0 0.6931 -Inf 0 0 -Inf 0-Inf -Inf 0 -Inf 0.6931 -Inf 0.6931 0 0 -Inf0 -Inf 0 0 0 -Inf 0 -Inf -Inf -Infval(:,:,2) =-Inf -Inf -Inf 0 0 0 0 0 -Inf -Inf-Inf -Inf 0 -Inf 0 0 0 0 0 -Inf-Inf 0 0 1.3863 3.2189 2.1972 1.3863 -Inf 1.3863 0-Inf 0 0 3.2189 5.8889 5.7807 3.5835 2.1972 1.3863 00 0 1.3863 4.1589 7.6133 7.9406 4.1589 2.7726 0 00 0 1.3863 3.2189 4.9698 5.1299 3.2189 2.1972 0 1.38630 0 0 2.7726 3.5835 2.1972 0 0 0 00 0 0 0 1.3863 -Inf 0 0 -Inf 0-Inf -Inf 0 -Inf 1.3863 -Inf 1.3863 0 0 -Inf0 -Inf 0 0 0 -Inf 0 -Inf -Inf -Infval(:,:,3) =-Inf -Inf -Inf 0 0 0 0 0 -Inf -Inf-Inf -Inf 0 -Inf 0 0 0 0 0 -Inf-Inf 0 0 2.0794 4.8283 3.2958 2.0794 -Inf 2.0794 0-Inf 0 0 4.8283 8.8333 8.6711 5.3753 3.2958 2.0794 00 0 2.0794 6.2383 11.4200 11.9109 6.2383 4.1589 0 00 0 2.0794 4.8283 7.4547 7.6948 4.8283 3.2958 0 2.07940 0 0 4.1589 5.3753 3.2958 0 0 0 00 0 0 0 2.0794 -Inf 0 0 -Inf 0-Inf -Inf 0 -Inf 2.0794 -Inf 2.0794 0 0 -Inf0 -Inf 0 0 0 -Inf 0 -Inf -Inf -Infval(:,:,4) =-Inf -Inf -Inf 0 0 0 0 0 -Inf -Inf-Inf -Inf 0 -Inf 0 0 0 0 0 -Inf-Inf 0 0 2.7726 6.4378 4.3944 2.7726 -Inf 2.7726 0-Inf 0 0 6.4378 11.7778 11.5615 7.1670 4.3944 2.7726 00 0 2.7726 8.3178 15.2266 15.8812 8.3178 5.5452 0 00 0 2.7726 6.4378 9.9396 10.2598 6.4378 4.3944 0 2.77260 0 0 5.5452 7.1670 4.3944 0 0 0 00 0 0 0 2.7726 -Inf 0 0 -Inf 0-Inf -Inf 0 -Inf 2.7726 -Inf 2.7726 0 0 -Inf0 -Inf 0 0 0 -Inf 0 -Inf -Inf -Infval(:,:,5) =-Inf -Inf -Inf 0 0 0 0 0 -Inf -Inf-Inf -Inf 0 -Inf 0 0 0 0 0 -Inf-Inf 0 0 3.4657 8.0472 5.4931 3.4657 -Inf 3.4657 0-Inf 0 0 8.0472 14.7222 14.4519 8.9588 5.4931 3.4657 00 0 3.4657 10.3972 19.0333 19.8515 10.3972 6.9315 0 00 0 3.4657 8.0472 12.4245 12.8247 8.0472 5.4931 0 3.46570 0 0 6.9315 8.9588 5.4931 0 0 0 00 0 0 0 3.4657 -Inf 0 0 -Inf 0-Inf -Inf 0 -Inf 3.4657 -Inf 3.4657 0 0 -Inf0 -Inf 0 0 0 -Inf 0 -Inf -Inf -Inf风玫瑰 图
图
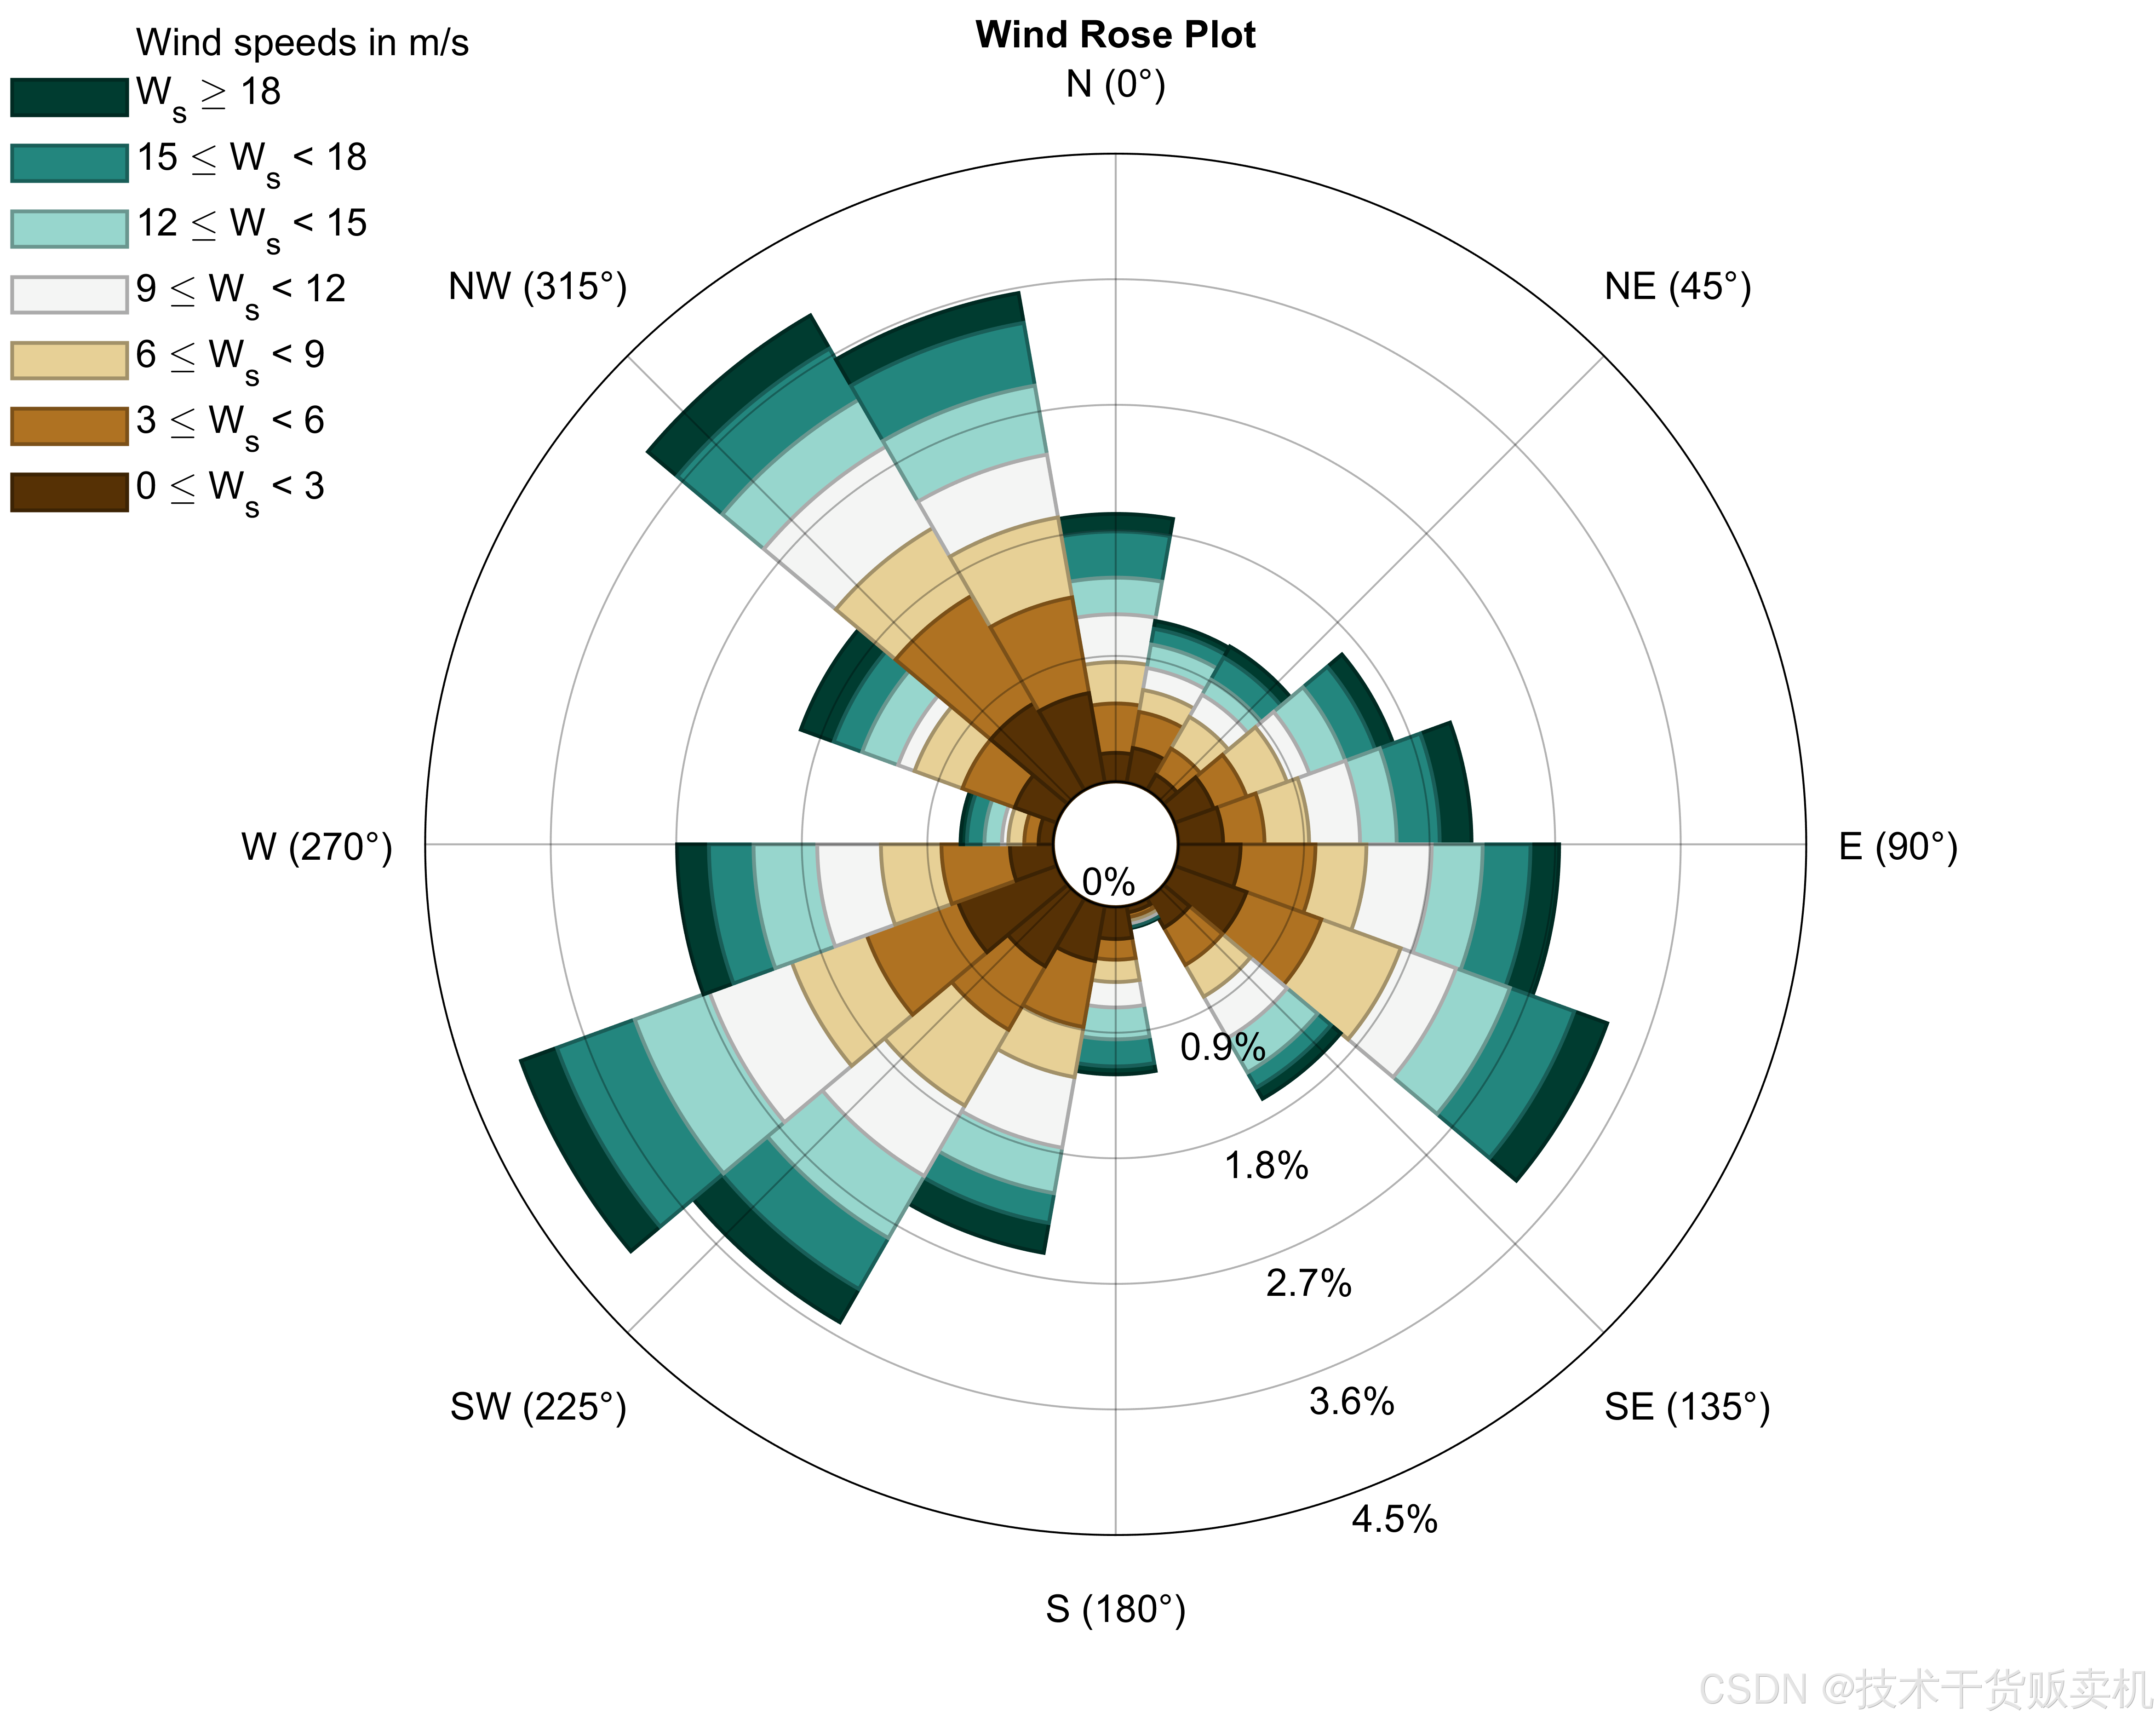
WindRosePlot.m文件
clc;
clear;
close all;
%风玫瑰图
%% 数据准备
% 读取数据
load data.mat
D = direction;
S = speed;%% 风玫瑰图绘制
map = colormap(nclCM(399)); %color包里选颜色
close all;
Options = {'anglenorth',0,...'angleeast',90,...'labels',{'N (0°)','NE (45°)','E (90°)','SE (135°)','S (180°)','SW (225°)','W (270°)','NW (315°)'},...'freqlabelangle','auto',...'nspeeds',7,...'ndirections',18,...'lablegend','Wind speeds in m/s',...'legendtype',2,...'legendvariable','W_s',...'min_radius',0.1,...'titlestring','Wind Rose Plot',...'height',12*50,...'width',15*50,...'cmap',map};
figureHandle = WindRose(D,S,Options);
WindRose.m文件
function [figure_handle,count,speeds,directions,Table,Others] = WindRose(direction,speed,varargin)%% WindRose - https://dpereira.asempyme.com/windrose% Draw a Wind Rose knowing direction and speed%% [figure_handle,count,speeds,directions,Table,Others] = WindRose(direction,speed);% [figure_handle,count,speeds,directions,Table,Others] = WindRose(direction,speed,'parameter1',value1,...);%% figure_handle is the handle of the figure containing the chart% count is the frequency for each speed (ncolumns = nspeeds) and for each direction (nrows = ndirections).% speeds is a 1 by n vector containing the values for the speed intervals% directions is a m by 1 vector containing the values in which direction intervals are centered% Table is a (4+m) by (3+m) cell array (excel-ready), containing Frequencies for each direction and for each speed. %% User can specify direction angle meaning North and East winds, so% the graphs is shown in the desired reference%% % Example:% %----------------------------------------------------------------% d = 360*rand(10000,1); % My reference is North = 0º, East = 90º.% v = 30*rand(10000,1);%% % Default notation with several input arguments% [figure_handle,count,speeds,directions,Table,Others] = WindRose(d,v,'anglenorth',0,'angleeast',90,'labels',{'N (0º)','S (180º)','E (90º)','W (270º)'},'freqlabelangle',45);%% % All the wind rose options into a cell array, so function call can be simplified% Properties = {'anglenorth',0,'angleeast',90,'labels',{'N (0º)','S (180º)','E (90º)','W (270º)'},'freqlabelangle',45};% [figure_handle2,count2,speeds2,directions2,Table2,Others2] = WindRose(d,v,Properties);% % % All the wind rose options into a structure, so options can be modified with ease between function calls.% Options.AngleNorth = 0;% Options.AngleEast = 90;% Options.Labels = {'N (0º)','E (90º)','S (180º)','W (270º)'};% Options.FreqLabelAngle = 45;% [figure_handle3,count3,speeds3,directions3,Table3,Others3] = WindRose(d,v,Options);% Options2 = Options;% Options2.Labels = {'North','NNE','NE','ENE','East','ESE','SE','SSE','South','SSW','SW','WSW','West','WNW','NW','NNW'};% [figure_handle4,count4,speeds4,directions4,Table4,Others4] = WindRose(d,v,Options2);%%%% PARAMETER CLASS DEFAULT VALUE DESCRIPTION%----------------------------------------------------------------------------------------------------------------------------------------------------------------% 'centeredin0' Logical. true Is first angular bin centered in 0 (-5 to 5)? -> CeteredIn0 = true // or does it start in 0 (0 to 10)? -> CeteredIn0 = false.% 'ndirections' Numeric. 36 Number of direction bins (subdivisions) to be shown.% 'freqround' Numeric. [] (auto) Maximum frquency value will be rounded to the first higher whole multiple of FrequenciesRound. Only applies if 'maxfrequency' is specified.% 'nfreq' Numeric. 5 Draw this number of circles indicating frequency.% 'speedround' Numeric. [] (auto) Maximum wind speed will be rounded to the first higher whole multiple of WindSpeedRound.% 'nspeeds' Numeric. [] (auto) or 6 Draw this number of windspeeds subdivisions (bins). Default is 6 if 'speedround' is specified. Otherwise, default is automatic.% 'maxfrequency' Numeric. [] (auto) Set the value of the maximum frequency circle to be displayed. Be careful, because bins radius keep the original size.% 'freqlabelangle' Numeric/String. 'auto' Angle in which frequecy labels are shown. If this value is empty or is NaN, the frequency labels will NOT be shown. Trigonometric reference. 0=Right, 90=Up. You can use 'auto' to show them in the optimal position. Use 'ruler' or 'RulerRight' to show frequencies as if it was a ruler to the right of the plot. Use 'RulerLeft', to show the frequencies in ruler format to the left. % 'titlestring' Cell/String. 'Wind Rose' Figure title. No need to add empty line below anymore% 'lablegend' String. 'Wind speeds in m/s' String that will appear at the top of the legend. Can be empty.% 'legendvariable' String. 'W_S' Variable abbreviation that appears inside the legend. You can use TeX sequences.% 'cmap' / 'colormap' Numeric/String. 'parlua/jet' Nx3 RGB map or String with the name of a colormap function. If the string option is chosen and if you put inv before the name of the colormap funcion, colors will be flipped (e.g. 'invjet', 'invautum', 'invbone', 'invparula', ...). Use any of the built-in functions (autumn, bone, colorcube, cool, copper, flag, gray, hot, hsv, jet, lines, pink, prism, spring, summer, white, winter). See doc colormap for more information.% 'height' Numeric. 2/3*screensize Figure inner height in pixels. Default is 2/3 of minimum window dimension;% 'width' Numeric. 2/3*screensize Figure inner width in pixels. Default is 2/3 of minimum window dimension;% 'figcolor' Color Code. 'w' Figure color, any admitted matlab color format. Default is white. If 'axes' is specified, figure color will be used as background color.% 'labels' CellString {'N','E','S','W'} Specify North South East West in a cell array of strings. Now you can specify as many as you want, for example: {'N','NE','E','SE','S','SW','W','NW'}% 'labelnorth' Cell/String. 'N' Label to indicate North. Be careful if you specify 'labels' and 'labelnorth'. Last parameter specified will be the one used.% 'labelsouth' Cell/String. 'S' Label to indicate South. Be careful if you specify 'labels' and 'labelsouth'. Last parameter specified will be the one used.% 'labeleast' Cell/String. 'E' Label to indicate East. Be careful if you specify 'labels' and 'labeleast' . Last parameter specified will be the one used.% 'labelwest' Cell/String. 'W' Label to indicate West. Be careful if you specify 'labels' and 'labelwest' . Last parameter specified will be the one used.% 'anglenorth' Numeric. 90 Direction angle meaning North wind. Default is 90 for North (trigonometric reference). If you specify 'north' angle, you need to specify 'east' angle, so the script knows how angles are referenced.% 'angleeast' Numeric. 0 Direction angle meaning East wind. Default is 0 for East (counterclockwise). If you specify 'east' angle, you need to specify 'north' angle, so the script knows how angles are referenced.% 'min_radius' Numeric. 1/15 Minimum radius of the wind rose, relative to the maximum frequency radius. An empty circle of this size appears if greater than 0.% 'legendtype' Numeric. 2 Legend type continuous = 1 (colorbar), separated boxes = 2 (legend)% 'toolbar' String. 'figure' Choose if you want to show figure's toolbar ('figure') or hide it ('none')% 'menubar' String. 'figure' Choose if you want to show figure's menubar ('figure') or hide it ('none')% 'colors' Num Array. [] If 'nspeeds' has been specified, colors can be a nspeeds-by-3 array (R G B), containing the color for each speed (lowest in first row, highest in last row). Color components must be in range 0 to 1. % 'inverse' Logical. false Specify if slowest speeds are shown in the outermost side of the rose (true) or if slowest speeds are shown in the center of the rose (false). cmap is automatically inverted.% 'vwinds' Num Array. [] Specify the wind speeds that you want to appear on the windrose, instead of just specifying the number of speed bins% 'scalefactor' Numeric. 1 Specify the relative size of the windrose inside the figure 1=max, 0= not showing% 'axes' Numeric. [] Specify the axes handle in which the wind rose will be represented. Use 'axes',gca to plot the wind rose in the current axes% 'gridcolor' Matlab color. 'k' Specify the grid color (for both, radial an circular grid) % 'gridstyle' Line style. ':' & '-' Specify the grid line style (for both, radial an circular grid)% 'gridwidth' Numeric. 0.5 Specify the grid line width (for both, radial an circular grid)% 'gridalpha' Numeric. 0.3 Specify the grid line alpha (for both, radial an circular grid) - Only available in version 8.4 and above% 'radialgridcolor' Matlab color. 'k' Specify the radial grid color% 'radialgridstyle' Line style. ':' & '-' Specify the radial grid line style% 'radialgridwidth' Numeric. 0.5 Specify the radial grid line width% 'radialgridalpha' Numeric. 0.3 Specify the radial grid line alpha - Only available in version 8.4 and above% 'circulargridcolor' Matlab color. 'k' Specify the circular grid color% 'circulargridstyle' Line style. ':' & '-' Specify the circular grid line style% 'circulargridwidth' Numeric. 0.5 Specify the circular grid line width% 'circulargridalpha' Numeric. 0.3 Specify the circular grid line alpha - Only available in version 8.4 and above% 'radialgridnumber' Numeric. 12 Specify the number of the grid radial divisions % 'zeroandnegative' Boolean. false Specify if you want to show zero and negative values in the plot% 'X' Numeric. 0 Set where to place the wind rose by coordinates X and Y% 'Y' Numeric. 0 Set where to place the wind rose by coordinates X and Y% 'CenterLocation' Numeric 2×1. [0,0] Set where to place the wind rose by coordinates X and Y% 'PlotOnTop' Boolean. false Decide whether to plot the frequency patches over the grid or not% 'EdgeWidth' Numeric. 1 Edge width of the patches% 'FrequencyFontSize' Numeric. Matlab's default Frequency labels' font size% 'EdgeColor' Color Code. 'normal' Change the patches' edge color. Default is 'normal', which means slightly darker edges.% 'textcolor' Color Code. 'k' Text and axis color, any admitted matlab color format. Default is black.% 'textfontname' String. 'Helvetica' Specify font name for frequency and axis labels% 'frequencyfontsize' Numeric. Matlab's default Change Frequency Labels Font Size% 'frequencyfontname' String. Matlab's default Change Frequency Labels Font (use command listfonts to list available fonts)% 'frequencyfontweight' 'normal/'bold'. 'normal' Change Frequency Labels Font Weight (normal/bold/light/demi) % 'frequencyfontangle' 'normal'/'italic'. 'normal' Change Frequency Labels Font Angle (normal/italic)% 'frequencyfontcolor' Matlab color. 'k' Change Frequency Labels Font Color% 'axesfontsize' Numeric. Matlab's default Change Axes Labels (N,E,S,W) Font Size% 'axesfontname' String. Matlab's default Change Axes Labels (N,E,S,W) Font (use command listfonts to list available fonts)% 'axesfontweight' 'normal/'bold'. 'normal' Change Axes Labels (N,E,S,W) Font Weight (normal/bold/light/demi) % 'axesfontangle' 'normal'/'italic'. 'normal' Change Axes Labels (N,E,S,W) Font Angle (normal/italic)% 'axesfontcolor' Matlab color. 'k' Change Axes Labels (N,E,S,W) Font Color% 'titlefontsize' Numeric. Matlab's default Change Figure Title Font Size% 'titlefontname' String. Matlab's default Change Figure Title Font (use command listfonts to list available fonts)% 'titlefontweight' 'normal/'bold'. 'normal' Change Figure Title Font Weight (normal/bold/light/demi) % 'titlefontangle' 'normal'/'italic'. 'normal' Change Figure Title Font Angle (normal/italic)% 'titlecolor' Matlab color. 'k' Change Figure Title Font Color% 'legendfontsize' Numeric. Matlab's default Change Legend & Legend type 1 title Font Size% 'legendfontname' String. Matlab's default Change Legend & Legend type 1 title Font (use command listfonts to list available fonts)% 'legendfontweight' 'normal/'bold'. 'normal' Change Legend & Legend type 1 title Font Weight (normal/bold/light/demi) % 'legendfontangle' 'normal'/'italic'. 'normal' Change Legend & Legend type 1 title Font Angle (normal/italic)% 'legendcolor' Matlab color. 'k' Change Legend & Legend type 1 title Font Color% 'legendbarfontsize' Numeric. Matlab's default Change Legend Type 1 Colorbar Font Size => If not set, the value used will be equal to legendfontsize% 'legendbarfontname' String. Matlab's default Change Legend Type 1 Colorbar Font (use command listfonts to list available fonts) => If not set, the value used will be equal to legendfontname% 'legendbarfontweight' 'normal/'bold'. 'normal' Change Legend Type 1 Colorbar Font Weight (normal/bold) => If not set, the value used will be equal to legendfontweight% 'legendbarfontangle' 'normal'/'italic'. 'normal' Change Legend Type 1 Colorbar Font Angle (normal/italic) => If not set, the value used will be equal to legendfontangle% 'legendbarcolor' Matlab color. 'k' Change Legend Type 1 Colorbar Color (numbers and box) => If not set, the value used will be equal to legendcolor% 'edgealpha' Numeric. 1 Change the opacity of the edge of the windrose patches % 'facealpha' Numeric. 1 Change the opacity of the face of the windrose patches % 'normalize' Boolean. false Show all patches at 100% frequency (the outermost part of the circle) but showing the frequency label for each% 'logcsale' Boolean. false Show frequencies in logarithmic scale% 'logfactor' Numeric. 10 Factor for scaling logarithmic scale frequencies.%%%% CHANGELOG:%% 2023/Feb/15 - Added option to show frequencies in logarithmic scale with ('logscale',true). Also, logarithmic factor (>=2) for the scaling is added, with a default value of 10 ('logfactor',10)% Added the possibility to manually define the frequency grid manually by using 'freqs',[10 20 40 70 100] (note that the values must be specified as a percentage, rather than a fraction of 1). Frequency=0 is always shown.% Added a new "Others" output, to retrieve the frequency grid (in case it is modified when using logarithmic scale)% Default 'freqround' has been changed from 1 to automatic.% 2023/Feb/06 - Added option to normalize the extension of the sectors/arms/patches => 'normalize',true will display all the sectors with full length, and the relative frequency of each sector on the outside.% Added minimum radius circle to the plot (now, with the gap option, it is necessary)% Changed histc function for a custom line of code to determine the speed bins. This avoids problems with backwards compatibility and the warning message of using "histc" instead if histocunts. The custom function does exactly the same as in previous versions, so the result does not change at all.% Checked and rechecked that the "AngleNorth" and "AngleEast" reference angles affect the output at desired, even with angles different to 0-90-180-270deg. Please check the data, the function call and the resulting figure and table before posting a comment/request on this. % 2023/Jan/31 - Added documentation for legendPosition and legendOrientation, correcting legendOrientation for colorbar legends.% 2023/Jan/25 - Thanks to Clive Holden from Oceanographic Field Services for funding these changes% Added ability to change text color, fontname, fontweight, fontangle and size independently for each type of text (Title, axes label, frequency labels, legend, colorbar)% Added the possibility of leaving a gap between arms/patches/sectors of the Wind Rose => use 'gap',x where x is a fraction of the angular spawn of the actual angles covered. gap=0=>No gap; gap=1=>all gap & no windrose.% Opacity of the face and edge of the windrose can now be changed using 'FaceAlpha' and 'EdgeAlpha' respectively (only if this is allowed by your matlab version, otherwise a warning message will appear).% The last speed bin (>X) now shows values, because when sorting the speeds and the bins, the maximum value is omitted now, so >X has values inside.% The default variable name has been changed from W_S to u_w% Using inverted colormaps with invcolormap should be called from now on using inv_colormap to prevent conflicts with colormaps actually starting with inv. Using inv is still maintained to keep backwards compatibility, but a warning is shown.% Corrected an error on radial grid placement. The radial grid now starts placing from 90deg trigonometric, to match the label placement. It previously started at 0deg trigonometric (3 o'clock), so it did not match with the label placement, which started at 90deg trigonometric (12 o'clock). This was noticeable when not using a number of labels or radial axes multiple of 4.% 2022/Aug/14 - Thanks to JoséMiguel Jáuregui and NAYXA for funding the following changes% Added 'analysisMode' (true/false): 'analysisMode',true will not show the figure. It will only creates the tables and output arguments of the function.% Extra output added: Others (Structure including: MaxFrequency shown in axes, nFrequencies (number of Frequencies) shown). Access these using Others.MaxFrequency, Others.nFrequencies, ...% Combining AnalysisMode and new output is useful to normalize limits and wind speeds of several windroses.% Added 'legendPosition' option. Valid values are: 'northwest' (default for box legend),'north','northeast','west','east' (default for colobar legend),'southwest','south','southeast'; Colobar legend only accepts 'north','east','south','west'% Added 'legendOrientation' option. Valid values are: 'vertical' (default) and 'horizontal'% 2022/Jul/04 - Possibility to change edgecolor of the patches. ('edgecolor','normal') is the default, with slightly darker edges. Any other color option can be used: ('edgecolor','none') or ('edgecolor','k') or ('edgecolor',[0 0.3 0.5])% Colormap can now be input using 'colormap' and 'colmap', not only 'cmap'% 2021/Jun/08 - Frequency labels shown by default in the best position% Thanks to Josselin Gautier for these ideas:% Added option to change frequency font size ('FrequencyFontSize',N), N beign a valid font size value% Added option to change patches line width ('edgewidth',N), N being a valid linewidth value% Added option to show patches in front of the grid ('plotontop',true)% 2021/Apr/20 - Thanks to Jacqueline Freire Rigatto for the idea of adding option to show frequencies as in a ruler% Added a space below the title string so it does not interfere with the upper label% Added the variable name into legend type 1 (colorbar)% 2020/Mar/04 - Added option to plot the windrose in the desired position (X,Y) in a plot. This is very useful combined with scalefactor.% 2020/Mar/03 - Changed the way in which labels are read. The order now should be 'North','East','South','West'.% Added options for grid line styles (color, line style and transparency/alpha) both for radial and circular grids.% Added option for variable adial divisions.% New angular-label options, now the function is able to support several labels in form of a cell array, which will be equally spaced.% cMap now allows a Nx3 array of colors, which will be interpolated for the number of speeds shown (previously, the only option was to put these colors into 'colors' with a number if colors matching the 'nspeeds')% Added ability to change text, title and legend font through 'textfontname', 'titlefontname' and 'legendfontname' respectively% Added option to show frequency labels in the best place possible, with 'auto' option for 'freqlabelangle'% Added ability to plot zero and negative data% 2015/Jun/22 - Corrected histogram count inside function "PivotTableCount", which didn't consider always values greater than the max(vwinds) value.% 2015/Mar/13 - Added option to represent windrose inside given axes handle% 2015/Feb/22 - Corrected small errors.% Created extra documentation.% Corrected help dialog% 2014/Jul/28 - Figure has options to hide/show menubar and toolbar. Default is that menubar and toolbar are shown.% Default min_radius is 1/15 instead of 1/30.% User can specify speed bins 'colors' (necessary that nspeeds or vwinds are specified)% Order of the speeds can be modified: lowest speeds inside ('inverse',false) -default- or lowest speeds outside ('inverse',true)% Speed bins can be explicitly defined ('vwinds'), instead of just defining the number of the speed bins% Corrected bug when showing colorbar ('legendtype',2) with cmap other than jet% All options can now be passed to the function into a single cell array or a structure, where fieldnames are the property to be modified.% 2014/Jul/14 - First version%%%% by Daniel Pereira - daniel.pereira.valades@gmail.com - https://dpereira.asempyme.com/windrose%% Check funciton callif nargin<2error('WindRose needs at least two inputs'); % function needs 2 input argumentselseif mod(length(varargin),2)~=0 % If varargin are not pairedif (length(varargin)==1 && isstruct(varargin{1})) % Could be a single structure with field names and field values.varargin = reshape([fieldnames(varargin{1}) struct2cell(varargin{1})]',1,[]); % Create varargin as if they were separate inputselseif (length(varargin)==1 && iscell(varargin{1})) % Could be a single cell array with all the vararginsvarargin = reshape(varargin{1},1,[]); % Reshape just in case, and create varargin as if they were separate inputs.elseerror('Inputs must be paired: WindRose(Speed,Direction,''PropertyName'',PropertyValue,...)'); % If not any of the two previous cases, errorendelseif ~isnumeric(speed) || ~isnumeric(direction) % Check that speed and direction are numeric arrays.error('Speed and Direction must be numeric arrays.');elseif ~isequal(size(speed),size(direction)) % Check that speed and direction are the same size.error('Speed and Direction must be the same size.');end%% Default parameters
SCS = get(0,'screensize');CeteredIn0 = true;
ndirections = 36;
FrequenciesRound = [];
NFrequencies = 5;
NFrequenciesUser = false;
WindSpeedRound = [];
NSpeeds = [];
circlemax = [];
FreqLabelAngle = 'auto';
TitleString = 'Wind Rose';
lablegend = 'Wind Speeds in m/s';
height = min(SCS(3:4))*2/3;
width = min(SCS(3:4))*2/3;
figcolor = 'w';
TextColor = 'k';
label.N = 'N';
label.S = 'S';
label.W = 'W';
label.E = 'E';
legendvariable = 'u_w';
RefN = 90;
RefE = 0;
min_radius = 1/15;
LegendType = 2;
MenuBar = 'figure';
ToolBar = 'figure';
colors = [];
inverse = false;
vwinds = [];
scalefactor = 1;
axs = [];
hg2_support = ~verLessThan('matlab', '8.4');
% hg2_support = ([1 0.01]*sscanf(version,'%d.',2)>=8.40);
RadialGridColor = 'k';
CircularGridColor = 'k';
RadialGridWidth = 0.5;
CircularGridWidth = 0.5;
Ngridradius = 12;
considerZeroAndNegative = false;
textfontname = 'Helvetica';
plotinback = true;
LineWidth = 1;
EdgeColor = 'normal';
legendpos = 'northwest';
colorbarpos = 'eastoutside';
legendori = 'vertical';
analysis = false;
gap = 0;frequencyFontSize = get(0, 'DefaultAxesFontSize');
frequencyFontWeight = 'normal';
frequencyFontAngle = 'normal';
axisFontSize = get(0, 'DefaultAxesFontSize');
axisFontWeight = 'normal';
axisFontAngle = 'normal';
titlefontsize = get(0, 'DefaultAxesFontSize');
titlefontweight = 'bold';
titlefontangle = 'normal';
legendfontsize = get(0, 'DefaultAxesFontSize');
legendfontweight = 'normal';
legendfontangle = 'normal';
normalization = false;
logscale = false;
logfactor = 10;
circlesUser = false;
maxfrequencyUser = false;EdgeAlpha = 1;
FaceAlpha = 1;X = 0;
Y = 0;if ~hg2_supportRadialGridStyle = ':';CircularGridStyle = ':';RadialGridAlpha = 1;CircularGridAlpha = 1;
elseRadialGridStyle = '-';CircularGridStyle = '-';RadialGridAlpha = 0.3;CircularGridAlpha = 0.3;
endif (exist('parula','builtin') || exist('parula','file'))colorfun = 'parula';
elsecolorfun = 'jet';
end%% User-.specified parameters
figcolorspecif = false;
alphawarningshown = false;
lots_of_labels = false;
colormap_set = false;
XYposition_set = false;
EdgeColorModified = false;for i=1:2:numel(varargin)switch lower(varargin{i})case 'centeredin0'CeteredIn0 = varargin{i+1};case 'ndirections'ndirections = varargin{i+1};case 'ndir'ndirections = varargin{i+1};case 'ndirs'ndirections = varargin{i+1};case 'freqround'FrequenciesRound = varargin{i+1};case 'nfreq'NFrequencies = varargin{i+1}; NFrequenciesUser = true;case 'speedround'WindSpeedRound = varargin{i+1};case 'nspeeds'NSpeeds = varargin{i+1};case 'freqlabelangle'FreqLabelAngle = varargin{i+1};case 'titlestring'TitleString = varargin{i+1};case 'lablegend'lablegend = varargin{i+1};case {'cmap','colormap','colmap'}colorfun = varargin{i+1};if ~ischar(colorfun) && size(colorfun,1)>1 && size(colorfun,2)==3colormap_set = true;elseif ~ischar(colorfun) && size(colorfun,1)<=1 && size(colorfun,2)~=3error('You can specify a color array for defining the colormap to be used, but an array of at least 2x3 must be used');endcase 'height'height = varargin{i+1};case 'width'width = varargin{i+1};case 'textcolor'TextColor = varargin{i+1};case 'figcolor'figcolor = varargin{i+1};figcolorspecif = true;case 'min_radius'min_radius = varargin{i+1};case 'maxfrequency'circlemax = varargin{i+1};maxfrequencyUser = true;case 'legendvariable'legendvariable = varargin{i+1};case 'legendtype'LegendType = varargin{i+1};case 'inverse'inverse = varargin{i+1};case 'labelnorth'label.N = varargin{i+1};case 'labelsouth'label.S = varargin{i+1};case 'labeleast'label.E = varargin{i+1};case 'labelwest'label.W = varargin{i+1};case 'labels'if length(varargin{i+1})==4label.N = varargin{i+1}{1};label.E = varargin{i+1}{2};label.S = varargin{i+1}{3};label.W = varargin{i+1}{4};elselots_of_labels = true;label = varargin{i+1};if ~any(arrayfun(@(x) strcmpi(x,'radialgridnumber'),varargin))Ngridradius = length(label);endendcase 'menubar'MenuBar = varargin{i+1};case 'toolbar'ToolBar = varargin{i+1};case 'scalefactor'scalefactor = varargin{i+1};case 'vwinds'k = any(arrayfun(@(x) strcmpi(x,'nspeeds'),varargin));if kwarning('''vwinds'' and ''nspeeds'' have been specified. The value for ''nspeeds'' wil be omitted');endvwinds = varargin{i+1};case 'colors'k = any(arrayfun(@(x) strcmpi(x,'nspeeds'),varargin)) + any(arrayfun(@(x) strcmpi(x,'vwinds'),varargin));if ~kerror('To specify ''colors'' matrix, you need to specify the number of speed bins ''nspeeds'' or the speeds to be used ''vwinds''');endk = any(arrayfun(@(x) strcmpi(x,'cmap'),varargin)) || any(arrayfun(@(x) strcmpi(x,'colormap'),varargin)) || any(arrayfun(@(x) strcmpi(x,'colmap'),varargin));if kwarning('Specified colormap is not being used, since ''colors'' argument has been manually set by user');endcolors = varargin{i+1};case 'anglenorth'k = any(arrayfun(@(x) strcmpi(x,'angleeast'),varargin));if ~kerror('Reference angles need to be specified for AngleEAST and AngleNORTH directions');endcase 'angleeast'k = find(arrayfun(@(x) strcmpi(x,'anglenorth'),varargin));if isempty(k)error('Reference angles need to be specified for AngleEAST and AngleNORTH directions');elseRefE = varargin{i+1};RefN = varargin{k+1};endif abs(RefN-RefE)~=90error('The angles specified for north and east must differ in 90 degrees');endcase 'axes'axs = varargin{i+1};case 'gridcolor'if ~any(arrayfun(@(x) strcmpi(x,'radialgridcolor'),varargin))RadialGridColor = varargin{i+1};endif ~any(arrayfun(@(x) strcmpi(x,'circulargridcolor'),varargin))CircularGridColor = varargin{i+1};endcase 'gridstyle'if ~any(arrayfun(@(x) strcmpi(x,'radialgridstyle'),varargin))RadialGridStyle = varargin{i+1};endif ~any(arrayfun(@(x) strcmpi(x,'circulargridstyle'),varargin))CircularGridStyle = varargin{i+1};endcase 'gridwidth'if ~any(arrayfun(@(x) strcmpi(x,'radialgridwidth'),varargin))RadialGridWidth = varargin{i+1};endif ~any(arrayfun(@(x) strcmpi(x,'circulargridwidth'),varargin))CircularGridWidth = varargin{i+1};endcase 'gridalpha'if ~hg2_support && ~alphawarningshownwarning('Line Alpha is now supported by this matlab version\nGrid Line will be fully opaque. Use ''gridstyle'','':'' as an appropiate grid style');alphawarningshown = true;endif ~any(arrayfun(@(x) strcmpi(x,'radialgridalpha'),varargin))RadialGridAlpha = varargin{i+1};endif ~any(arrayfun(@(x) strcmpi(x,'circulargridalpha'),varargin))CircularGridAlpha = varargin{i+1};endcase 'radialgridcolor'RadialGridColor = varargin{i+1};case 'circulargridcolor'CircularGridColor = varargin{i+1};case 'radialgridstyle'RadialGridStyle = varargin{i+1};case 'circulargridstyle'CircularGridStyle = varargin{i+1};case 'radialgridwidth' RadialGridWidth = varargin{i+1};case 'circulargridwidth' CircularGridWidth = varargin{i+1};case 'radialgridalpha'if ~hg2_support && ~alphawarningshownwarning('Line Alpha is now supported by this matlab version\nGrid Line will be fully opaque. Use ''gridstyle'','':'' as an appropiate grid style');alphawarningshown = true;endRadialGridAlpha = varargin{i+1};case 'circulargridalpha'if ~hg2_support && ~alphawarningshownwarning('Line Alpha is now supported by this matlab version\nGrid Line will be fully opaque. Use ''gridstyle'','':'' as an appropiate grid style');alphawarningshown = true;endCircularGridAlpha = varargin{i+1};case 'radialgridnumber'Ngridradius = varargin{i+1};case 'zeroandnegative'considerZeroAndNegative = varargin{i+1};case 'textfontname'textfontname = varargin{i+1};case 'x'X = varargin{i+1};XYposition_set = true;case 'y'Y = varargin{i+1};XYposition_set = true;case 'centerlocation'X = varargin{i+1}(1);Y = varargin{i+1}(2);XYposition_set = true;case 'plotontop'plotinback = ~varargin{i+1};case 'edgewidth'LineWidth = varargin{i+1};if LineWidth<=0LineWidth = 0.01;warning('EdgeWidth must be greater than 0. Using 0.01 instead');endcase 'edgecolor'EdgeColor = varargin{i+1};EdgeColorModified = true;case 'legendposition'legendpos = varargin{i+1};colorbarpos = varargin{i+1};case 'legendorientation'legendori = varargin{i+1};case 'analysismode'analysis = varargin{i+1};case 'frequencyfontsize'frequencyFontSize = varargin{i+1};case 'frequencyfontname'frequencyFontName = varargin{i+1};case 'frequencyfontweight'frequencyFontWeight = varargin{i+1};case 'frequencyfontangle'frequencyFontAngle = varargin{i+1};case 'frequencyfontcolor'frequencyFontColor = varargin{i+1};case 'axesfontsize'axisFontSize = varargin{i+1};case 'axesfontname'axisFontName = varargin{i+1};case 'axesfontweight'axisFontWeight = varargin{i+1};case 'axesfontangle'axisFontAngle = varargin{i+1};case 'axesfontcolor'axisFontColor = varargin{i+1};case 'titlecolor'TitleColor = varargin{i+1};case 'titlefontsize'titlefontsize = varargin{i+1};case 'titlefontname'titlefontname = varargin{i+1};case 'titlefontweight'titlefontweight = varargin{i+1};case 'titlefontangle'titlefontangle = varargin{i+1};case 'legendfontname'legendfontname = varargin{i+1};case 'legendfontsize'legendfontsize = varargin{i+1};case 'legendfontweight'legendfontweight = varargin{i+1};case 'legendfontangle'legendfontangle = varargin{i+1};case 'legendcolor'LegendColor = varargin{i+1};case 'legendbarfontname'legendbarfontname = varargin{i+1};case 'legendbarfontsize'legendbarfontsize = varargin{i+1};case 'legendbarfontweight'legendbarfontweight = varargin{i+1};case 'legendbarcolor'LegendBarColor = varargin{i+1};case 'legendbarfontangle'legendbarfontangle = varargin{i+1};case 'edgealpha'EdgeAlpha = varargin{i+1};case 'facealpha'FaceAlpha = varargin{i+1};case 'gap'gap = varargin{i+1};case 'normalize'normalization = varargin{i+1};case 'logscale'logscale = varargin{i+1};case 'logfactor'logfactor = varargin{i+1};case 'freqs'circles = varargin{i+1};circlesUser = true;otherwisewarning([varargin{i} ' is not a valid property for WindRose function.']);end
endif logscale && logfactor<=1error('logfactor must be greater than 1');
endif (LegendType==1) && (isequal(lower(colorbarpos),'northeast') || isequal(lower(colorbarpos),'northwest') || isequal(lower(colorbarpos),'southeast') || isequal(lower(colorbarpos),'southwest'))colorbarpos = colorbarpos(1:5);warning(['LegendType = 1 only accepts colorbarpos = north, east, south, west. Assuming colorbarpos = ' colorbarpos]);
end
if (LegendType==1) && ~contains(lower(colorbarpos),'outside')colorbarpos = [colorbarpos 'outside'];
endif ~exist('frequencyFontName','var'); frequencyFontName = textfontname; end
if ~exist('axisFontName','var'); axisFontName = textfontname; end
if ~exist('legendfontname','var'); legendfontname = textfontname; end
if ~exist('titlefontname','var'); titlefontname = textfontname; endif ~exist('frequencyFontColor','var'); frequencyFontColor = TextColor; end
if ~exist('axisFontColor','var'); axisFontColor = TextColor; end
if ~exist('TitleColor','var'); TitleColor = TextColor; end
if ~exist('LegendColor','var'); LegendColor = TextColor; endif ~exist('LegendBarColor','var'); LegendBarColor = LegendColor; end
if ~exist('legendbarfontsize','var'); legendbarfontsize = legendfontsize; end
if ~exist('legendbarfontname','var'); legendbarfontname = legendfontname; end
if ~exist('legendbarfontweight','var'); legendbarfontweight = legendfontweight; end
if ~exist('legendbarfontangle','var'); legendbarfontangle = legendfontangle; endCenterLocation.X = X;
CenterLocation.Y = Y;
CenterLocation.S = XYposition_set;if ~isempty(vwinds)vwinds = unique(reshape(vwinds(:),1,[])); % ?? Should have used vwinds = unique([0 reshape(vwinds(:),1,[])]); to ensure that values in the interval [0 vmin) appear. If user want hat range to appear, 0 must be included.NSpeeds = length(vwinds);
endif ~isempty(colors)if ~isequal(size(colors),[NSpeeds 3])error('colors must be a nspeeds by 3 matrix');endif any(colors(:)>1) || any(colors(:)<0)error('colors must be in the range 0-1');end
endif inversecolorfun = regexprep(['inv_' colorfun],'inv_inv','');if colorfun(1)=='_'; colorfun = colorfun(2:end); end % REMOVE IN FUTURE: when definetly removing the option of using "invCmap" instead of "inv_Cmap", remove this line and change the previous line from 'inv_inv' to 'inv_inv_'colors = flipud(colors);
endspeed = reshape(speed,[],1); % Convert wind speed into a column vector
direction = reshape(direction,[],1); % Convert wind direction into a column vector
NumberElements = numel(direction); % Coun the actual number of elements, to consider winds = 0 when calculating frequency.
dir = mod((RefN-direction)/(RefN-RefE)*90,360); % Ensure that the direction is between 0 and 360º
if ~considerZeroAndNegativedir = dir(speed>0); % Wind = 0 does not have direction, so it cannot appear in a wind rose, but the number of appeareances must be considered.speed = speed(speed>0); % Only show winds higher than 0. ¿Why? See comment before.
endif ~analysisif ~CenterLocation.Sif isempty(axs) % If no axes were specified, create a new figurefigure_handle = figure('color',figcolor,'units','pixels','position',[SCS(3)/2-width/2 SCS(4)/2-height/2 width height],'menubar',MenuBar,'toolbar',ToolBar);else % If axes are specified, use the figure in which the axes are locatedfigure_handle = get(axs,'parent');if ~figcolorspecif; try figcolor = get(figure_handle,'color'); catch; figcolor = get(get(figure_handle,'parent'),'color'); end; endendelsefigure_handle = get(gca,'parent');end
elsefigure_handle = [];
end%% Bin Directions
N = linspace(0,360,ndirections+1); % Create ndirections direction intervals (ndirections+1 edges)
N = N(1:end-1); % N is the angles in which direction bins are centered. We do not want the 360 to appear, because 0 is already appearing.
n = 180/ndirections; % Angle that should be put backward and forward to create the angular bin, 1st centered in 0
if ~CeteredIn0 % If user does not want the 1st bin to be centered in 0ºN = N+n; % Bin goes from 0 to 2n (N to N+2n), instead of from -n to n (N-n to N+n), so Bin is not centered in 0 (N) angle, but in the n (N+n) angle
end%% Bin intensities
if isempty(vwinds) % If user did not specify the wind speeds he/she wants to showif ~isempty(WindSpeedRound) % If user did specify the rounding valueif isempty(NSpeeds); NSpeeds = 6; end % Default value for NSpeeds if not user-specifiedvmax = ceil(max(speed)/WindSpeedRound)*WindSpeedRound; % Max wind speed rounded to the nearest whole multiple of WindSpeedRound (Use round or ceil as desired)if vmax==0; vmax=WindSpeedRound; end % If max wind speed is 0, make max wind to be WindSpeedRound, so wind speed bins are correctly shown.vwinds = linspace(0,vmax,NSpeeds); % Wind speeds go from 0 to vmax, creating the desired number of wind speed intervalselse % If user did nor specify the rounding valuefigure2 = figure('visible','off'); plot(speed); % Plot wind speedvwinds = get(gca,'ytick'); delete(figure2); % Yaxis will automatically make divisions for us.vwinds = vwinds(1:max(1,length(vwinds)-1)); % ADDED 2023/01/24 - Remove the last speed value, so it appears in the >X binif ~isempty(NSpeeds) % If a number of speeds are specifiedvwinds = linspace(min(vwinds),max(vwinds),NSpeeds); % create a vector with that number of elements, distributed along the plotted windspeeds. end end
end%% Histogram in each direction + Draw
count = PivotTableCount(N,n,vwinds,speed,dir,NumberElements); % For each direction and for each speed, value of the radius that the windorose must reach (Accumulated in speed).
count2 = count;if isempty(FrequenciesRound)figure2 = figure('visible','off'); plot(count(:)); % Plot countFrequenciesRound = mean(diff(get(gca,'ytick'))); delete(figure2); % Yaxis will automatically make divisions for us.
endif normalizationcount = count./repmat(count(:,end),1,size(count,2)); % This is for normalizing frequencies, but the frequency labels should be shown for every direction.
endif isequal(lower(FreqLabelAngle),'auto')[~,idxmin] = min(count(:,end)); % Find the direction with the least number of elementsDirFreqAuto = N(idxmin); % The angle at which the lowest cumulative frequency appearsFreqLabelAngle = 90-DirFreqAuto; % Convert from the patch drawing reference (x=sin(alpha), y=cos(alpha)) to the label drawing reference (x=cos(theta), y=sin(theta)) => theta = 90-alpha
endif isequal(lower(FreqLabelAngle),'none') % If the freqlabelangle is set to noneFreqLabelAngle = NaN; % Set the angle to be nan, so frequencies do not appear.
endruler = false;
if isequal(lower(FreqLabelAngle),'ruler') || isequal(lower(FreqLabelAngle),'rulerright') % If the freqlabelangle is set to ruler or rulerrightruler = 'right'; % Set the type of rulerFreqLabelAngle = []; % Set the angle to be empty, so frequencies do not appear.
end
if isequal(lower(FreqLabelAngle),'rulerleft') % If the freqlabelangle is set to ruler or rulerrightruler = 'left'; % Set the type of rulerFreqLabelAngle = []; % Set the angle to be empty, so frequencies do not appear.
endif isempty(circlemax) % If no max frequency is specifiedcirclemax = ceil(max(max(count))/FrequenciesRound)*FrequenciesRound; % Round highest frequency to closest whole multiple of theFrequenciesRound (Use round or ceil as desired)
endif ~circlesUser % If user did not set the frequencies values manuallycircles = linspace(0,circlemax,NFrequencies+1); circles = circles(2:end);% Radii of the circles that must be drawn (frequencies). We do not want to spend time drawing radius=0.
elsecircles = circles(circles>0); % Otherwise, use the user defined frequency circles (omit 0 because we do not want to spend time drawing radius 0circlemax1 = circlemax;circlemax = max(circlemax1,max(circles));if circlemax>circlemax1if (maxfrequencyUser)warning('Maximum frequency has been overridden by the user-defined frequencies.');endelsecircles = [circles circlemax1];warning('User-defined frequencies have been extended to include the maximum frequency.');end
end
min_radius = min_radius*circlemax; % The minimum radius is initially specified as a fraction of the circle max, convert it to absolute units.radiusmax = circlemax + min_radius;
escala = scalefactor/radiusmax;if logscale % If we want logscaleescalado = @(x) (log(1 + (logfactor - 1)*(x/escala-min_radius)/(radiusmax-min_radius))/log(logfactor))*(radiusmax-min_radius)*escala+min_radius*escala; % Define a parameterized transformation function where min_radius=min_radius and radiusmax=radiusmax, but logarithmic in between, instead of linearif ~NFrequenciesUser && ~circlesUser % If the user did not set the number or the value of frequencies manuallyz = round(log(logfactor)/log(10)); % Determine the non-linearity of the parameter. If it is very non-linear, we might want to add Frequencies circles to be shown in the graphf = (1/2).^(z:-1:1); % In case of high non-linearity, we will add more and more halves of the first frequencycircles = [circles(1)*f circles]; % Add the NFrequencies = NFrequencies+z; % Set the new number of frequenciesend
else % If no logscale is requiredescalado = @(x) x; % The transformation function is f(x) = x;
end
radius = circles + min_radius; % for each circle, add the minimum radiusOthers.MaxFrequency = circlemax;
Others.nFrequencies = NFrequencies;
Others.freqs = circles;isaxisempty = isempty(axs); % isaxisempty will allow us to identify whether the axes where specified or not, because we are going to assign in the next line a value, so axs will be never again empty.axisangles = 0:360/Ngridradius:360; axisangles = axisangles(1:end-1)+90; % Angles in which to draw the radial axis (trigonometric reference)
R = [min_radius;radiusmax]; % radiusif ~analysis[color,axs,PTCH] = DrawPatches(N,n,vwinds,count,colorfun,figcolor,min_radius,colors,inverse,axs,colormap_set,escala,CenterLocation,LineWidth,EdgeColorModified,EdgeColor,gap,EdgeAlpha,FaceAlpha,escalado); % Draw the windrose, knowing the angles, the range for each direction, the speed ranges, the count (frequency) values, the colormap used and the colors used.if ~CenterLocation.Saxis off; % turn axis off if axis was not definedendaxis equal; % equal axisif isaxisempty; set(axs,'position',[0 0 1 1]); end % If no axes were specified, set the axes position to fill the whole figure.%% Constant frequecy circles and x-y axes + Draw + Labels[x,y] = cylinder(1,400); x = x(1,:); y = y(1,:); % Get x and y for a unit-radius circleif ~isaxisempty % If axis are specified (not empty)h=fill(0*x'*radiusmax*escala,0*y'*radiusmax*escala,figcolor); % create a background circlehAnnotation = get(h,'Annotation'); % get annotation from the circlehLegendEntry = get(hAnnotation','LegendInformation'); % get legend information from the circleset(hLegendEntry,'IconDisplayStyle','off') % remove the cricle from the legened information.uistack(h,'bottom'); % the circle must be placed below everything.endp1 = plot(axs,x'*escalado(radius(1:end-1)*escala)+CenterLocation.X,y'*escalado(radius(1:end-1)*escala)+CenterLocation.Y,CircularGridStyle,'color',CircularGridColor,'linewidth',CircularGridWidth); % Draw dotted circle linesplot(axs,x*min_radius*escala+CenterLocation.X,y*min_radius*escala+CenterLocation.Y,'-','color',CircularGridColor,'linewidth',CircularGridWidth); % Redraw first circle line in solid styleplot(axs,x*radiusmax*escala+CenterLocation.X,y*radiusmax*escala+CenterLocation.Y,'-','color',CircularGridColor,'linewidth',CircularGridWidth); % Redraw last circle line in solid stylep2 = plot(axs,escalado(R*escala)*cosd(axisangles)+CenterLocation.X,escalado(R*escala)*sind(axisangles)+CenterLocation.Y,RadialGridStyle,'color',RadialGridColor,'linewidth',RadialGridWidth); % Draw radial axis, in the specified anglesif hg2_supportfor i=1:length(p1)p1(i).Color(4) = CircularGridAlpha;endfor i=1:length(p2)p2(i).Color(4) = RadialGridAlpha;endendif normalizationFrequencyLabelsNormalize(count2,90-N,radius,escala,CenterLocation,frequencyFontSize,frequencyFontName,frequencyFontWeight,frequencyFontColor,frequencyFontAngle);elseFrequencyLabels(circles,radius,FreqLabelAngle,escala,CenterLocation,min_radius,frequencyFontSize,frequencyFontName,frequencyFontWeight,frequencyFontColor,frequencyFontAngle,escalado); % Display frequency labelsendCardinalLabels(radiusmax,label,lots_of_labels,escala,CenterLocation,axisFontSize,axisFontName,axisFontWeight,axisFontColor,axisFontAngle) % Display N, S, E, W if ~CenterLocation.Sxlim(axs,[-1 1]); % Set limits with the scale factorylim(axs,[-1 1]);end%% Title and Legendif ischar(TitleString)TitleString = {TitleString;' ';' '};elseif iscell(TitleString)TitleString = [TitleString; repmat({' ';' '},1,size(TitleString,2))];endtitle(TitleString,'color',TitleColor,'fontweight',titlefontweight,'fontname',titlefontname,'fontsize',titlefontsize,'fontangle',titlefontangle); % Display a titleif isaxisempty; set(axs,'outerposition',[0 0 1 1]); end % Check that the current axis fills the figure, only if axis were not specifiedif LegendType==2 % If legend type is box:leyenda = CreateLegend(vwinds,lablegend,legendvariable,inverse); % Create a legend cell stringl = legend(axs,leyenda,'location',legendpos,'orientation',legendori); % Display the legend wherever (position is corrected)if isaxisempty % If axis were not specifiedPrettyLegend(l,LegendColor,legendfontname,legendpos,legendori,legendfontsize,legendfontweight,legendfontangle); % Display the legend in the desired positionelse % If axis were specifiedset(l,'textcolor',LegendColor,'color',figcolor,'fontname',legendfontname,'fontsize',legendfontsize,'fontweight',legendfontweight,'fontangle',legendfontangle); % change only the legend colour (text and background)endelseif LegendType==1 % If legend type is colorbarif exist('clim','builtin') || exist('clim','file')clim(axs,[vwinds(1) vwinds(end)]); % Set colorbar limitselsecaxis(axs,[vwinds(1) vwinds(end)]); % Set colorbar limitsendcolormap(axs,interp1(vwinds,color,linspace(min(vwinds),max(vwinds),256))); % set colorbar colours (colormap)c = colorbar('YTick',vwinds,'fontname',legendfontname,'location',colorbarpos); % The values shown in the colorbar are the intenisites.if isempty(lablegend); lablegend = ''; end % Ensure a string is availableset(c,'color',LegendBarColor,'fontsize',legendbarfontsize,'fontname',legendbarfontname,'fontweight',legendbarfontweight,'fontangle',legendbarfontangle);set(get(c,'label'),'string',lablegend,'color',LegendColor,'fontsize',legendfontsize,'fontname',legendfontname,'fontweight',legendfontweight,'fontangle',legendfontangle); % Set the variable in the colorbarend%% Create Ruler% TODO: change text angle?if ruler~=falseif isequal(ruler,'left')K = -1;elseK = 1;endcircle_lab = [0 circles];circle_pos = escalado([min_radius*escala radius*escala]);hidelegend = @(h) set(get(get(h,'Annotation')','LegendInformation'),'IconDisplayStyle','off'); % function to hide a handle from the legendp = plot(K*[min(circle_pos) max(circle_pos)],[0 0],'k');hidelegend(p);for i=1:length(circle_lab)p = plot(K*circle_pos(i)*[1 1],[0 0.05]*max(circle_pos),'-k');hidelegend(p);if i>1p = plot(K*mean(circle_pos(i-1:i))*[1 1],[0 0.025]*max(circle_pos),'-k');hidelegend(p); endtext(K*circle_pos(i),0.05*max(circle_pos),[num2str(circle_lab(i)) '%'],'horizontalalignment','center','verticalalignment','bottom','fontname',frequencyFontName,'fontsize',frequencyFontSize,'fontweight',frequencyFontWeight,'fontangle',frequencyFontAngle,'color',frequencyFontColor,'rotation',0);endend%% Bring patches to top if requestedif ~plotinbackuistack(PTCH(:)','top');end
end%% Outputs
[count,speeds,directions,Table] = CreateOutputs(count2,vwinds,N,n,RefN,RefE); % Create output arrays and tables.
endfunction count = PivotTableCount(N,n,vwinds,speed,dir,NumberElements)count = zeros(length(N),length(vwinds));for i=1:length(N)d1 = mod(N(i)-n,360); % Direction 1 is N-nd2 = N(i)+n; % Direction 2 is N+nif d1>d2 % If direction 1 is greater than direction 2 of the bin (d1 = -5 = 355, d2 = 5)cond = or(dir>=d1,dir<d2); % The condition is satisfied whenever d>=d1 or d<d2else % For the rest of the cases,cond = and(dir>=d1,dir<d2); % Both conditions must be met for the same binend
% counter = histc(speed(cond),vwinds); % REMOVED 2015/Jun/22 % If vmax was for instance 25, counter will have counts for these intervals: [>=0 y <5] [>=5 y <10] [>=10 y <15] [>=15 y <20] [>=20 y <25] [>=25]
% counter = histc(speed(cond),[vwinds(:)' inf]); % REMOVED 2023/Feb/06 % ADDED 2015/Jun/22: Consider the wind speeds greater than max(vwinds), by adding inf into the histogram count
% counter = counter(1:length(vwinds)); % REMOVED 2023/Feb/06 % ADDED 2015/Jun/22: Crop the resulting vector form histc, so as it has only length(Vwinds) elementscounter = arrayfun(@(y,z) sum((speed(cond)>=y)&(speed(cond)<z)),vwinds,[vwinds(2:end) inf]); % ADDED 2023/Feb/06: Count without using histc (which is not recommended since the introduction of histcounts) or histcounts (which is only available in R014a+)if isempty(counter); counter = zeros(1,size(count,2)); end % If counter is empty for any reason, set the counts to 0.count(i,:) = cumsum(counter); % Computing cumsum will make count to have the counts for [<5] [<10] [<15] [<20] [<25] [>=25] (cumulative count, so we have the radius for each speed)endcount = count/NumberElements*100; % Frequency in percentage
endfunction [color,axs,PTCH] = DrawPatches(N,n,vwinds,count,colorfun,figcolor,min_radius,colors,inverse,axs,colormap_set,escala,CenterLocation,LineWidth,EdgeColorModified,EdgeColor,gap,EdgeAlpha,FaceAlpha,escalado)if isempty(axs)
% plot(0+CenterLocation.X,0+CenterLocation.Y,'.','color',figcolor,'markeredgecolor',figcolor,'markerfacecolor',figcolor); % This will create an empty legend entry.patch(([0 1 1 0]-0.5)/1000*escala+CenterLocation.X,([0 0 1 1]-0.5)/1000*escala+CenterLocation.Y,figcolor,'facealpha',0,'edgecolor','none');axs = gca;else
% plot(axs,0+CenterLocation.X,0+CenterLocation.Y,'.','color',figcolor,'markeredgecolor',figcolor,'markerfacecolor',figcolor); % This will create an empty legend entry.patch(axs,([0 1 1 0]-0.5)/1000*escala+CenterLocation.X,([0 0 1 1]-0.5)/1000*escala+CenterLocation.Y,figcolor,'facealpha',0,'edgecolor','none');endset(gcf,'currentaxes',axs);hold on; %axis square; axis off;if isempty(colors)if ~colormap_setshowwarning = false; % REMOVE IN FUTURE: variable to determine if show warning when colormap starts with inv, but not with inv_if length(colorfun)>3 && strcmp(colorfun(1:3),'inv') && ~strcmp(colorfun(4),'_') % REMOVE IN FUTURE: determine if colormap name starts with inv but not with inv_showwarning = true; % REMOVE IN FUTURE: show inv warningcolorfun = ['inv_' colorfun(4:end)]; % REMOVE IN FUTURE: colormap name is changed from invcmap to inv_cmapendif length(colorfun)>4 % Check that colorfun more than 3 characters inv = strcmp(colorfun(1:4),'inv_'); % INV = First three letters in cmap are invelseinv = false; % If it does not have more than 3 characters, it is not a inverted colormapendif invcolorfun = colorfun(5:end); % if INV, cmap is the rest, excluding inv_colorfun2 = ['inv' colorfun]; % REMOVE IN FUTURE: Save the full colormap name in case it actually started with invend trycolor = feval(colorfun,256); % Create color mapcatch % REMOVE IN FUTURE THIS CATCH block: if function call breaks, it actually began with inv, so no correction was neededtrycolor = feval(colorfun2,256); % REMOVE IN FUTURE: If creating the colormap fails, probably removing inv was not correctinv = false; % REMOVE IN FUTURE: It was not inverted colormap, but the name of the colormap actually started with invshowwarning = false; % REMOVE IN FUTURE: Do not show the warning, because it was not an errorcatch % This catch can be kept, because it retruns an error if colorfun is not found. error(['The colormap function ' colorfun2 ' was not find or could not be used. Please, check the available colormaps by writing "doc colormap" in the command prompt']); % In the future, when removing the "inv instead of inv_", change colorfun2 with colorfunendendif showwarning % REMOVE IN FUTURE THIS IF BLOCK: "inv" instead of "inv_" should not be used anymorewarning(['The "inv" preffix for colormaps is being subsituted by "inv_" (with an underscore) to prevent failures with colormaps actually starting with "inv".' newline 'Please, change your colormap "inv" preffix with "inv_", since this will be compulsory in future relases.' newline newline]);endcolor = interp1(linspace(1,length(vwinds),256),color,1:length(vwinds));% Get the needed values.if inv; color = flipud(color); end % if INV, flip upside down the colormapelsecolor = interp1(1:size(colorfun,1), colorfun, linspace(1,size(colorfun,1),length(vwinds)), 'linear');endelseif size(colors,1)~=length(vwinds)waring('''colors'' must have the same number of colors as wind speeds present in the windrose. Interpreting the ''colors'' input as ''colormap''');color = interp1(1:size(colors,1), colors, linspace(1,size(colors,1),length(vwinds)), 'linear');elsecolor = colors;endendif inverse % If wind speeds are shown in inverse way (slowest is outside)count = [count(:,1) diff(count,1,2)]; % De-compose cumsumcount = cumsum(fliplr(count),2); % Cumsum inverting count.endmessagealpha_appeared = false;PTCH = zeros(length(N),length(vwinds));for i=1:length(N) % For every anglefor j=length(vwinds):-1:1 % For every wind speed range (last to first)if j>1 % If the wind speed range is not the firstr(1) = count(i,j-1); % the lower radius of this bin is the upper radius of the one with lower speedselse % If the wind speed range is the firstr(1) = 0; % the lower radius is 0endr(2) = count(i,j); % The upper radius is the cumulative count for this angle and this speed ranger = r+min_radius; % We have to sum the minimum radius.r = escalado(r*escala);nstar = n*(1-min(1,max(0,gap))); % If we want to leave a gap/spacing between the arms/patches/sectors, we have to reduce its angular spawnalpha = linspace(-nstar,nstar,100)+N(i); % these are the angles for which the bins are plottedx1 = r(1) * sind(fliplr(alpha)); % convert 1 radius and 100 angles into a line, xy1 = r(1) * cosd(fliplr(alpha)); % and yx = [x1 r(2)*sind(alpha)]; % Create circular sectors, completing x1 and y1 with the upper radius.y = [y1 r(2)*cosd(alpha)];if ~EdgeColorModified || isequal(lower(EdgeColor),'normal'); EdgeCol = hsv2rgb(rgb2hsv(color(j,:)).*[1 1 0.7]); else; EdgeCol = EdgeColor; endtryPTCH(i,j) = fill(x+CenterLocation.X,y+CenterLocation.Y,color(j,:),'edgecolor',EdgeCol,'linewidth',LineWidth,'edgealpha',EdgeAlpha,'facealpha',FaceAlpha); % Draw them in the specified color. catch excif ~messagealpha_appeared; warning('Alpha Properties might not be admitted in this version:\n%s: %s', exc.identifier, exc.message); messagealpha_appeared=true; endPTCH(i,j) = fill(x+CenterLocation.X,y+CenterLocation.Y,color(j,:),'edgecolor',EdgeCol,'linewidth',LineWidth); % Same but with no alpha properties for those Matlab versions that do not support alpha.endendend
endfunction FrequencyLabelsNormalize(count2,N,radius,escala,CenterLocation,frequencyFontSize,frequencyFontName,frequencyFontWeight,frequencyFontColor,frequencyFontAngle)for j=1:length(N) s = sind(N(j)); c = cosd(N(j)); % Get the positions in which labels must be placedif c>0; ha = 'left'; elseif c<0; ha = 'right'; else; ha = 'center'; end % Depending on the sign of the cosine, horizontal alignment should be one or anotherif s>0; va = 'bottom'; elseif s<0; va = 'top'; else; va = 'middle'; end % Depending on the sign of the sine , vertical alignment should be one or anothertext(radius(end)*c*escala+CenterLocation.X,radius(end)*s*escala+CenterLocation.Y,[num2str(count2(j,end)) '%'],'HorizontalAlignment',ha,'verticalalignment',va,'fontsize',frequencyFontSize,'fontname',frequencyFontName,'fontsize',frequencyFontSize,'fontweight',frequencyFontWeight,'fontangle',frequencyFontAngle,'color',frequencyFontColor); % display the labels for each circleend
endfunction FrequencyLabels(circles,radius,angulo,escala,CenterLocation,rmin,frequencyFontSize,frequencyFontName,frequencyFontWeight,frequencyFontColor,frequencyFontAngle,escalado)s = sind(angulo); c = cosd(angulo); % Get the positions in which labels must be placedif c>0; ha = 'left'; elseif c<0; ha = 'right'; else; ha = 'center'; end % Depending on the sign of the cosine, horizontal alignment should be one or anotherif s>0; va = 'bottom'; elseif s<0; va = 'top'; else; va = 'middle'; end % Depending on the sign of the sine , vertical alignment should be one or anotherfor i=1:length(circles)text(c*escalado(radius(i)*escala)+CenterLocation.X,s*escalado(radius(i)*escala)+CenterLocation.Y,[num2str(circles(i)) '%'],'HorizontalAlignment',ha,'verticalalignment',va,'fontsize',frequencyFontSize,'fontname',frequencyFontName,'fontsize',frequencyFontSize,'fontweight',frequencyFontWeight,'fontangle',frequencyFontAngle,'color',frequencyFontColor); % display the labels for each circleend
% if length(radius)>1
% rmin = radius(1)-abs(diff(radius(1:2)));if rmin>0if c>0; ha = 'right'; elseif c<0; ha = 'left'; else; ha = 'center'; end % Depending on the sign of the cosine, horizontal alignment should be one or anotherif s>0; va = 'top'; elseif s<0; va = 'bottom'; else; va = 'middle'; end % Depending on the sign of the sine , vertical alignment should be one or anothertext(c*escalado(rmin*escala)+CenterLocation.X,s*escalado(rmin*escala)+CenterLocation.Y,'0%','HorizontalAlignment',ha,'verticalalignment',va,'fontsize',frequencyFontSize,'fontname',frequencyFontName,'fontsize',frequencyFontSize,'fontweight',frequencyFontWeight,'fontangle',frequencyFontAngle,'color',frequencyFontColor); % display the labels for each circleend
% end
endfunction CardinalLabels(circlemax,labels,lots_of_labels,escala,CenterLocation,axisFontSize,axisFontName,axisFontWeight,axisFontColor,axisFontAngle)if ~lots_of_labels && isstruct(labels)text( circlemax*escala+CenterLocation.X,0+CenterLocation.Y,[' ' labels.E],'HorizontalAlignment','left' ,'verticalalignment','middle','fontsize',axisFontSize,'fontname',axisFontName,'fontweight',axisFontWeight,'color',axisFontColor,'fontangle',axisFontAngle); % East labeltext(-circlemax*escala+CenterLocation.X,0+CenterLocation.Y,[labels.W ' '],'HorizontalAlignment','right' ,'verticalalignment','middle','fontsize',axisFontSize,'fontname',axisFontName,'fontweight',axisFontWeight,'color',axisFontColor,'fontangle',axisFontAngle); % West labeltext(0+CenterLocation.X, circlemax*escala+CenterLocation.Y,[labels.N newline],'HorizontalAlignment','center','verticalalignment','bottom','fontsize',axisFontSize,'fontname',axisFontName,'fontweight',axisFontWeight,'color',axisFontColor,'fontangle',axisFontAngle); % North labeltext(0+CenterLocation.X,-circlemax*escala+CenterLocation.Y,[newline labels.S],'HorizontalAlignment','center','verticalalignment','top' ,'fontsize',axisFontSize,'fontname',axisFontName,'fontweight',axisFontWeight,'color',axisFontColor,'fontangle',axisFontAngle); % South labelelse % If lots of labeangles = linspace(0,2*pi,length(labels)+1); % Divide the circle in n+1 partsangles = angles(1:end-1); % Select only n parts (n+1 is the same as 1)for i=1:length(angles)minval = 1e-5;x = sin(angles(i));y = cos(angles(i));if x>minval % If x is to the right, text must be aligned to the left.ha = 'left';label = [' ' labels{i}];elseif x<-minval % If x is to the left, text must be aligned to the right.ha = 'right';label = [labels{i} ' '];else % if x is 0, text must be ha = 'center';label = labels{i};endif y>minvalva = 'bottom';label = [labels{i} newline];elseif y<-minvalva = 'top';label = [newline labels{i}];elseva = 'middle';endtext(abs(circlemax)*x*escala+CenterLocation.X,abs(circlemax)*y*escala+CenterLocation.Y,label,'horizontalalignment',ha,'verticalalignment',va,'fontsize',axisFontSize,'fontname',axisFontName,'fontweight',axisFontWeight,'color',axisFontColor,'fontangle',axisFontAngle);endend
endfunction leyenda = CreateLegend(vwinds,lablegend,legendvariable,inverse)leyenda = cell(length(vwinds),1); % Initialize legend cell arraycont = 0; % Initialize Counterif inverse % If wind speed order must bu shown in inverse orderorden = length(vwinds):-1:1; % Set order backwardselse % Elseorden = 1:length(vwinds); % Set normal order (cont will be equal to j).endfor j=orden % Cross the speeds in the specified directioncont = cont+1; % Increase counterif j==length(vwinds) % When last index is reachedstring = sprintf('%s %s %g',legendvariable,'\geq',vwinds(j)); % Display wind <= max windelse % For the rest of the indicesstring = sprintf('%g %s %s < %g',vwinds(j),'\leq',legendvariable,vwinds(j+1)); % Set v1 <= v2 < v1endstring = regexprep(string,'0 \leq','0 <'); % Replace "0 <=" by "0 <", because wind speed = 0 is not displayed in the graph.leyenda{length(vwinds)-cont+1} = string;endif isempty(lablegend); lablegend = ' '; end % Ensure that lablegend is not empty, so windspeeds appear in the right position.leyenda = [lablegend; leyenda]; % Add the title for the legend
endfunction PrettyLegend(l,TextColor,legendfontname,legendpos,legendori,legendfontsize,legendfontweight,legendfontangle)set(l,'units','normalized','box','off','orientation',legendori); % Do not display the boxset(l,'textcolor',TextColor,'fontname',legendfontname,'fontsize',legendfontsize,'fontweight',legendfontweight,'fontangle',legendfontangle);uistack(l,'bottom'); % Put the legend below the axisPOS = get(l,'position'); % get legend position (width and height)drawnow;p = [];if isequal(lower(legendpos),'northwest')p = [0 1-POS(4) POS(3) POS(4)]; % Put the legend in the upper left cornerelseif isequal(lower(legendpos),'northeast')p = [1-POS(3) 1-POS(4) POS(3) POS(4)]; % Put the legend in the upper left cornerelseif isequal(lower(legendpos),'southwest')p = [0 0 POS(3) POS(4)]; % Put the legend in the upper left cornerelseif isequal(lower(legendpos),'southeast')p = [1-POS(3) 0 POS(3) POS(4)]; % Put the legend in the upper left cornerelseif isequal(lower(legendpos),'east')p = [1-POS(3) (1-POS(4))/2 POS(3) POS(4)]; % Put the legend in the upper left cornerelseif isequal(lower(legendpos),'north')p = [(1-POS(3))/2 1-POS(4) POS(3) POS(4)]; % Put the legend in the upper left cornerelseif isequal(lower(legendpos),'west')p = [0 (1-POS(4))/2 POS(3) POS(4)]; % Put the legend in the upper left cornerelseif isequal(lower(legendpos),'south')p = [(1-POS(3))/2 0 POS(3) POS(4)]; % Put the legend in the upper left cornerendif ~isempty(p)tryset(l,'location','none','position',p,'autoupdate','on');catchset(l,'location','none','position',p);endend
endfunction [count,speeds,directions,Table] = CreateOutputs(count,vwinds,N,n,RefN,RefE)count = [count(:,1) diff(count,1,2)]; % Count had the accumulated frequencies. With this line, we get the frequency for each single direction and each single speed with no accumulation.speeds = vwinds; % Speeds are the same as the ones used in the Wind Rose Graphdirections = mod(RefN - N'/90*(RefN-RefE),360); % Directions are the directions in which the sector is centered. Convert function reference to user referencevwinds(end+1) = inf; % Last wind direction is inf (for creating intervals)[directions,i] = sort(directions); % Sort directions in ascending ordercount = count(i,:); % Sort count in the same way.wspeeds = cell(1,length(vwinds)-1);for i=1:(length(vwinds)-1)if vwinds(i) == 0; s1 = '('; else; s1 = '['; end % If vwinds(i) =0 interval is open, because count didn't compute windspeed = 0. Otherwise, the interval is closed [wspeeds{i} = [s1 num2str(vwinds(i)) ' , ' num2str(vwinds(i+1)) ')'];% Create wind speed intervals, open in the right.endwdirs = cell(length(directions),1);for i=1:length(directions)wdirs{i} = sprintf('[%g , %g)',mod(directions(i)-n,360),directions(i)+n); % Create wind direction intervals [a,b)endWindZeroFreqency = 100-sum(sum(count)); % Wind speed = 0 appears 100-sum(total) % of the time. It does not have direction.WindZeroFreqency = WindZeroFreqency*(WindZeroFreqency/100>eps); % If frequency/100% is lower than eps, do not show that value.Table = [{'Frequencies (%)'},{''},{'Wind Speed Interval'},repmat({''},1,numel(wspeeds));'Direction Interval (°)','Avg. Direction',wspeeds,'TOTAL';[wdirs num2cell(directions) num2cell(count) num2cell(sum(count,2))]]; % Create table cell. Ready to xlswrite.Table(end+1,:) = [{'[0 , 360)','TOTAL'},num2cell(sum(count,1)),{sum(sum(count))}]; % the last row is the totalTable(end+1,1:2) = {'No Direction', 'Wind Speed = 0'}; % add an additional row showing Wind Speed = 0 on table.Table{end,end} = WindZeroFreqency; % at the end of the table (last row, last column), show the total number of elements with 0 speed.
enddata.mat数据包(包括direction,speed,X)
通过网盘分享的文件:风玫瑰图等2个文件链接: https://pan.baidu.com/s/1_H88lc188kd6DV3hhRhhWg?pwd=HHRR 提取码: HHRR --来自百度网盘超级会员v5的分享
相关文章:
MATLAB之数据分析图系列 三
三维堆叠柱状图 Bar3StackPlot.m文件 clc; clear; close all; %三维堆叠柱状图 %% 数据准备 % 读取数据 load data.mat % 初始化 dataset X; s 0.4; % 柱子宽度 n size(dataset,3); % 堆叠组数%% 图片尺寸设置(单位:厘米) figureUnits c…...
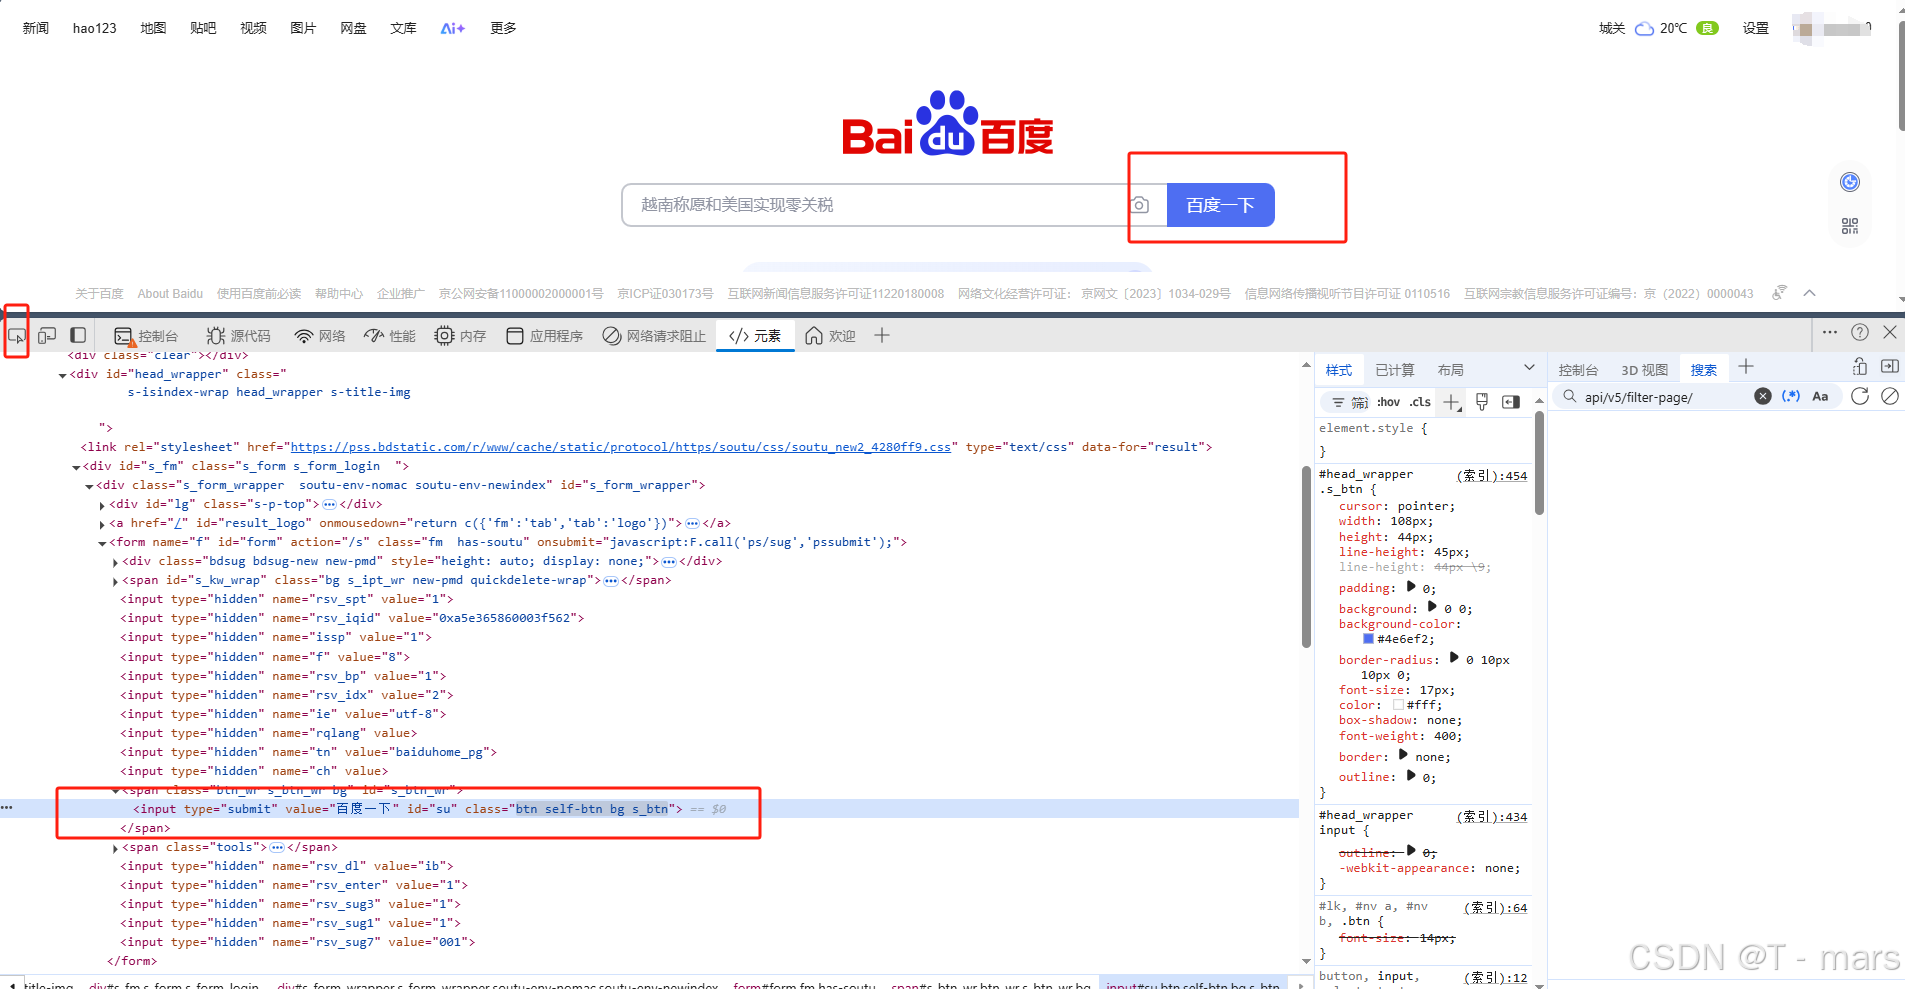
python爬虫:DrissionPage实战教程
如果本文章看不懂可以看看上一篇文章,加强自己的基础:爬虫自动化工具:DrissionPage-CSDN博客 案例解析: 前提:我们以ChromiumPage为主,写代码工具使用Pycharm(python环境3.9-3.10) …...
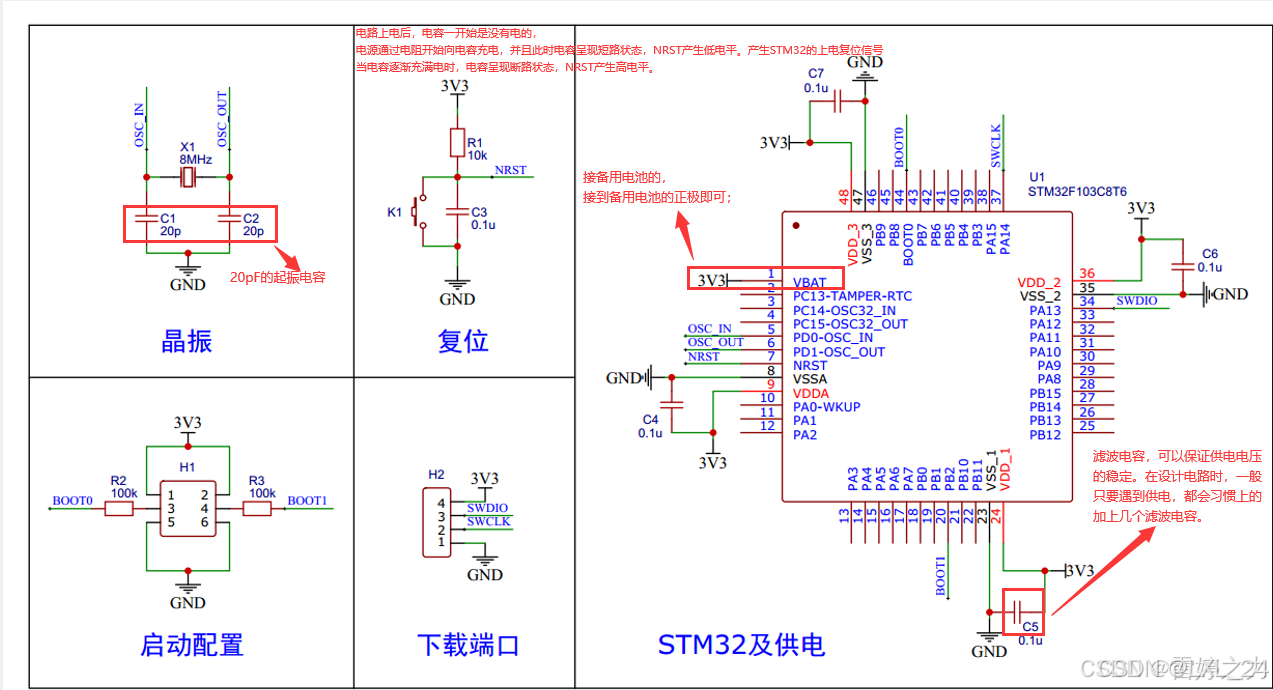
一、STM32简介
一、实验器材介绍 二、STM32简介 1.STM32 名词解释 STM32是ST公司基于ARM Cortex-M内核开发的32位微控制器。 ST,指ST公司(意法半导体);M,MicroController 微控制器(MCU,MicroController Unit 微控制器单元/单片机&…...
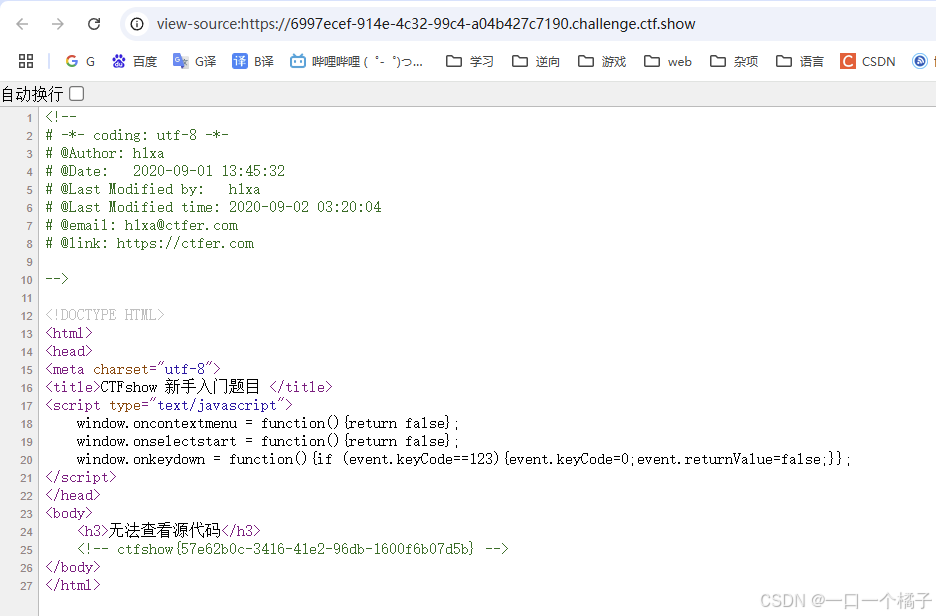
[ctfshow web入门] web2
前置知识 js是可以写在网页中,用于控制网页行为,例如现在表现出无法使用F12,常见用法校验前台登录时输入的邮箱格式是否正确 view-source协议是一种早期就存在的协议,基本上所有主流浏览器都支持这一协议,因此用户…...

torch 拆分子张量 分割张量
目录 unbind拆分子张量 1. 沿着第n个维度拆分(即按“批次”拆分) split分割张量 常用用法: 总结: unbind拆分子张量 import torchquaternions torch.tensor([[1, 2, 3, 4], [5, 6, 7, 8]]) result torch.unbind(quaternio…...
:修改包名)
定制一款国密浏览器(2):修改包名
在上一章中,介绍了 chromium 源码的获取和构建deb 包,这一章将修改包名。 我给定制浏览器取名 Mojo Browser,Mojo 这个词来自 Chromium 代码中的 Mojo 跨进程框架,此外 Mojo 隐含有突破困境的内在动力的意思。 所以接下修改包名为 org.mojo.browser,第二就是修改程序的安…...

使用MATIO库读取Matlab数据文件中的多维数组
使用MATIO库读取Matlab数据文件中的多维数组 MATIO是一个用于读写Matlab数据文件(.mat)的开源C库。下面是一个完整的示例程序,展示如何使用MATIO库读取Matlab数据文件中的多维数组。 示例程序 #include <stdio.h> #include <stdlib.h> #include <…...
MySQL主从同步原理深度剖析)
MySQL篇(五)MySQL主从同步原理深度剖析
MySQL篇(五)MySQL主从同步原理深度剖析 MySQL篇(五)MySQL主从同步原理深度剖析一、引言二、MySQL主从同步基础概念主库(Master)从库(Slave)二进制日志(Binary Log&#x…...

PyQt5和OpenCV车牌识别系统
有需要请加文章底部Q哦 可远程调试 PyQt5和OpenCV车牌识别系统 一 介绍 此车牌识别系统基于PyQt5和OpenCV开发,蓝牌,新能源(绿牌),黄牌,白牌均可以准确识别,支持中文识别,可以导出识别结果(Excel格式)。此…...
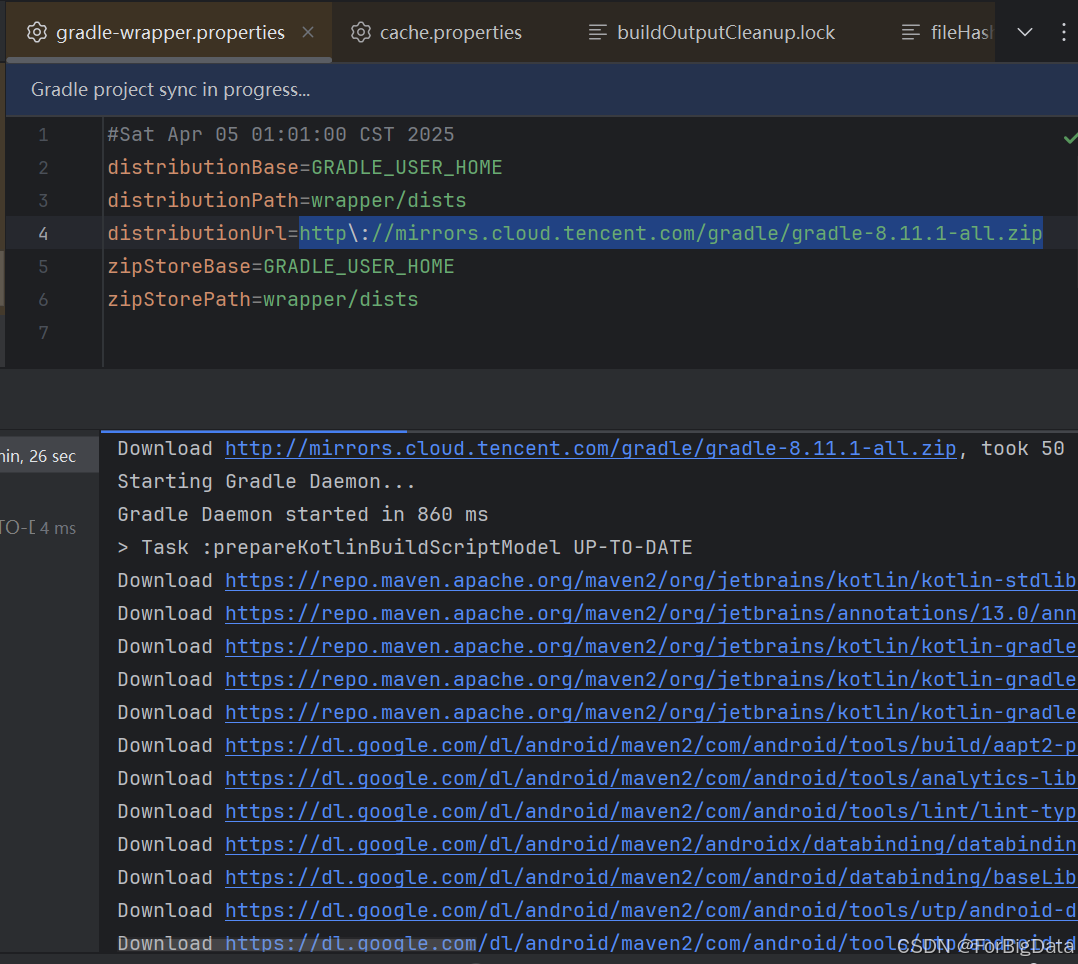
【Android Studio 下载 Gradle 失败】
路虽远行则将至,事虽难做则必成 一、事故现场 下载Gradle下载不下来,没有Gradle就无法把项目编译为Android应用。 二、问题分析 观察发现下载时长三分钟,进度条半天没动,说明这个是国外的东西,被墙住了,需…...

Xshell Plus 6下载与安装
文章目录 Xshell Plus 6 简介(一)网络连接与协议支持(二)会话管理(三)安全特性(四)文件传输功能(因集成Xftp 6 )(五)个性化与便捷功能…...

格式工厂怎样插入内置音频文件
打开格式工厂,在打开的页面选择 “视频” 选项;在视频选项里点击 “混流”;在混流页面右侧点击 “添加文件”,分别添加上视频文件和要插入的内置音频文件;在 “输出设置” 的下拉菜单里,分别选好要输出的视…...

CNN 里面能自然起到防止过拟合的办法
在 CNN(卷积神经网络)中,其实有 一些结构和机制 天然就具有防止过拟合(overfitting)的作用,不完全依赖额外的正则化手段。 🧠 一、CNN 天然防过拟合的几个原因: 1️⃣ 局部连接&…...
九、重学C++—类和函数
上一章节: 八、重学C—动态多态(运行期)-CSDN博客https://blog.csdn.net/weixin_36323170/article/details/147004745?spm1001.2014.3001.5502 本章节代码: cpp/cppClassAndFunc.cpp CuiQingCheng/cppstudy - 码云 - 开源中国…...
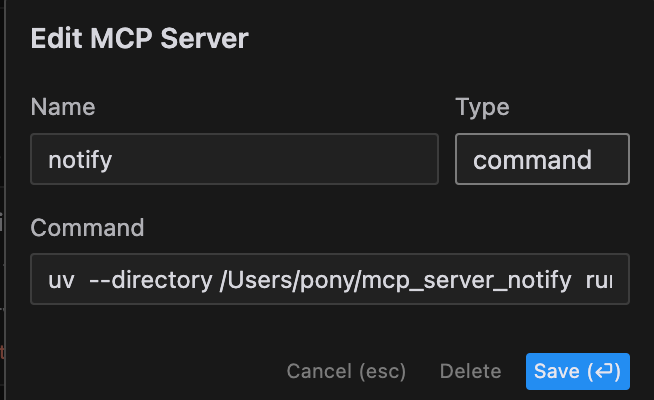
使用MCP服务器实现AI任务完成通知:让Cursor更智能
0. 简介 在使用AI工具进行长时间任务时,常常需要等待结果。MCP(Model Context Protocol)服务器"mcp_server_notify"提供了一个优雅的解决方案,让AI在完成任务后通过系统通知提醒你。本文将介绍如何在Cursor中配置和使用…...
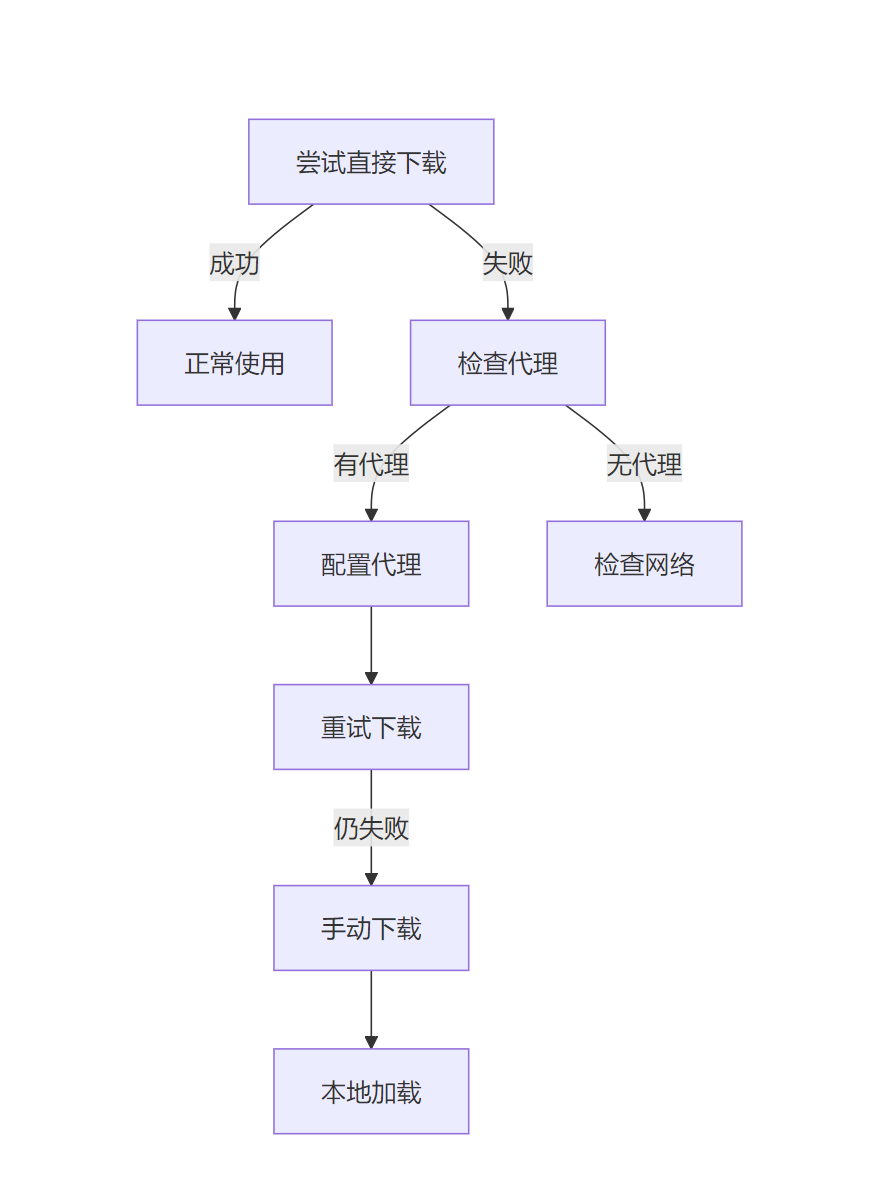
解决 Hugging Face SentenceTransformer 下载失败的完整指南:ProxyError、SSLError与手动下载方案
问题背景 在使用 Hugging Face 的 SentenceTransformer 加载预训练模型 all-MiniLM-L6-v2 时,遇到了以下错误: 代理连接失败(ProxyError / SSLError: KRB5_S_TKT_NYV)大文件下载中断(unexpected EOF while reading&a…...
Linux | I.MX6ULL开发板固件烧录所需文件详述(9)
01 搞清楚手里的开发板是 EMMC 还是 NAND FLASH 。默认我的商业级是EMMC ,开关:10011010 终结者i.MX6ULL 开卡板分为工业级和商业级两种不同的开发板。 商业级的核心板,它的存储是 EMMC 的,EMMC 的存储是类似于正方形的芯片,旁边是 NAND FLASH的一个封装,因为我们这里…...
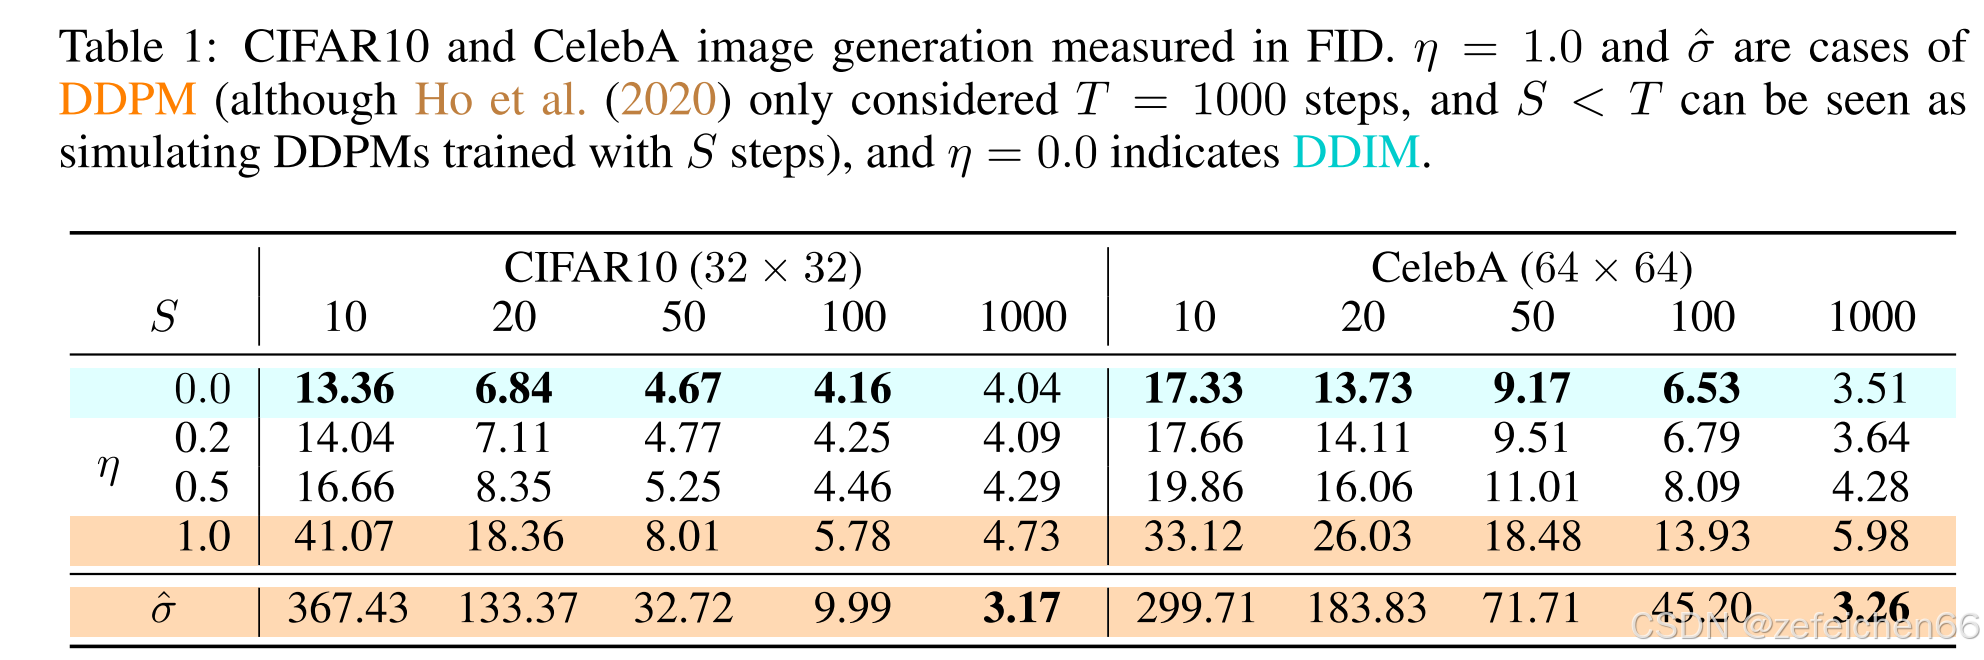
论文阅读笔记:Denoising Diffusion Implicit Models (5)
0、快速访问 论文阅读笔记:Denoising Diffusion Implicit Models (1) 论文阅读笔记:Denoising Diffusion Implicit Models (2) 论文阅读笔记:Denoising Diffusion Implicit Models (…...
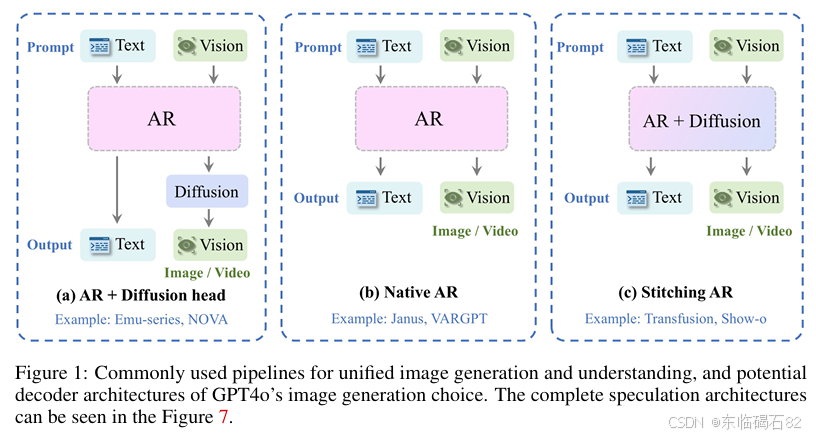
【AI论文】GPT-ImgEval:一个用于诊断GPT4o在图像生成方面的综合基准
摘要:OpenAI的GPT4o模型最近的突破在图像生成和编辑方面展现了令人惊讶的良好能力,引起了社区的极大兴奋。 本技术报告介绍了第一眼评估基准(名为GPT-ImgEval),定量和定性诊断GPT-4o在三个关键维度的性能:&…...
)
CSS3学习教程,从入门到精通, 学院网站完整项目 - HTML5 + CSS3 实现(25)
学院网站完整项目 - HTML5 CSS3 实现 下面是一个完整的学院网站项目,包含主页、新闻列表页、新闻详情页和视频宣传页的实现。我将按照您的要求提供详细的代码和注释。 项目结构 college-website/ ├── index.html # 主页 ├── news-list.html …...

Java虚拟机面试题:内存管理(中)
🧑 博主简介:CSDN博客专家,历代文学网(PC端可以访问:https://literature.sinhy.com/#/?__c1000,移动端可微信小程序搜索“历代文学”)总架构师,15年工作经验,精通Java编…...

如何绕过myabtis-plus的逻辑删除条件
目标 mp中所有方法都会带上逻辑删除,如果启用了逻辑删除,有时候我们需要忽略逻辑删除.改如何实现 解决方法 自定义DeleteReal 方法 import com.baomidou.mybatisplus.core.enums.SqlMethod; import com.baomidou.mybatisplus.core.injector.AbstractMethod; import com.ba…...

王者荣耀的游戏匹配机制
王者荣耀的匹配机制主要基于ELO评分系统(隐藏分机制)和段位匹配,旨在平衡对局双方实力,同时通过多种策略控制玩家胜率趋近50%。 一、匹配机制核心 1. ELO评分(隐藏分) - 系统根据玩家的胜负、KDA、伤害量、…...
游戏无法启动?XINPUT1_3.dll 丢失的终极解决方案
当你兴奋地启动一款新游戏时,突然弹出一个错误提示——‘程序无法启动,因为计算机中丢失 XINPUT1_3.dll’。这种问题在 PC 玩家中非常常见,尤其是运行一些较老的游戏时。XINPUT1_3.dll 是 DirectX 运行库的关键组件,缺失会导致游戏…...

macOS下SourceInsight的替代品
macOS 推荐的几款开源、轻量级、且功能类似于 SourceInsight 的源码阅读工具(排除 VS Code): 1. Zeal(离线文档 简单代码导航) 官网/GitHub: https://zealdocs.org/特点: 轻量级离线文档浏览器࿰…...
嵌入式硬件如何在PADS中将原理图转换为PCB详解
本文旨在讲述如何在PADS中将原理图转换为PCB。 本文以C51原理图作为例子。 1.首先在桌面上打开PADS Logic 2.找到菜单栏的文件选项,然后点击新建。 点击新建之后出现如下界面。...

FreeRTOS 软件定时器工作原理及应用
FreeRTOS 软件定时器工作原理及应用 FreeRTOS 的 软件定时器(Software Timer) 是一种基于系统节拍(Tick)的计时机制,允许开发者创建周期性或单次触发的定时任务,而无需依赖硬件定时器。软件定时器由 定时器服务任务(Timer Service Task) 管理,适用于需要时间控制但无…...
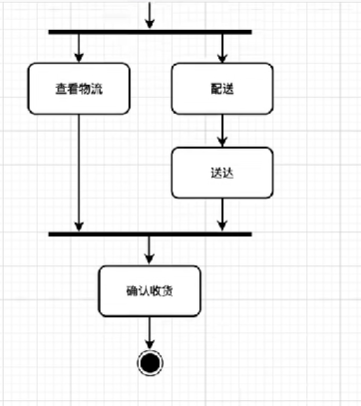
软件工程-UML
例图,类图,状态图,顺序图,活动图 目录 例图 类图 状态图 顺序图 活动图 例图 例图由四个元素组成,参与者、用例、系统边界、参与者和用例之间的关系 参与者用一个小人表示,用例用椭圆表示ÿ…...
)
力扣经典算法篇-9-跳跃游戏(贪心算法,反向递推)
题干: 给你一个非负整数数组 nums ,你最初位于数组的 第一个下标 。数组中的每个元素代表你在该位置可以跳跃的最大长度。 判断你是否能够到达最后一个下标,如果可以,返回 true ;否则,返回 false 。 示例 …...

【Linux学习笔记】初识进程概念和进程PCB
【Linux学习笔记】初识冯诺依曼体系和进程PCB 🔥个人主页:大白的编程日记 🔥专栏:Linux学习笔记 文章目录 【Linux学习笔记】初识冯诺依曼体系和进程PCB前言一. 冯诺依曼体系结构1.1 关于冯诺依曼体系的要点: 二. 操…...