matlab论文图一的地形区域图的球形展示Version_1
matlab论文图一的地形区域图的球形展示Version_1
图片
此图来源于:
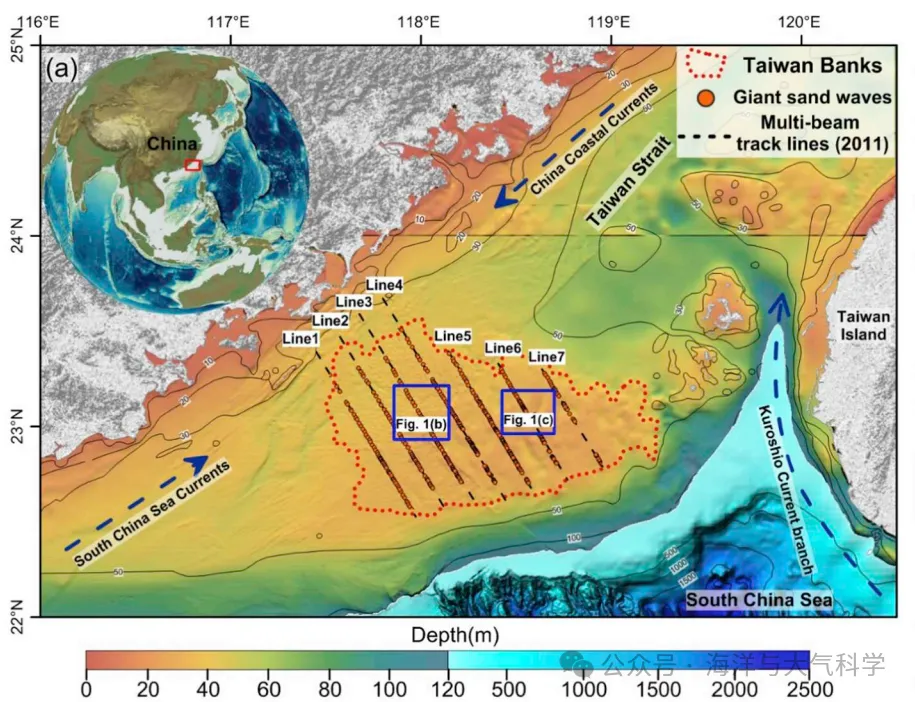
这个图的地形数据很精细,因为我画的图没展示这么精细。
底图海图可以画,然后左上角放个球形地图:
写成函数可以进行调用:
add_sphere1(cmap)
cmap指的是colormap;
调用格式: 先设置位置,在添加colormap,在调整视角即可。
%% %% add sphere  set position
axes('position',[0.02 0.49 0.42 0.42])
% add colormap
cmap=load('MPL_terrain.txt');
add_sphere1(cmap)
view(40,25);% view angles
% view(x,y);% x 控制左右旋转,y控制上下旋转。
结果展示:
图片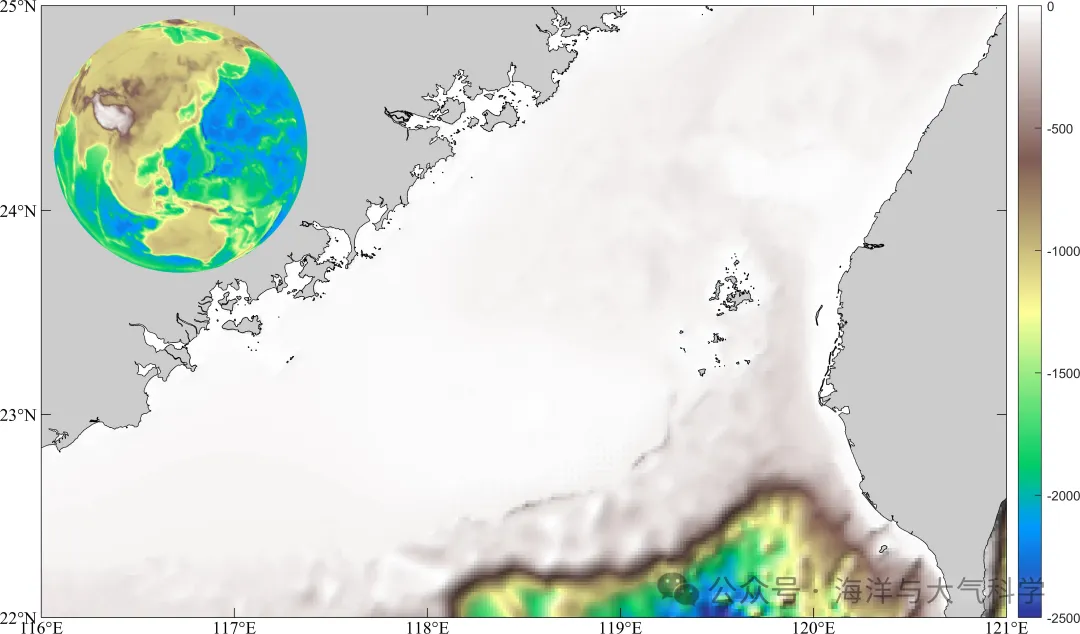
图片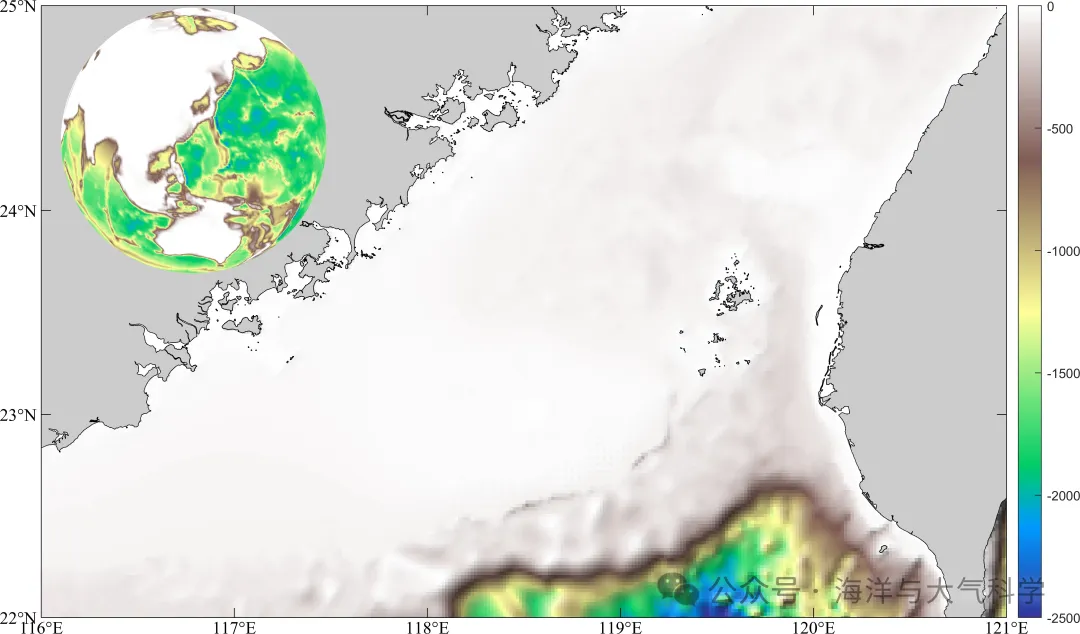
图片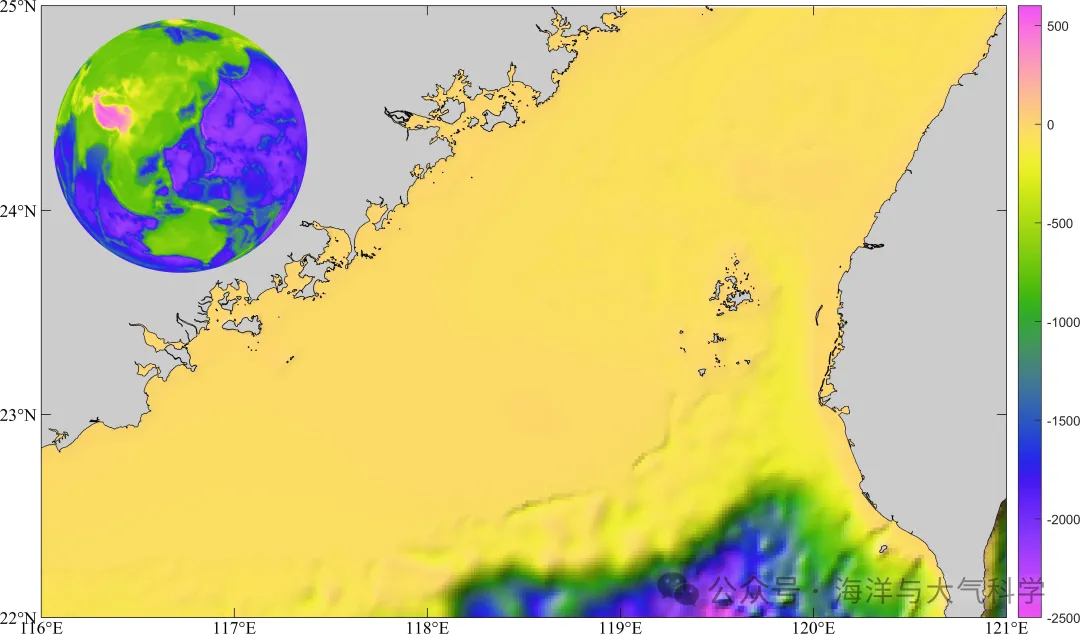
图片
代码: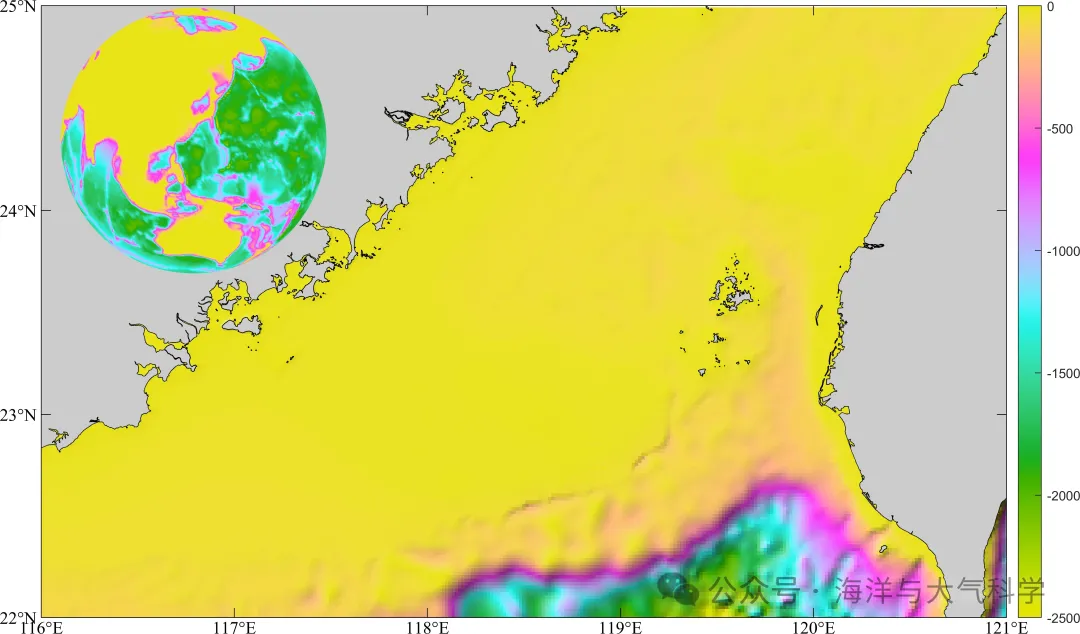
底图海图
.rtcContent { padding: 30px; } .lineNode {font-size: 12pt; font-family: "Times New Roman", Menlo, Monaco, Consolas, "Courier New", monospace; font-style: normal; font-weight: normal; }
clc;clear;close all
% read data
file='F:\data\etopo\etopo1.nc';
lon=double(ncread(file,'x'));
lat=double(ncread( file,'y'));
h=double(ncread(file,'z'));
% 选定区域南海%
area  =[116 121 22 25];
ln =find(lon>=area(1)&lon<=area(2));
la=find(lat>=area(3)&lat<=area(4));
lon = lon(ln);
lat  = lat(la);
H = h(ln,la);
[x,y]=meshgrid(lon,lat);
x=x'; y=y';
%% %%m_pcolor画出了区域的等深线图
close all
figure;
set(0,'defaultfigurecolor','w')
set(gcf,'position',[50 50 1200 900])
m_proj('Miller','lon',[area(1) area(2)],'lat',[area(3) area(4)]);
caxis([-2500 0])% 这些必须放在m_shaderelief的前面,不然不可用
colorbar
cmap=load('MPL_terrain.txt');% add colormap
m_shadedrelief(lon,lat,H',cmap);
m_gshhs_c('patch',[0.8 0.8 0.8]);
m_grid('linest','none','xtick',[116:1:121],'ytick',[22:25],'tickdir','in',...'FontName','Times new roman','FontSize',12,'color','k','box','on');%box on off and fancy;
m_shadedrelief.m.rtcContent { padding: 30px; } .lineNode {font-size: 12pt; font-family: "Times New Roman", Menlo, Monaco, Consolas, "Courier New", monospace; font-style: normal; font-weight: normal; }
function  [Truecol,x,y]=m_shadedrelief(x,y,Z,cmap,varargin)
% M_SHADEDRELIEF Shaded relief topography in an image
%  M_SHADEDRELIEF(X,Y,Z) presents a shaded relief topography, as would
%  be seen if a 3D model was artifically lit from the side. Slopes
%  facing the light are lightened, and slopes facing away from the
%  light are darkened. X and Y are horizontal and vertical coordinate
%  VECTORS, and these should be in the same units as the height Z
%  (e.g., all in meters), otherwise the slope angle calculations will be
%  in error.
%
%  Usage notes:
%
%  (1) M_SHADEDRELIEF is a replacement for a low-level call to IMAGE
%  displaying a true-colour image so it MUST be preceded by COLORMAP and
%  CAXIS calls.
%
%  (2) Gradients have to be calculated, so Z should be a data-type accepted
%   by Matlab's GRADIENT function (currently double and single).
%   If Z is (e.g.) 'int8', or some other data-type you must use
%   M_SHADED_RELIEF(X,Y,double(Z))
%
%  (3) M_SHADEDRELIEF probably is most useful as a backdrop to maps with
%  a rectangular outline box - either a cylindrical projection, or some
%  other projection with M_PROJ(...'rectbox','on').
%
%  (4) Finally, the simplest way of not running into problems:
%     - if your elevation data is in LAT/LON coords (i.e. in a matrix where
%       each row has points with the same latitude, and each column has points
%       with the same longitude), use
%                  M_PROJ('equidistant cylindrical',...)
%     - if your elevation data is in UTM coords (meters E/N), i.e. in a matrix
%       where each row has the same UTM northing and the each column has the
%       same UTM easting, use
%                  M_PROJ('utm',....)
%
%  M_SHADEDRELIEF(...,'parameter',value) lets you set various properties.
%  These are:
%       'coords' : Coordinates of X/Y/Z:
%                     'geog' for lat/lon, Z meters,  (default)
%                     'map'  for X/Y map coordinates, Z meters
%                     'Z' if X/Y/Z are all in same units (e.g., meters)
%       'lightangle' : true direction (degrees) of light source (default
%                      -45, i.e. from the north-west)
%       'gradient': Shading effects increase with slope angle
%                   until slopes reach this value (in degrees), and are
%                   held constant for higher slopes (default 10). Reduce
%                   for smoother surfaces.
%       'clipval' : Fractional change in shading for slopes>='gradient'.
%                  0 means no change, 1 means saturation to white or black
%                  if slope is facing directly towards or away from light
%                  source, (default 0.9).
%       'nancol'  : RGB colour of NaN values (default [1 1 1]);
%       'lakecol' : RGB colour of lakes (flat sections) (default NaN)
%                   If set to NaN lakes are ignored.
%
%   IM=M_SHADEDRELIEF(...) returns a handle to the image.
%
%   [SR,X,Y]=m_SHADEDRELIEF(...) does not create an image but only returns
%   the  true-color matrix SR of the shaded relief, as well as the X/Y
%   vectors needed to display it.
%
%   Example:
%           load topo
%           subplot(2,1,1);  % Example without it
%           imagesc(topolonlim,topolatlim,topo);
%           caxis([-5000 5000]);
%           colormap([m_colmap('water',64);m_colmap('gland',64)]);
%           set(gca,'ydir','normal');
%
%           subplot(2,1,2);  % Example with it
%           caxis([-5000 5000]);
%           colormap([m_colmap('water',64);m_colmap('gland',64)]);
%           m_shadedrelief(topolonlim,topolatlim,topo,'gradient',5e2,'coord','Z');
%           axis tight
%
% Rich Pawlowicz (rich@eoas.ubc.ca) Dec/2017
%
% This software is provided "as is" without warranty of any kind. But
% it's mine, so you can't sell it.
%
% Changes:
% Jan/2018 - changed outputs for flexibility
%            and added 'map' coordinate handling
% Mar/2019 - added alphamapping for out-of-map areas, started using colormap
%            local to AXES not to FIGURE.
% Apr/2019 - some parts relied on the ones-expansion; went back to meshgrid
%            for compatibility with older matlab versions (thanks P. Grahn)
% Oct/2020 - added info about how input Z must be a double
global MAP_PROJECTION MAP_VAR_LIST
lighthead=-45;
gradfac=10;
clipval=.9;
nancol=[1 1 1];
lakecol=NaN; %[.7 .9 1];
geocoords='geog';
scfac=6400000;  % Used for geo coordinates if on sphere radius 1
while ~isempty(varargin)switch lower(varargin{1}(1:3))case 'coo'switch lower(varargin{2}(1))case 'g'geocoords='geog';case 'm'geocoords='map';case {'z','u'}geocoords='z';otherwiseerror('Unknown coordinate specification');endcase 'lig'lighthead=varargin{2};case 'gra'gradfac=varargin{2};case 'cli'clipval=varargin{2};case 'nan'nancol=varargin{2};case 'lak'lakecol=varargin{2};otherwiseerror(['m_shadedrelief: Unknown option: ' varargin{1}]);endvarargin(1:2)=[];
end
% All kinds of issues dealing with coords:
% First, we need VECTOR x/y as an input to gradient function.
if isvector(x) && size(x,2)==1x=x';
elseif ~isvector(x)       % Can't be a matrixerror('Input X must be a VECTOR');
end
if isvector(y) && size(y,1)==1y=y';
elseif ~isvector(y)error('Input Y must be a VECTOR');
end
%  Now handle the case if we just give a starting and an ending point
if length(x)==2x=linspace(0,1,size(Z,2))*diff(x)+x(1);
end
if length(y)==2y=linspace(0,1,size(Z,1))'*diff(y)+y(1);
end
if strcmp(geocoords,'geog')                           %  If its Lat/Long points% Have to have initialized a map firstif isempty(MAP_PROJECTION)disp('No Map Projection initialized - call M_PROJ first!');return;end% Convert to X/Y[X,Y]=m_ll2xy(x(1,:),repmat(mean(y(:,1)),1,size(x,2)),'clip','off');[X2,Y2]=m_ll2xy(repmat(mean(x(1,:)),size(y,1),1),y(:,1),'clip','off');x=X;y=Y2;
end
% Note - 'image' spaces points evenly, so we should just check that they
% are even otherwise the image won't line up with coastlines...
if max(abs( x - linspace(x(1),x(end),length(x)) ) )/abs(x(end)-x(1)) >.005warning(['********** Image will be distorted in X direction!! use M_IMAGE to re-map? *************']);
end
if max(abs( y - linspace(y(1),y(end),length(y))' ) )/abs(y(end)-y(1)) >.005warning(['********** Image will be distorted in Y direction!! use M_IMAGE to re-map? *************']);
end
% Convert colours to uint8s
if all(nancol<=1)nancol=uint8(nancol*255);
end
% Convert colours to uint8s
if all(lakecol<=1)lakecol=uint8(lakecol*255);
end
% Get caxis
clims=caxis;
if all(clims==[0 1])   % Not setclims=[min(Z(:)) max(Z(:))];
end
% Get colormap for the current axes
% cmap1=load('GMT_drywet1.mat');
% cmap1 =(cmap1.raw_new);
% cc=colormap((cmap1));
if isempty(cmap)cmap=load('MPL_terrain.txt');
elsecmap = cmap;
end
cc=colormap((cmap));
% cc=colormap(gca);
cc2=round(cc*255);  % we need these in 0-255 range to get Truecolor
lcc=size(cc,1);
%inan=isnan(Z);
% Get slopes
% If we are using a normal ellipsoid we need to rescale
% x/y to get true slope angles
if ~isfloat(Z)warning('Your input Z matrix must be floating point');
end
if  (strcmp(geocoords,'map') || strcmp(geocoords,'geog')) && strcmp(MAP_VAR_LIST.ellipsoid,'normal')scfac=6370997;[Fx,Fy]=gradient( Z, x*scfac, y*scfac);
else[Fx,Fy]=gradient( Z, x, y);
end
% Find NaN
[inan,jnan]=find(isnan(Z) | isnan(Fx) | isnan(Fy) );
% Probable lakes
[islake,jlake]=find(Fx==0 & Fy==0);
% Convert z levels into a colormap index.
% Some iteration to discover the exact formula that matlab uses for mapping to
% color indices (from 1 to lcc)
%idx=min( floor( min(max( (Z-clims(1))/(clims(2)-clims(1)),0) ,1 )*lcc )+1,lcc);
idx=max(min( floor(   (Z-clims(1))/(clims(2)-clims(1))*lcc  )+1  ,lcc),1);
% The slope angle relative to the light direction in degrees.
Fnw=atand(imag(-(Fx+i*Fy)*exp(i*lighthead*pi/180)));
%Put an upper and lower limit on the angles
%%Fnw=min(clipval,max(-clipval,Fnw/gradfac));
Fnw=clipval*tanh(Fnw/gradfac);
% Now get the colormap for each pixel and scale the RGB value 'c'.
% If the correction is -0.1 then scale  c*(1 - |-0.1|)
% If the correction is  0.1 then scale  c*(1 - |+0.1|) + 0.1*255
%depending on the slope.
%Truecol=uint8(max(0,min(255,   reshape([cc2(idx,:)],[size(idx) 3]).*repmat(1-abs(Fnw),1,1,3)+repmat(255*Fnw.*(Fnw>0),1,1,3) ) ));
Truecol=uint8( reshape([cc2(idx,:)],[size(idx) 3]).*repmat(1-abs(Fnw),1,1,3)+repmat(255*Fnw.*(Fnw>0),1,1,3) ) ;
%Truecol=uint8(max(0,min(255,   reshape([cc2(idx,:)],[size(idx) 3]).*repmat(1+Fnw/gradfac,1,1,3) ) ));
% Colour Lakes
if any(islake) && isfinite(lakecol(1))Truecol(sub2ind(size(Truecol),islake,jlake,  ones(size(islake))))=lakecol(1);Truecol(sub2ind(size(Truecol),islake,jlake,1+ones(size(islake))))=lakecol(2);Truecol(sub2ind(size(Truecol),islake,jlake,2+ones(size(islake))))=lakecol(3);
end
% Colour the NaNs
if any(inan)Truecol(sub2ind(size(Truecol),inan,jnan,  ones(size(inan))))=nancol(1);Truecol(sub2ind(size(Truecol),inan,jnan,1+ones(size(inan))))=nancol(2);Truecol(sub2ind(size(Truecol),inan,jnan,2+ones(size(inan))))=nancol(3);
end
if strcmp(geocoords,'map')   % Have to "make invisible" the points outside the map limits.[xm,ym]=meshgrid(x,y);[HLG,HLT]=m_xy2ll(xm,ym);% Find pixels outside the limits of the actual map (if the boundary% isn't a rectangle)if strcmp(MAP_VAR_LIST.rectbox,'off')[I,J]=find(HLT<MAP_VAR_LIST.lats(1) | HLT>MAP_VAR_LIST.lats(2) | HLG<MAP_VAR_LIST.longs(1) | HLG>MAP_VAR_LIST.longs(2));elseif strcmp(MAP_VAR_LIST.rectbox,'circle')R=(xm.^2 +ym.^2);[I,J]=find(R>MAP_VAR_LIST.rhomax.^2);elseI=[];J=[];endbackcolor=uint8(get(gcf,'color')*255);if any(I)                          % if some pixels are outside the map areafor k=1:3IJ=sub2ind(size(Truecol),I,J,repmat(k,size(I)));Truecol(IJ)=backcolor(k);           % Set them to the background colourendend
elseI=[];J=[];
end
if nargout<=1if any(I)  % make pixels outside the map area transparent, if needed.alphadata=  ones(size(Truecol,1),size(Truecol,2),'logical');IJ=sub2ind(size(alphadata),I,J);alphadata(IJ)=0;Truecol=image('xdata',x,'ydata',y,'cdata',Truecol,'alphadata',alphadata,'tag','m_shadedrelief');elseTruecol=image('xdata',x,'ydata',y,'cdata',Truecol,'tag','m_shadedrelief');end
end
add_sphere1
.rtcContent { padding: 30px; } .lineNode {font-size: 12pt; font-family: "Times New Roman", Menlo, Monaco, Consolas, "Courier New", monospace; font-style: normal; font-weight: normal; }
function add_sphere1(cmap)
load topo topo topomap1    % load data
x = 0:359;                                % longitude
y = -89:90;                               % latitude
[X1,Y1]=meshgrid(x,y);
x1 = 0:0.1:360;
y1=-89:0.1:90;
[X,Y]=meshgrid(x1,y1);
topo_new = griddata(X1,Y1,topo,X,Y);
% figure;
% set(0,'defaultfigurecolor','w')
% set(gcf,'position',[50 50 1200 900])
[x,y,z] = sphere(100);          % create a sphere
s = surface(x,y,z);            % plot spherical surface
s.FaceColor = 'texturemap';    % use texture mapping
s.CData = topo_new;                % set color data to topographic data
s.EdgeColor = 'none';          % remove edges
s.FaceLighting = 'gouraud';    % preferred lighting for curved surfaces
s.SpecularStrength = 0.4;      % change the strength of the reflected light
if isempty(cmap)cmap=load('MPL_terrain.txt');
elsecmap = cmap;
end
colormap(cmap)
% light('Position',[1 0 1])     % add a light
axis square off                % set axis to square and remove axis
view([30,10])                 % set the viewing angle
相关文章:
matlab论文图一的地形区域图的球形展示Version_1
matlab论文图一的地形区域图的球形展示Version_1 图片 此图来源于: 
发布一个npm包,更新包,删除包
发布一个npm包,更新包,删除包 如何将自己的项目 发布为一个 npm 包,并掌握 更新 和 删除 的操作流程。 🚀 一、发布一个 npm 包的完整流程 ✅ 1. 注册并登录 npm 账号 如果还没有账号,先注册: 官网注册&…...

Redis专题
前言 Redis的各种思想跟机组Cache和操作系统对进程的管理非常类似! 一:看到你的简历上写了你的项目里面用到了redis,为啥用redis? 因为传统的关系型数据库如Mysql,已经不能适用所有的场景,比如秒杀的库存扣减ÿ…...

LeetCode[232]用栈实现队列
思路: 一道很简单的题,就是栈是先进后出,队列是先进先出,用两个栈底相互对着,这样一个队列就产生了,右栈为空的情况,左栈栈底就是队首元素,所以我们需要将左栈全部压入右栈ÿ…...
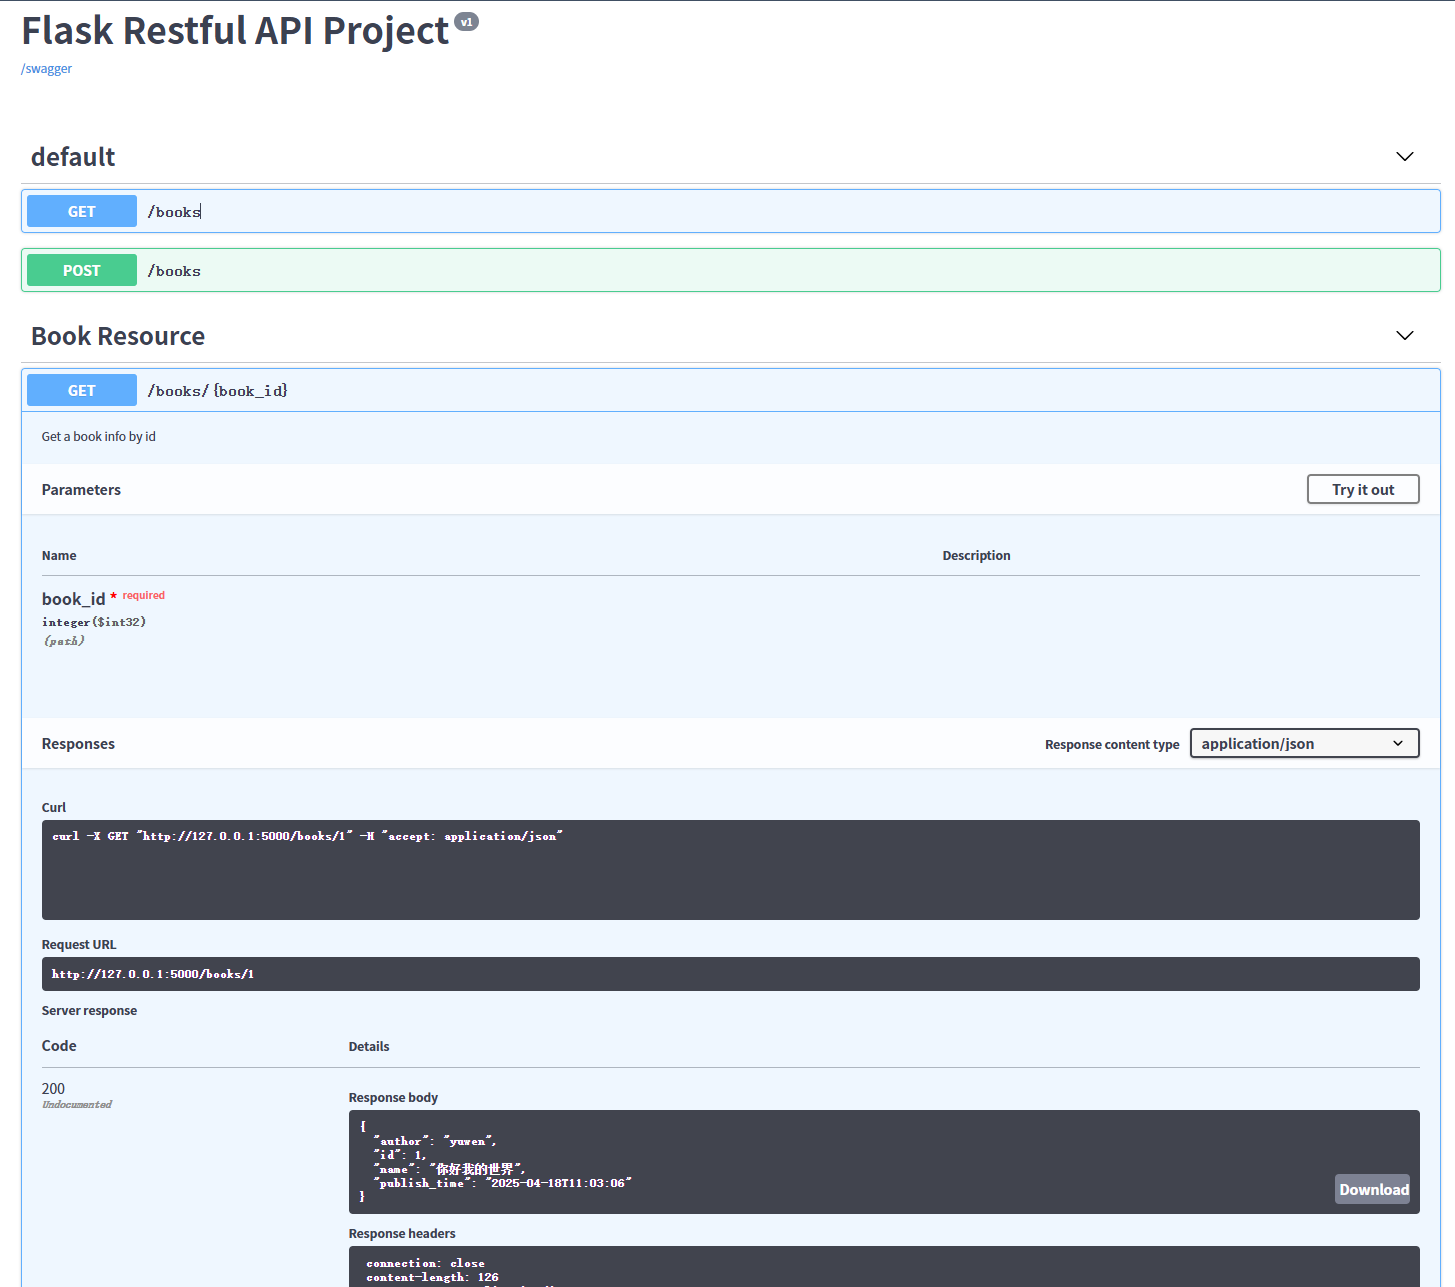
Flask API 项目 Swagger 版本打架不兼容
Flask API 项目 Swagger 版本打架不兼容 1. 问题背景 在使用 Flask 3.0.0 时遇到以下问题: 安装 flask_restful_swagger 时,它强制将 Flask 降级到 1.1.4,并导致其他依赖(如 flask-sqlalchemy、flask-apispec)出现版…...
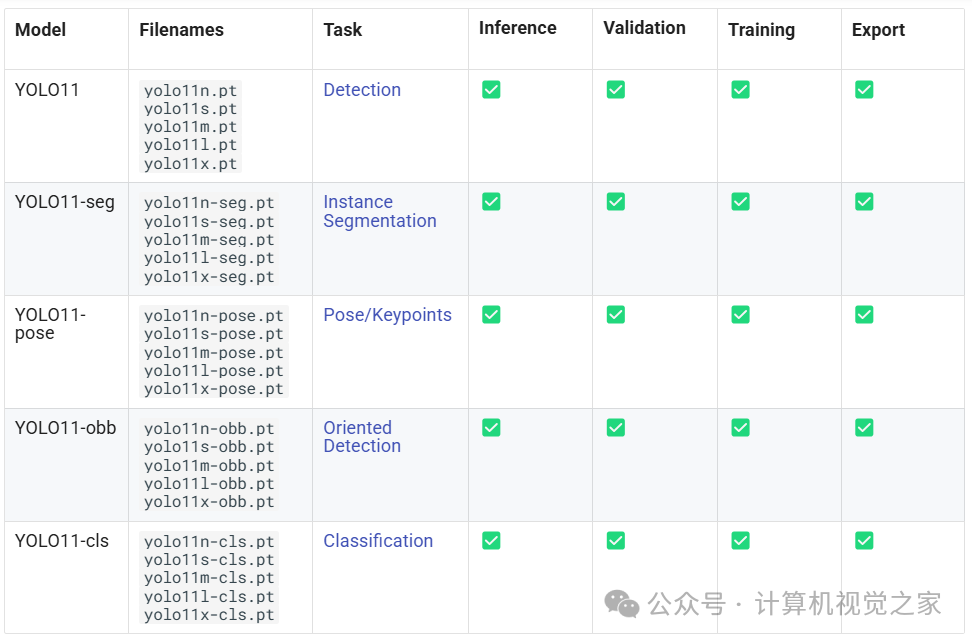
基于YOLOv11 和 ByteTrack 实现目标跟踪
介 绍 之前我们介绍了使用YOLOv9与 ByteTrack 结合进行对象跟踪的概念,展示了这两种强大的技术如何有效地协同工作。现在,让我们通过探索与 ByteTrack 结合的 YOLOv11 来进一步了解这一概念。 实战 | 基于YOLOv9和OpenCV实现车辆跟踪计数(步骤…...
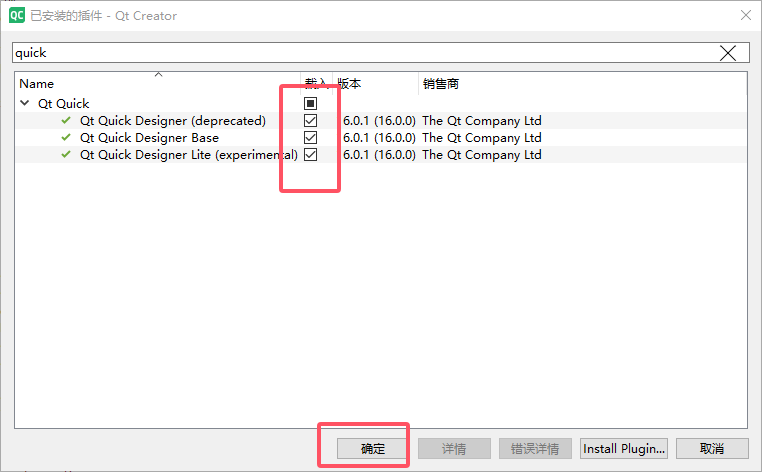
Qt Creator 创建 Qt Quick Application一些问题
一、Qt Creator 创建 Qt Quick Application 时无法选择 MSVC 编译器(即使已安装 Qt 5.15.2 和 MSVC2019) 1、打开 Qt Creator 的编译器设置 工具 (Tools) → 选项 (Options) → Kits → 编译器 (Compilers) 检查是否存在 Microsoft Visual C++ Compiler (x86_amd64) 或类似条…...

编码转换器
大批量转换编码 可以将整个工程文件夹从GB18030转为UTF-8 使用Qt C制作 项目背景 比较老的工程,尤其是keil嵌入式的工程,其文本文件(.c、.cpp、.h、.txt、……)编码为gb2312,这为移植维护等带来了不便。现在uit-8用…...

Django 中集成 Apache Kafka 可以实现异步消息处理、数据流式传输
在 Django 中集成 Apache Kafka 可以实现异步消息处理、数据流式传输等功能,以下是详细的集成步骤和示例代码: 1. 安装必要的库 首先,你需要安装 kafka-python 库,它是 Python 中操作 Kafka 的常用库。可以使用以下命令进行安装: pip install kafka-python2. 配置 Kafk…...

Scala 入门指南
Scala 入门指南 目录 简介环境搭建基础语法面向对象编程函数式编程集合模式匹配特质隐式转换并发编程与 Java 互操作最佳实践常见问题 简介 Scala 是一种多范式编程语言,结合了面向对象编程和函数式编程的特性。它运行在 JVM 上,与 Java 完全兼容&am…...

[密码学实战]密评考试训练系统v1.0程序及密评参考题库(获取路径在文末)
[密码学实战]密评考试训练系统v1.0程序及密评参考题库 引言:密评考试的重要性与挑战 商用密码应用安全性评估(简称"密评") 作为我国密码领域的重要认证体系,已成为信息安全从业者的必备技能。根据国家密码管理局最新数据,截至2024年6月,全国仅有3000余人持有…...

【Rust 精进之路之第6篇-流程之舞】控制流:`if/else`, `loop`, `while`, `for` 与模式匹配初窥
系列: Rust 精进之路:构建可靠、高效软件的底层逻辑 作者: 码觉客 发布日期: 2025-04-20 引言:让代码“活”起来——指令的流动 在前面的文章中,我们已经掌握了 Rust 的基础数据类型(标量和复合类型)以及如何通过变量绑定来存储和命名它们。这相当于我们准备好了程序…...

Git ——提交至github,Vercel拉取,更新不了项目的问题解决
首先因为github上有个错误 1 failing check Vercel - No GitHub account was found matching the commit author email address 发现好像是vercel拉取不了项目,vercel登录的邮箱与我此次提交更改的邮箱不匹配,查看Git的user确实如此(之前的…...
)
原型模式详解及在自动驾驶场景代码示例(c++代码实现)
模式定义 原型模式(Prototype Pattern)是一种创建型设计模式,通过克隆已有对象来创建新对象,避免重复执行昂贵的初始化操作。该模式特别适用于需要高效创建相似对象的场景,是自动驾驶感知系统中处理大量重复数据结构的…...
蓝桥杯常考的找规律题
目录 灵感来源: B站视频链接: 找规律题具有什么样的特点: 报数游戏(Java组): 题目描述: 题目链接: 思路详解: 代码详解: 阶乘求和(Java组…...
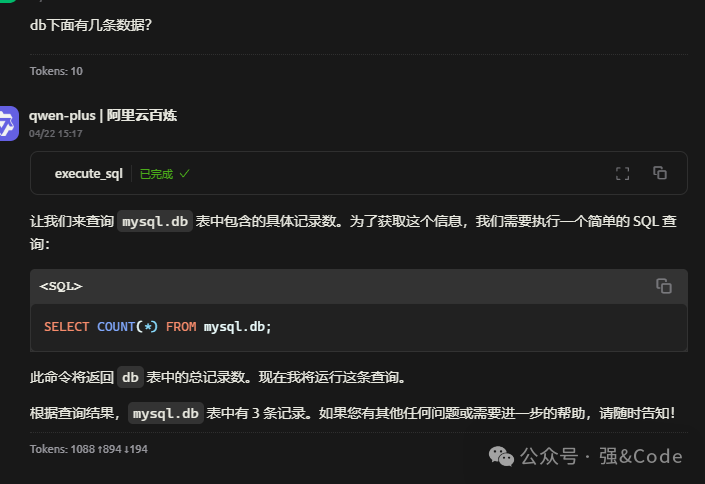
MySQL_MCP_Server_pro接入cherry_studio实现大模型操作数据库
大模型直接与数据库交互,实现基本增删改查操作。首先贴下代码地址: https://github.com/wenb1n-dev/mysql_mcp_server_pro 安装环境:win10 1、下载代码 git clone https://github.com/wenb1n-dev/mysql_mcp_server_pro 2、使用conda创建…...

Element UI、Element Plus 里的表单验证的required必填的属性不能动态响应?
一 问题背景 想要实现: 新增/修改对话框中(同一个),修改时“备注”字段非必填,新增时"备注"字段必填 结果发现直接写不生效-初始化一次性 edit: [{ required: true, message: "请输入备注", trigger: "blur" }…...
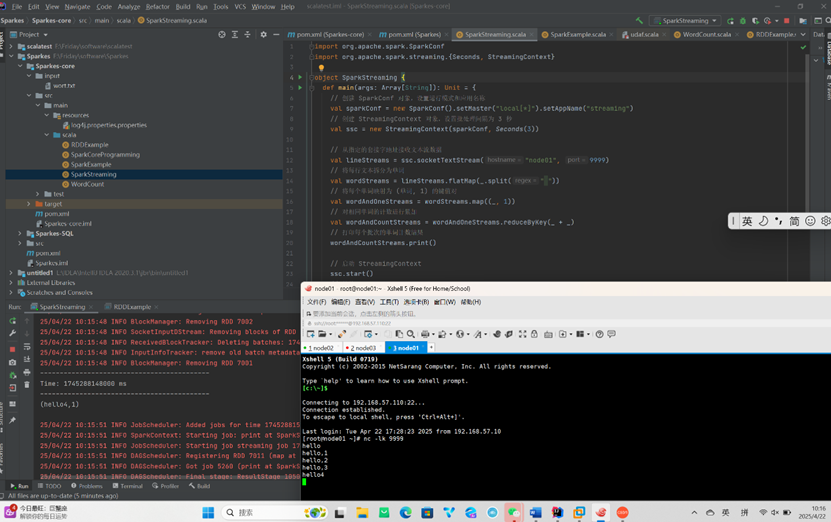
Spark-Streaming
WordCount案例 添加依赖 <?xml version"1.0" encoding"UTF-8"?> <project xmlns"http://maven.apache.org/POM/4.0.0" xmlns:xsi"http://www.w3.org/2001/XMLSchema-instance" xsi:schemaLocation"…...
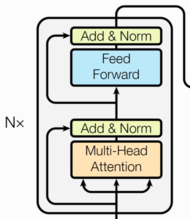
transformer 子层连接结构
子层连接结构 目标 了解什么是子层连接结构掌握子层连接结构的实现过程 什么是子层连接结构? 输入到每个子层以及规范化层的过程中, 使用了残差连接(跳跃连接, 从Add&Norm -> Add&Norm), 因此我们把这一部分结构整体叫做子层连接(代表子层及其链接结构), 在每个…...
linux oracle 19c 静默安装
oracle数据库有个比较很抓瞎的事情,不同的版本搭建的大致流程是一样的,但是在实操细节上会有不同,比如操作的脚本位置和配置项等等,这些会变,所以需要时常积累不同版本的文档 这里有一点要说明,之所以使用…...
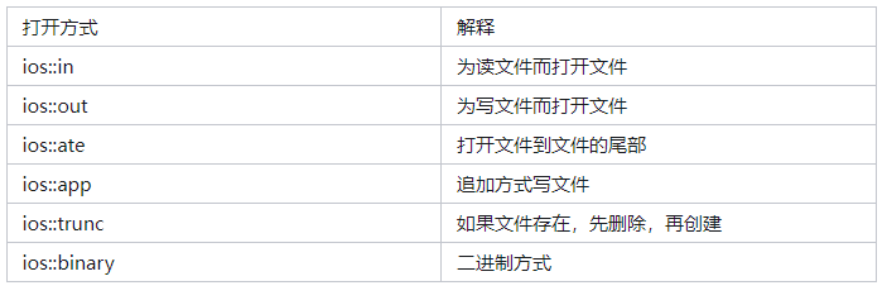
C++ 的 输入输出流(I/O Streams)
什么是输入输出流 C 的输入输出操作是通过 流(stream) 机制实现的。 流——就是数据的流动通道,比如: 输入流:从设备(如键盘、文件)读取数据 → 程序 输出流:程序将数据写入设备&…...

mybatis-plus开发orm
1、mybatis 使用mybatis-generator自动生成代码 这个也是有系统在使用 2、mybatis-plus开发orm--有的系统在使用 MybatisPlus超详细讲解_mybatis-plus-CSDN博客...

使用Python+OpenCV将多级嵌套文件夹下的视频文件抽帧为JPG图片
使用PythonOpenCV将多级嵌套文件夹下的视频文件抽帧为JPG图片 import os import cv2 import time# 存放视频文件的多层嵌套文件夹路径 videoPath D:\\videos\\ # 保存抽帧的图片的文件夹路径 savePath D:\\images\\if not os.path.exists(savePath):os.mkdir(savePath) vide…...
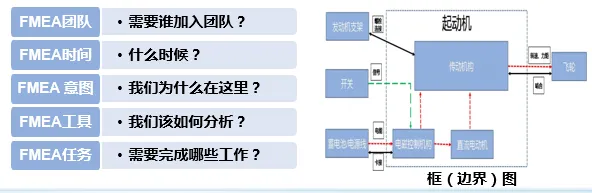
电子电器架构 --- DFMEA设计失效模式和后果分析
我是穿拖鞋的汉子,魔都中坚持长期主义的汽车电子工程师。 老规矩,分享一段喜欢的文字,避免自己成为高知识低文化的工程师: 周末洗了一个澡,换了一身衣服,出了门却不知道去哪儿,不知道去找谁,漫无目的走着,大概这就是成年人最深的孤独吧! 旧人不知我近况,新人不知我过…...

C#抽象类和虚方法的作用是什么?
抽象类 (abstract class): 不能直接实例化,只能被继承。 用来定义一套基础框架和规范,强制子类必须实现某些方法(抽象方法)。 可用来封装一些共通的逻辑,减少代码重复。 虚方法 (virtual): …...

C#获取当前方法的命名空间、类名称、方法名称以及方法的参数信息
C#获取当前方法的命名空间、类名称、方法名称以及方法的参数信息 输出示例模块示例 输出示例 获取信息:WindowsFormsApp1.Form1.button1_Click(System.Object sender,System.EventArgs e) 引发的异常:“System.IndexOutOfRangeException”(位于 WindowsFormsApp1.ex…...

Apache SeaTunnel:新一代开源、高性能数据集成工具
Apache SeaTunnel 是一款开源、分布式、高性能的数据集成工具,可以通过配置快速搭建数据管道,支持实时海量数据同步。 Apache SeaTunnel 专注于数据集成和数据同步,主要旨在解决数据集成领域的常见问题: 数据源多样性:…...
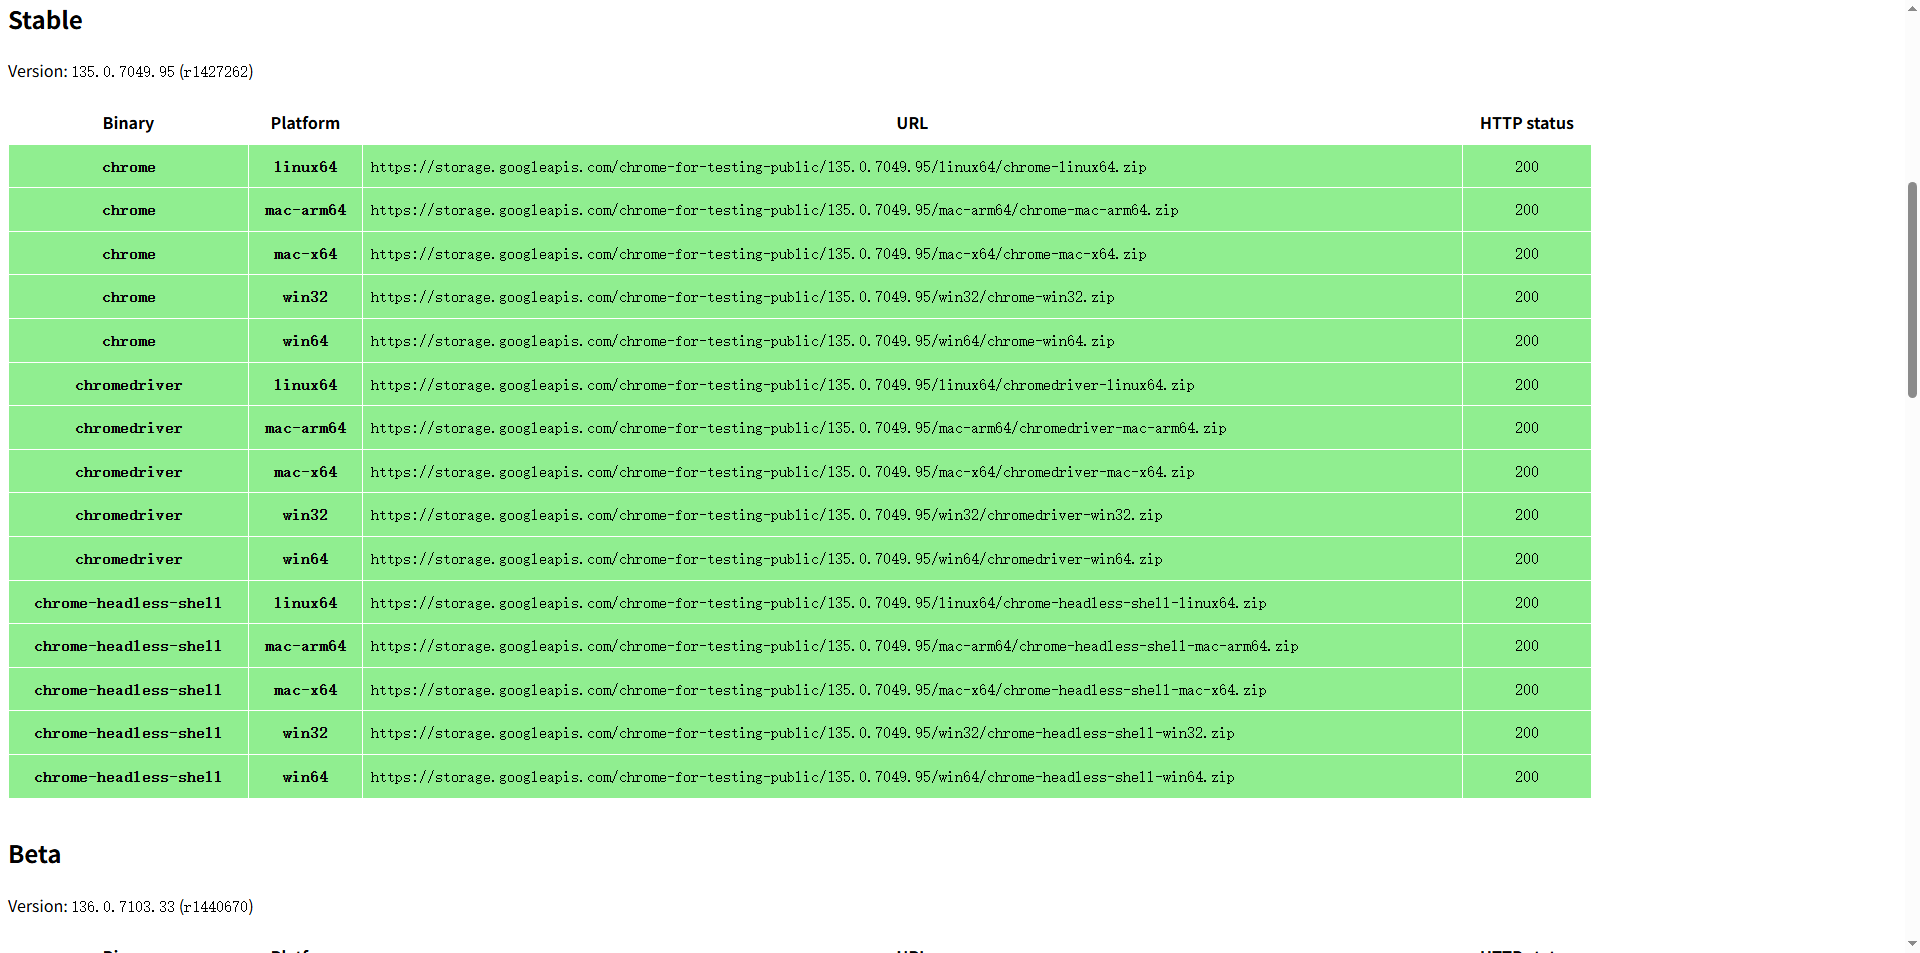
python+selenium+pytest自动化测试chrome driver版本下载
chrome浏览器chromedriver版本下载地址 https://googlechromelabs.github.io/chrome-for-testing/#stable...
3.1 WPF使用MaterialDesign的介绍1
MaterialDesignInXAML Toolkit 是一个流行的开源 C# WPF 控件库,它实现了 Google 的 Material Design 规范,让开发者可以轻松创建现代化的 WPF 应用程序界面 Material Design 是一个流行的设计语言,由 Google 开发,旨在帮助开发者构建美观且一致的 UI 界面。对于使用 C# 的…...

从 0 到 1 打通 AI 工作流:Dify+Zapier 实现工具自动化调用实战
一、引言:当 AI 遇到工具孤岛 在企业数字化转型的浪潮中,AI 工具的应用早已从单一的对话交互进阶到复杂的业务流程自动化。但开发者常常面临这样的困境:本地开发的 MCP 工具(如 ERP 数据清洗脚本、CRM 工单系统 API)如…...