Prometheus+Grafana实现对服务的监控
Prometheus+Grafana实现对服务的监控
前言:Prometheus+Grafana实现监控会更加全面,监控的组件更多
Prometheus官网https://prometheus.io/docs/prometheus/latest/getting_started/
Grafana官网https://grafana.com/docs/
一、安装Prometheus+Grafana
这里采用docker安装
1.1 在服务器建3个文件夹
/mydata/prometheus/config
/mydata/prometheus/data
/mydata/grafana/storage
/mydata/grafana/conf
1.2 同步时间和目录授权
- 打开vmware顶部菜单栏: 虚拟机==>设置==>选项==>VMware Tool==>将客户机时间与主机同步
2.授权目录(包括配置文件):chown -R 777 /mydata/prometheus
1.3 Prometheus的配置文件准备
把prometheus的配置文件prometheus.yml放进 /mydata/prometheus/config
目录,prometheus.yml来源,可以去上面官网下载一个prometheus,然后把他的prometheus.yml拖进/mydata/prometheus/config
1.4 docker安装
docker run -d --name=prometheus \
-p 9090:9090 \
-v /mydata/prometheus/config/prometheus.yml:/etc/prometheus/prometheus.yml \
-v /mydata/prometheus/data:/prometheus \
-v /etc/localtime:/etc/localtime:ro \
prom/prometheus
查看:http://192.168.174.198:9090/query 能看到输出,则安装成功
1.5 安装grafana
docker run -d -p 3000:3000 --name=grafana \
-v /mydata/grafana/storage:/var/lib/Grafana \
-v /mydata/grafana/conf/defaults.ini:/usr/share/grafana/conf/defaults.ini \
-v /etc/localtime:/etc/localtime:ro \
grafana/grafana
defaults.ini我是用docker cp 复制出来的,也可以下载一个grafana,粘进去。目的是想汉化,修改defaults.ini中的default_language = zh-Hans 。但是实际并没有全部汉化,部分汉化
至此可以打开 grafana的地址:http://192.168.174.198:3000能看到页面就算安装成功
1.6 给grafana添加promethus数据源
选择grafana左侧的菜单:
Data source ==> 点击右上角的 add new data source
==>选择prometheus ==> 在Connection 地址数据我们的promethus的地址http://192.168.174.198:9090 ==>点击最下方的 save&test
二、监控docker
2.1 安装cadvisor
docker run -d \--volume=/:/rootfs:ro \--volume=/var/run:/var/run:ro \--volume=/sys:/sys:ro \--volume=/var/lib/docker/:/var/lib/docker:ro \--volume=/dev/disk/:/dev/disk:ro \-v /etc/localtime:/etc/localtime:ro \--publish=8181:8080 \--detach=true \--name=cadvisor \google/cadvisor:latest
鉴于8080容易冲突,我这映射到docker对外端口8181
2.2 修改prometheus.yml
在prometheus.yml添加如下,用于监控docker详情
- job_name: 'docker'static_configs:- targets: ['192.168.174.198:8181']labels:instance: docker
此时prometheus.yml的内容如下:
global:scrape_interval: 15s # Set the scrape interval to every 15 seconds. Default is every 1 minute.evaluation_interval: 15s # Evaluate rules every 15 seconds. The default is every 1 minute.alerting:alertmanagers:- static_configs:- targets:# - alertmanager:9093# Load rules once and periodically evaluate them according to the global 'evaluation_interval'.
rule_files:# - "first_rules.yml"# - "second_rules.yml"
# A scrape configuration containing exactly one endpoint to scrape:
# Here it's Prometheus itself.
scrape_configs:# The job name is added as a label `job=<job_name>` to any timeseries scraped from this config.- job_name: "prometheus"static_configs:- targets: ["192.168.174.198:9090"]labels:app: "prometheus"- job_name: 'docker'static_configs:- targets: ['192.168.174.198:8181']labels:instance: docker
2.3 配置监控面板
打开grafana面板,点击右上角的+选择 import dashboard,在弹出的页面输入193,监控docker的面板用193就挺好。
下面的prometheus 选择刚才的prometheus 即可打开对docker的监控画面
三、监控linux服务器
3.1 安装node-exporter
docker run -d -p 9100:9100 --name=node-exporter \
-v "/proc:/host/proc:ro" \
-v "/sys:/host/sys:ro" \
-v "/:/rootfs:ro" \
-v /etc/localtime:/etc/localtime:ro \
--net="host" \
prom/node-exporter
3.2 添加prometheus.yml配置
在上面的基础上添加
- job_name: 'node-explore'static_configs:- targets: ['192.168.174.198:9100']labels:instance: node-explore
3.3 配置grafana面板
打开grafana面板,点击右上角的+选择 import dashboard,在弹出的页面输入9276,监控模板可以自己去试探,我用9276号模板挺方便。
下面的prometheus 选择刚才的prometheus 即可打开对linux服务器的监控画面
四、prometheus监控微服务(springboot)
4.1导包
<dependency><groupId>org.springframework.boot</groupId><artifactId>spring-boot-starter-actuator</artifactId></dependency><dependency><groupId>io.micrometer</groupId><artifactId>micrometer-registry-prometheus</artifactId></dependency>
我的springcloud 2023.0.3 /springcloud alibaba 2023.0.1.2 /springboot3.3.5
这里引入的actuator和prometheus的maven的版本分别是:3.3.5、1.9.8
4.2 yml配置
management:server:# 这个端口是prometheus与微服务通信的端口port: 8100endpoints:web:exposure:# 从技术上更改端点的暴露 -- 通过HTTP公开所有的端点,可通过 /actuator/{ID} 去查看,如 /actuator/beansinclude: "*"base-path: /actuatorjmx:exposure:include: "*"endpoint:prometheus:enabled: truehealth:show-details: alwayshttptrace:enabled: truemetrics:enabled: trueexport:prometheus:enabled: trueprometheus:metrics:export:enabled: true
4.3 主启动类添加
@Value("${spring.application.name}")
private String application;@Bean
MeterRegistryCustomizer<MeterRegistry> configurer(){return (registry)->registry.config().commonTags("application",application);
}
4.4 修改prometheus.yml配置
- job_name: 'gateway'metrics_path: '/actuator/prometheus'static_configs:- targets: ['192.168.20.109:8100']labels:instance: springboot
最终的prometheus.yml内容如下:
global:scrape_interval: 15s # Set the scrape interval to every 15 seconds. Default is every 1 minute.evaluation_interval: 15s # Evaluate rules every 15 seconds. The default is every 1 minute.# scrape_timeout is set to the global default (10s).# Alertmanager configuration
alerting:alertmanagers:- static_configs:- targets:# - alertmanager:9093# Load rules once and periodically evaluate them according to the global 'evaluation_interval'.
rule_files:# - "first_rules.yml"# - "second_rules.yml"# A scrape configuration containing exactly one endpoint to scrape:
# Here it's Prometheus itself.
scrape_configs:# The job name is added as a label `job=<job_name>` to any timeseries scraped from this config.- job_name: "prometheus"# metrics_path defaults to '/metrics'# scheme defaults to 'http'.static_configs:- targets: ["192.168.174.198:9090"]# The label name is added as a label `label_name=<label_value>` to any timeseries scraped from this config.labels:app: "prometheus"- job_name: 'docker'static_configs:- targets: ['192.168.174.198:8181']labels:instance: docker- job_name: 'node-explore'static_configs:- targets: ['192.168.174.198:9100']labels:instance: node-explore- job_name: 'admin'metrics_path: '/actuator/prometheus'static_configs:- targets: ['192.168.20.109:8096']labels:instance: springboot- job_name: 'auth'metrics_path: '/actuator/prometheus'static_configs:- targets: ['192.168.20.109:8097']labels:instance: springboot- job_name: 'order'metrics_path: '/actuator/prometheus'static_configs:- targets: ['192.168.20.109:8098']labels:instance: springboot- job_name: 'storage'metrics_path: '/actuator/prometheus'static_configs:- targets: ['192.168.20.109:8099']labels:instance: springboot- job_name: 'gateway'metrics_path: '/actuator/prometheus'static_configs:- targets: ['192.168.20.109:8100']labels:instance: springboot
4.5 配置grafana面板
打开grafana面板,点击右上角的+选择 import dashboard,在弹出的页面输入12900,监控springboot我用的是12900。 下面的prometheus 选择刚才的prometheus 即可打开对springboot服务器的监控画面
五、常用grafana监控组件与模板id总结
微服务性能监控springboot:12900、4701、10280
docker环境性能监控:893 、193
nacos性能监控:13221
mysql性能监控:9362
elasticsearch:266
Redis监控模板:11835
Jmeter: 5496
linux服务器 :12633 、9276、8919
相关文章:

Prometheus+Grafana实现对服务的监控
PrometheusGrafana实现对服务的监控 前言:PrometheusGrafana实现监控会更加全面,监控的组件更多 Prometheus官网 https://prometheus.io/docs/prometheus/latest/getting_started/ Grafana官网 https://grafana.com/docs/ 一、安装PrometheusGrafana 这…...
ARM笔记-ARM伪指令及编程基础
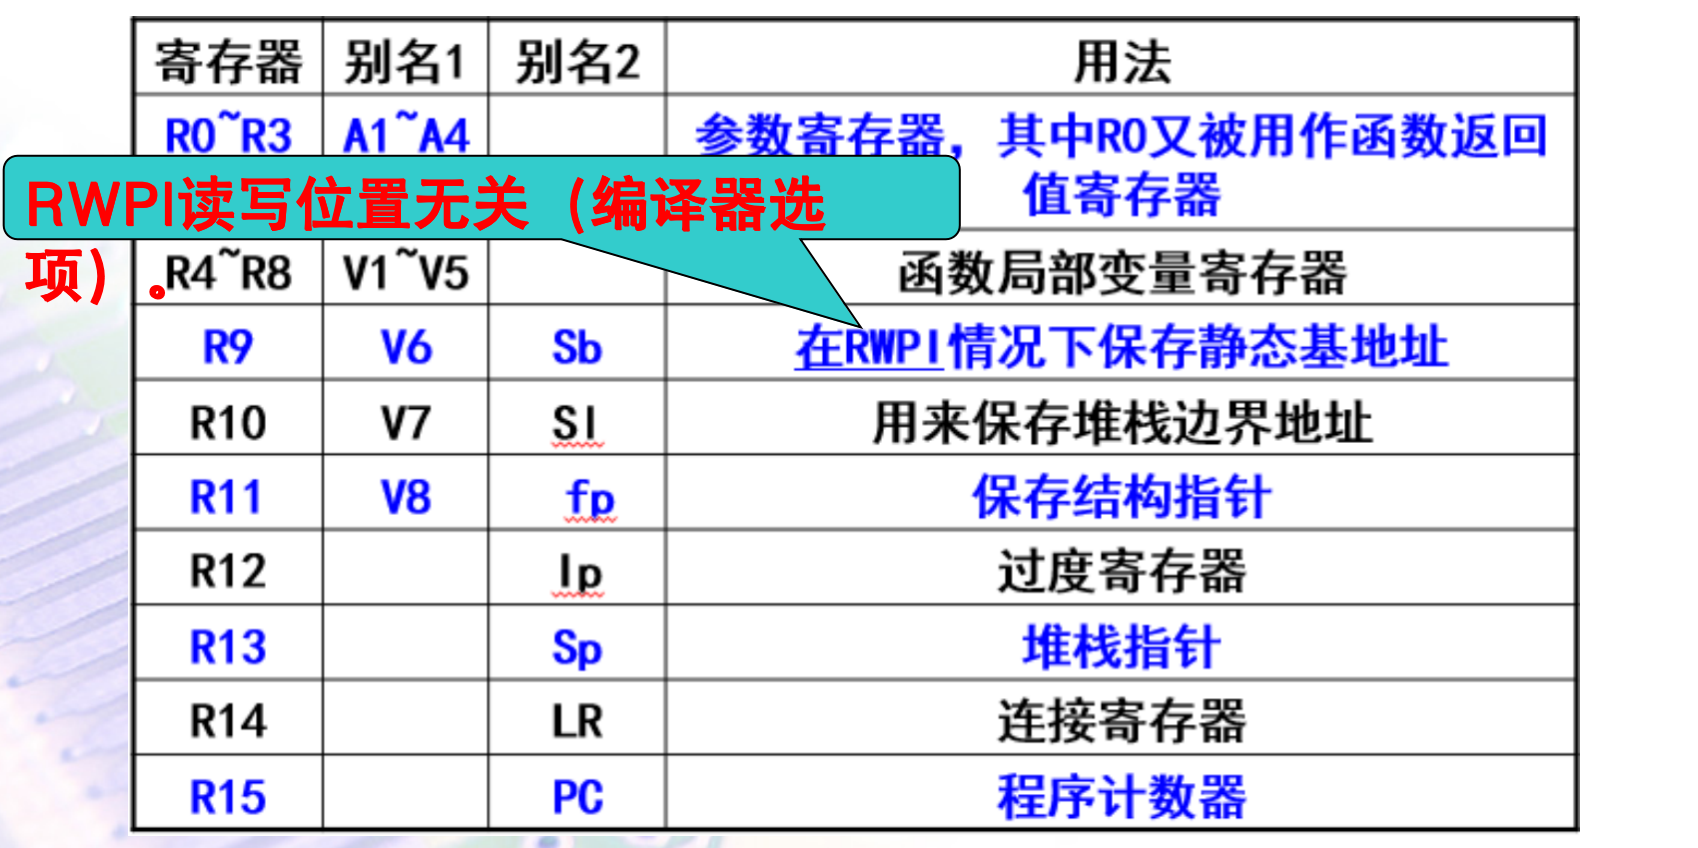
第四章 ARM伪指令及编程基础 4.1 伪指令概述 4.1.1 伪指令定义 人们设计了一些专门用于指导汇编器进行汇编工作的指令,由于这些指令不形成机器码指令,它们只是在汇编器进行汇编工作的过程中起作用,所以被叫做伪指令。 4.1.2 伪指令特征 …...

Python入门手册:Python基础语法
Python是一种简洁、易读且功能强大的编程语言,非常适合初学者入门。无论你是编程新手,还是有一定编程基础但想学习Python的开发者,掌握Python的基础语法都是迈向高效编程的第一步。本文将详细介绍Python的基本语法,包括变量和数据…...

SpringBoot-SpringBoot源码解读
SpringBoot-SpringBoot源码解读 一、Spring Boot启动过程概述 Spring Boot通过一系列的类和机制,简化了Spring应用的启动流程。当你执行SpringApplication.run()时,Spring Boot会自动完成应用的初始化、环境配置、组件加载、自动配置等任务,…...
CAD如何导出PDF?PDF如何转CAD?详细教程来了
浩辰CAD看图王是一款功能强大的CAD图纸查看与编辑工具,其核心功能之一便是支持CAD与PDF格式的互转。下面是CAD看图王输出PDF和PDF转CAD功能的详细介绍及操作步骤: 一、输出PDF功能 看图王可以将CAD图纸转换为PDF格式,是文件在不同的设备上显…...
python-数据可视化(大数据、数据分析、可视化图像、HTML页面)
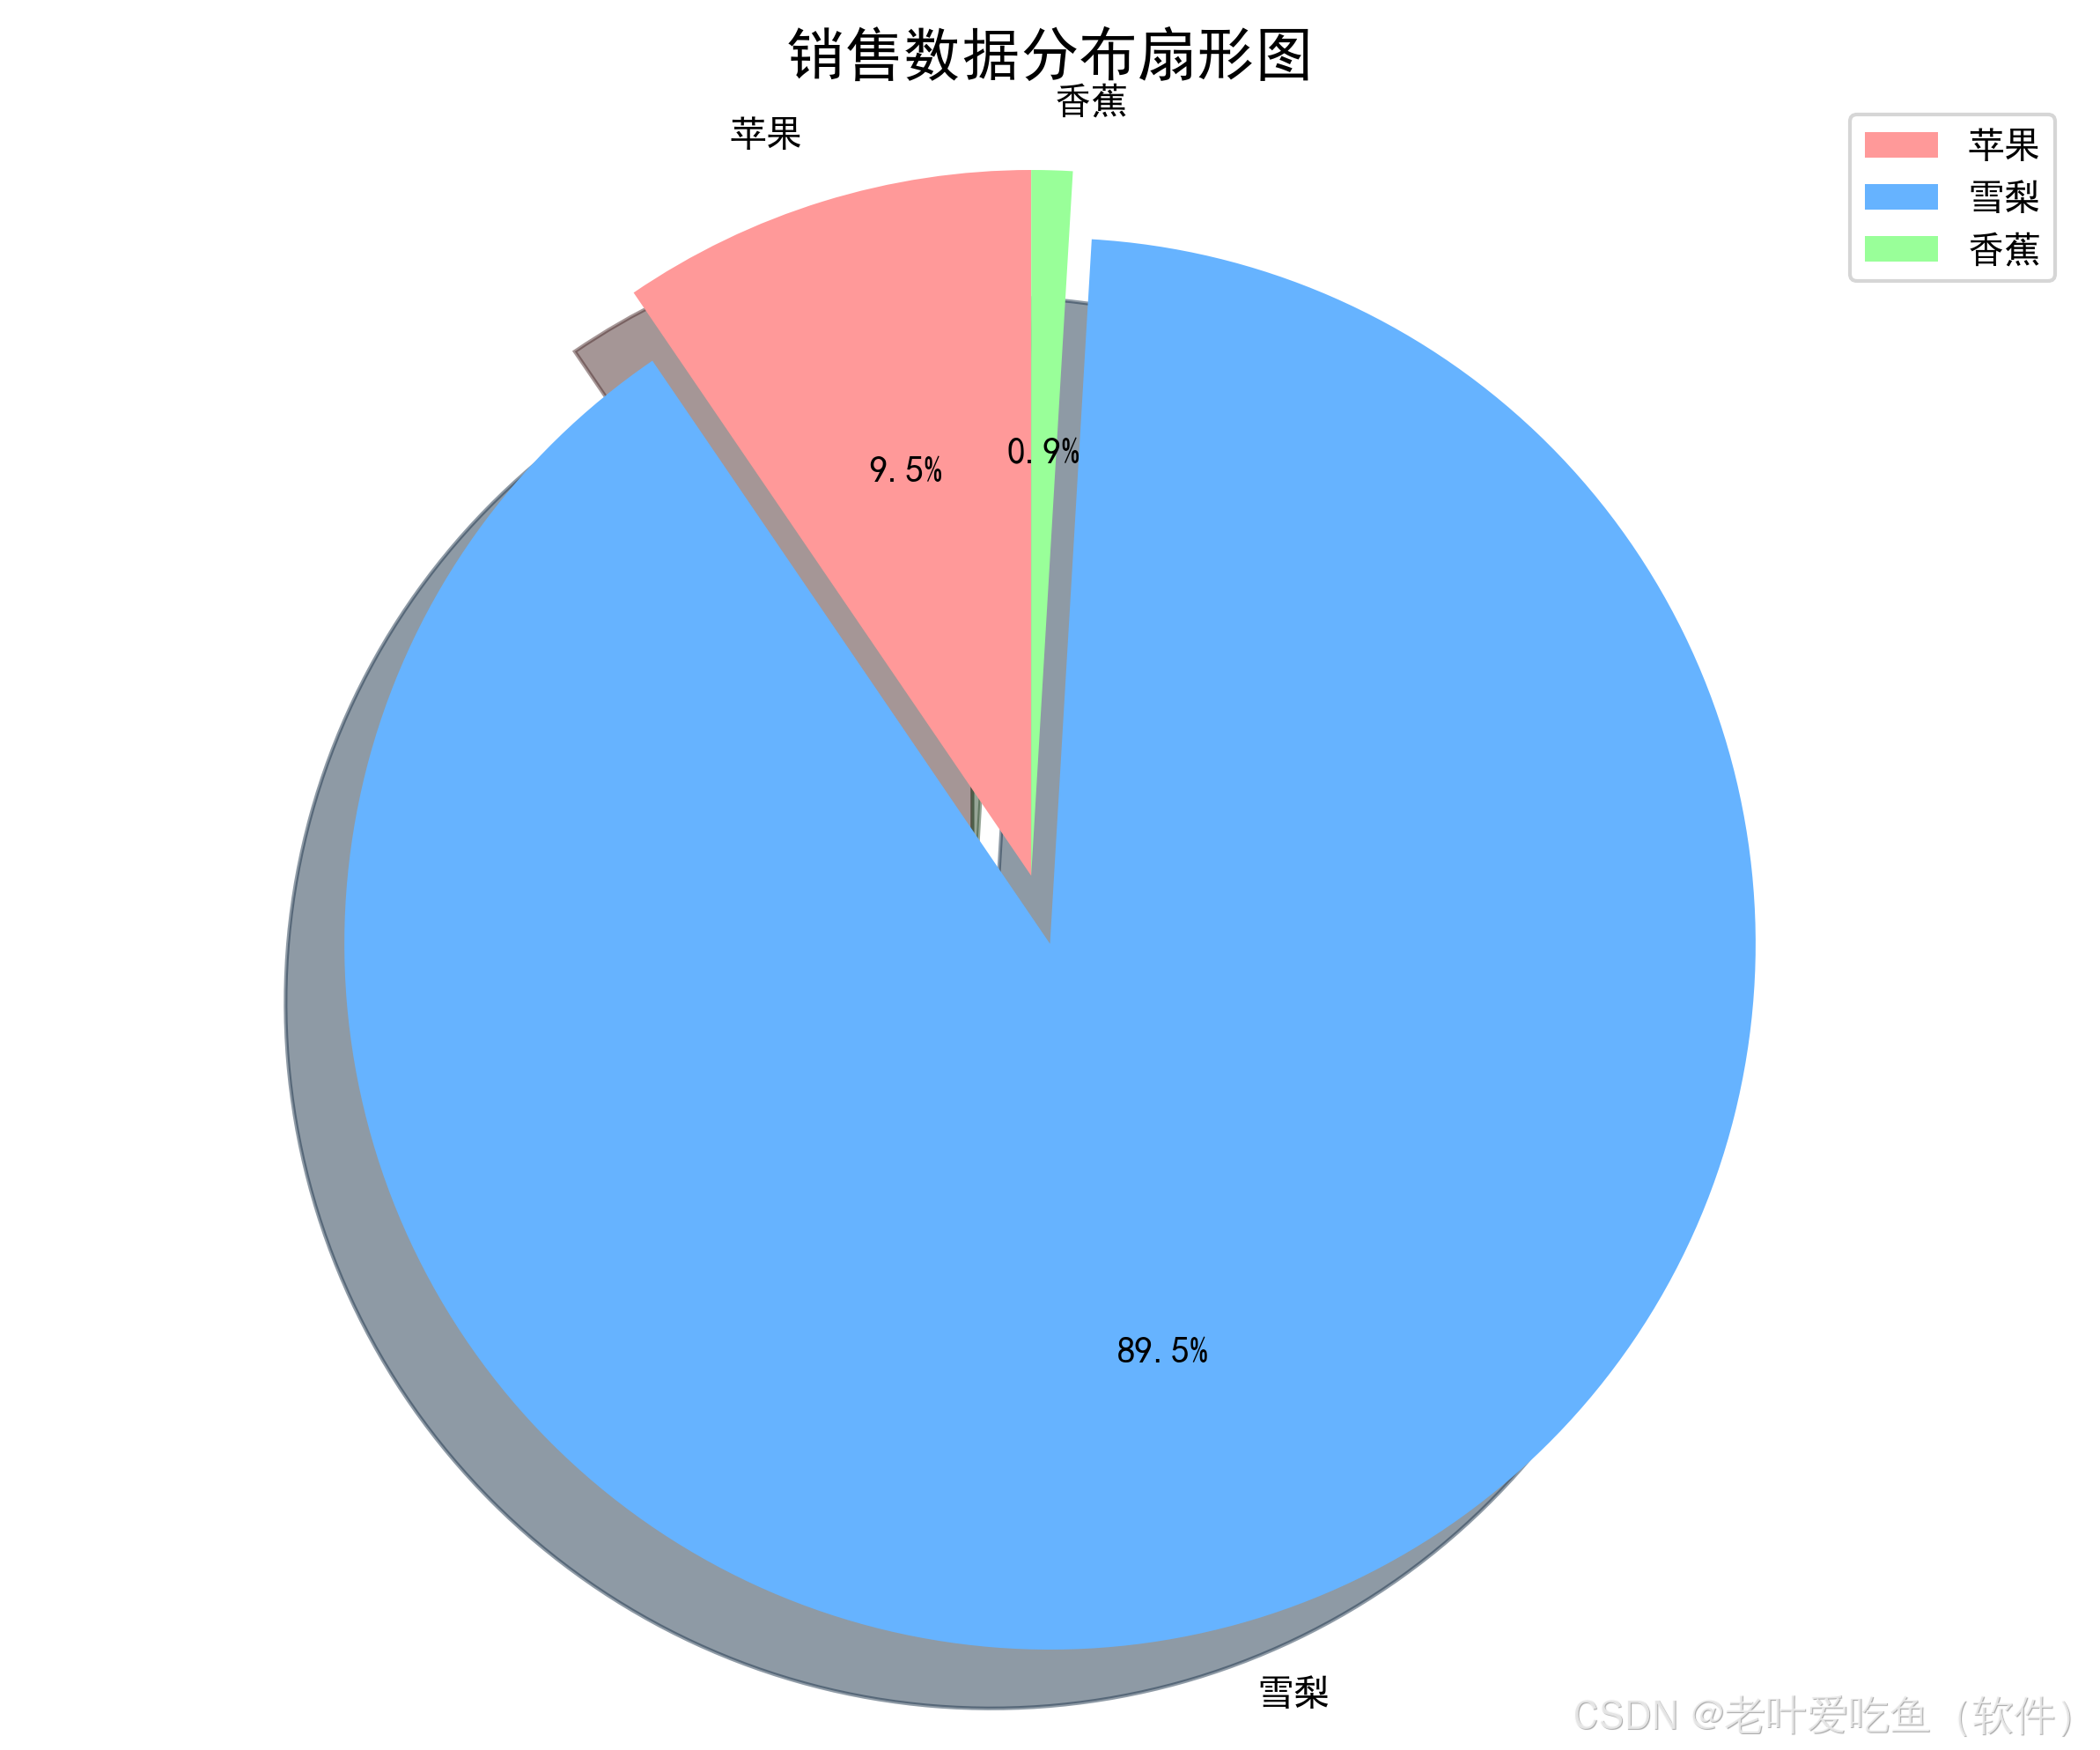
通过 Python 读取 XLS 、CSV文件中的数据,对数据进行处理,然后生成包含柱状图、扇形图和折线图的 HTML 报告。这个方案使用了 pandas 处理数据,matplotlib 生成图表,并将图表嵌入到 HTML 页面中。 1.XSL文件生成可视化图像、生成h…...

el-select中自定义 两组el-option,但是key不一样,并且点击需获取当前整个项的所有属性
当el-select中只有一组el-option , 获取点击的当前项的属性 , el-select 绑定:value-keyid 但是 当el-select中有两组el-option ,每组option的key不一致,如下代码所示 <el-selectv-model"sth" change"choosee":value-key"…...
【笔记】OpenCV的学习(未完)
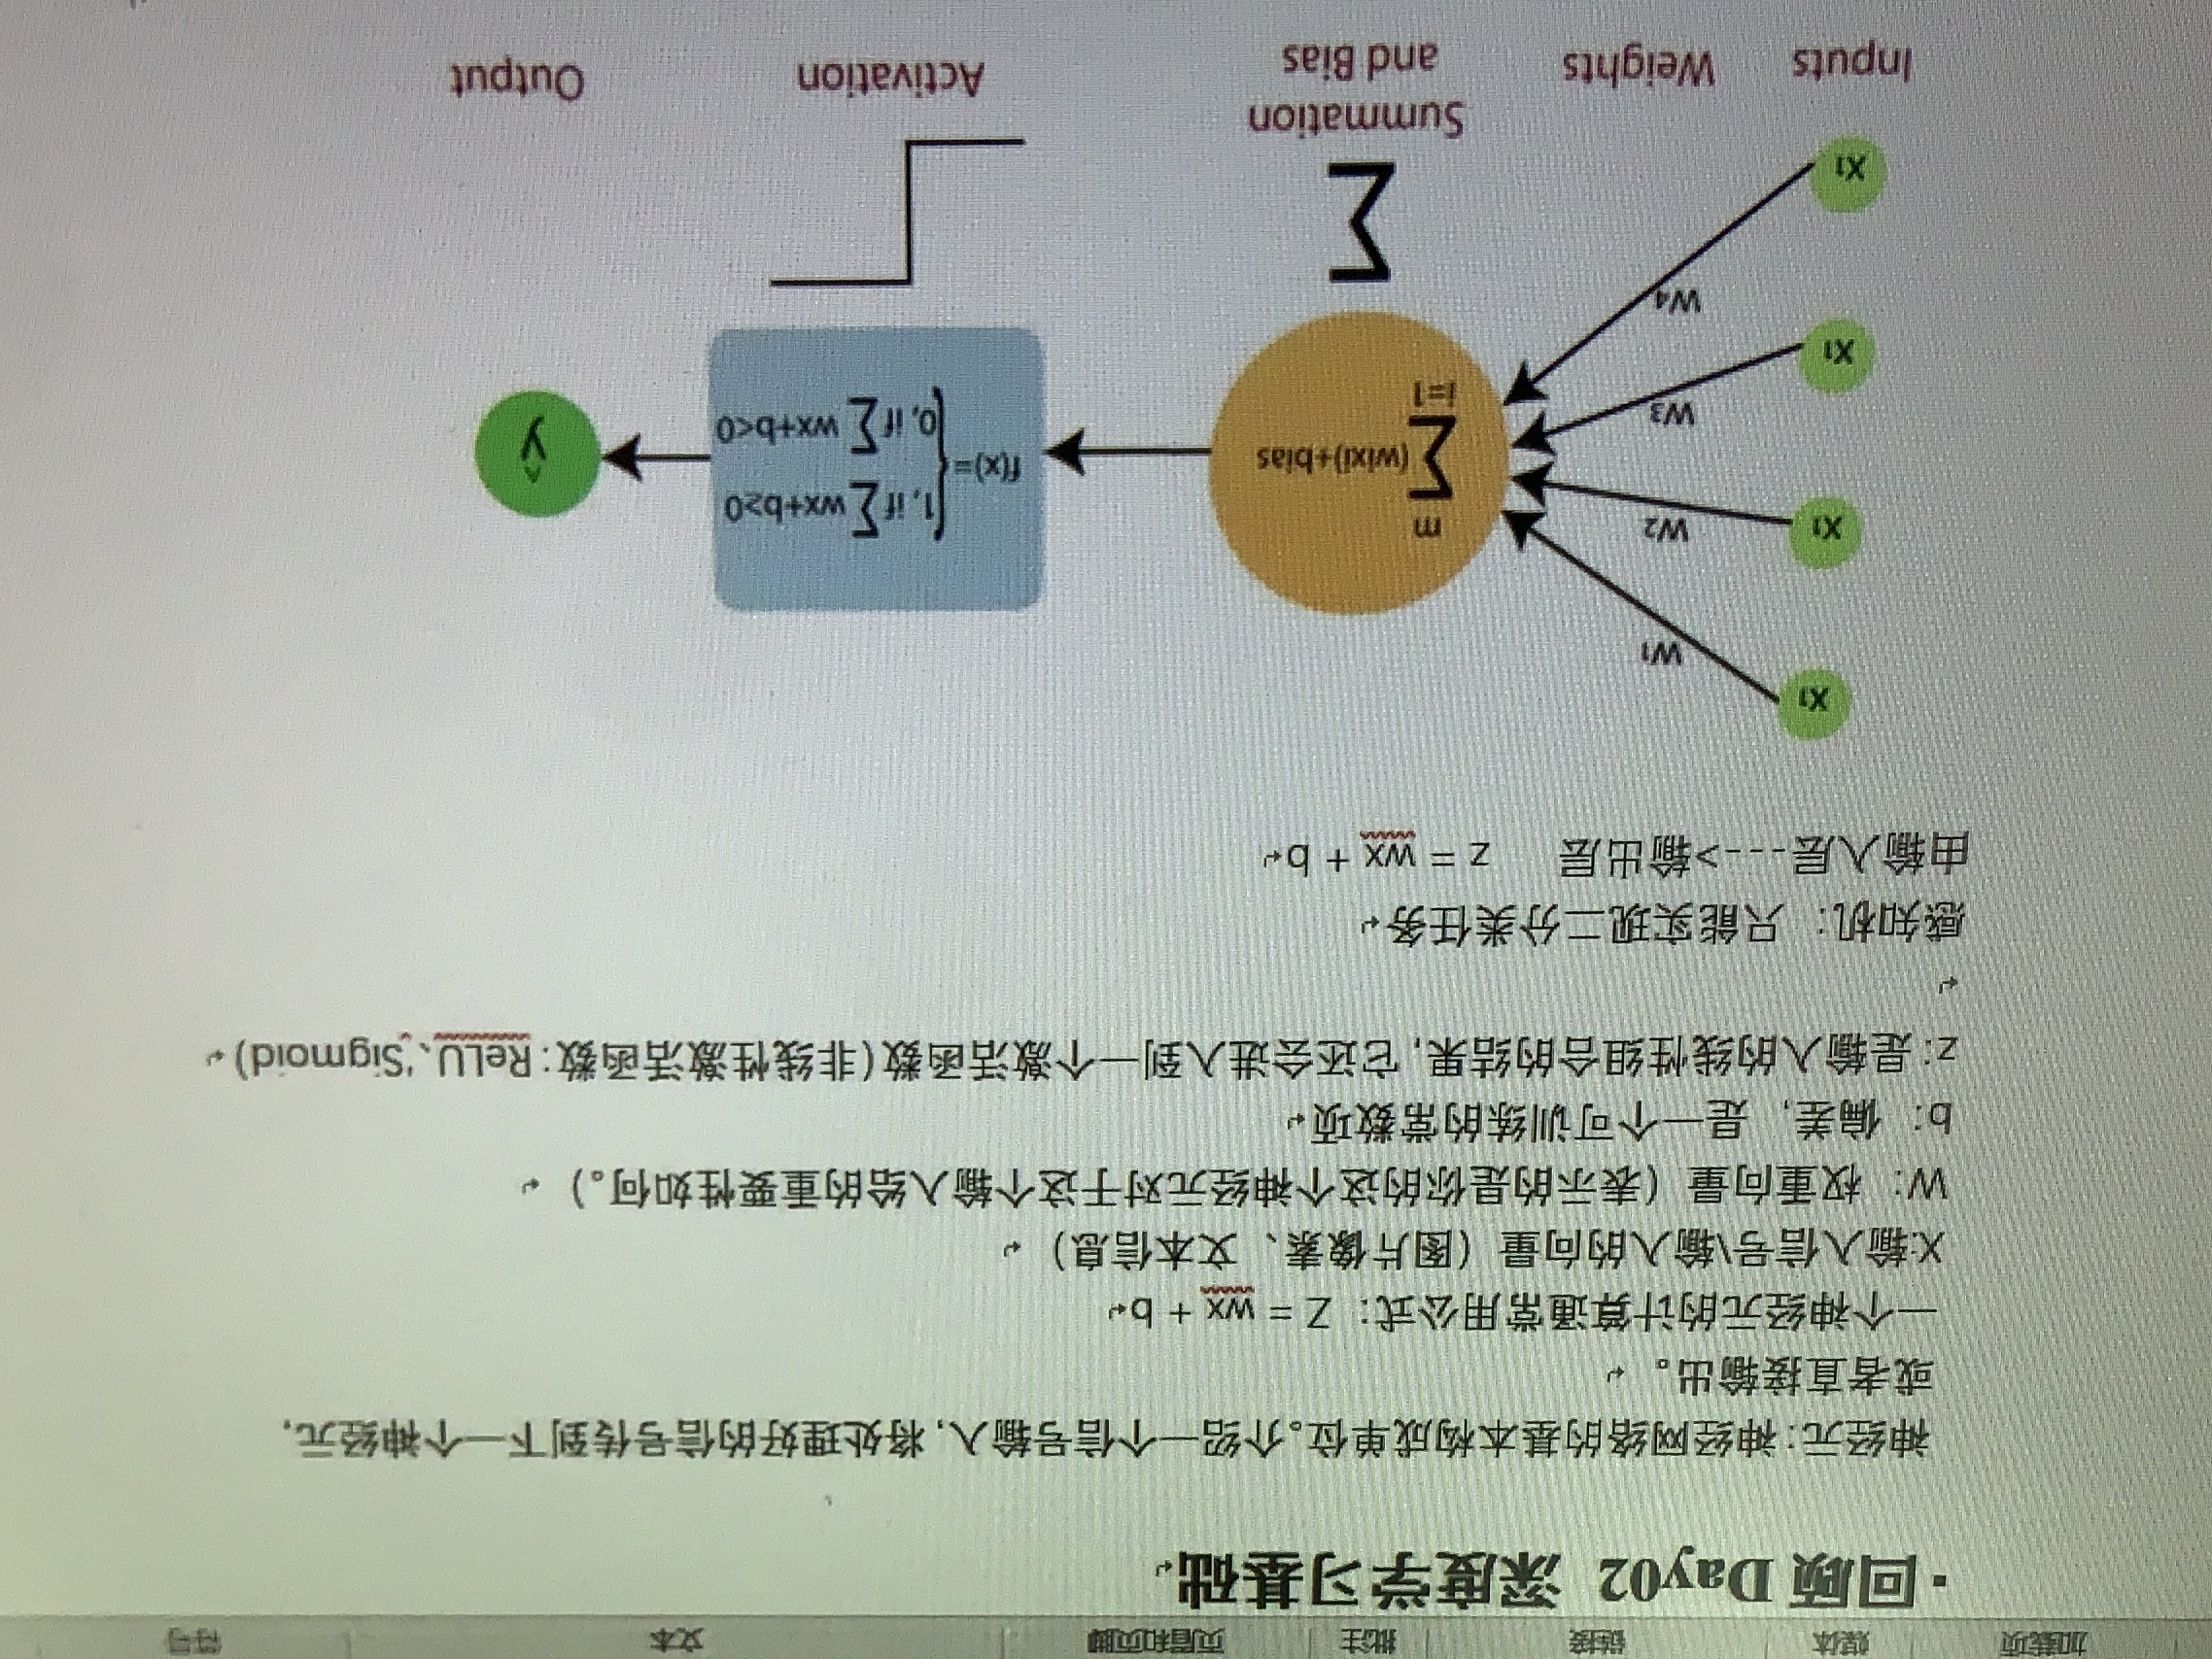
由于只记关键和不懂的部分 希望做到下次再看这部分笔记就记得 所以用词会非常简练 前向传播 输入数据依次经过模型的各层,按照各层定义的运算规则进行计算,最终得到模型预测输出的过程。 单向的信息流动,不涉及模型参数的更新。 助于思考的…...

多模态大语言模型arxiv论文略读(八十七)
MG-LLaVA: Towards Multi-Granularity Visual Instruction Tuning ➡️ 论文标题:MG-LLaVA: Towards Multi-Granularity Visual Instruction Tuning ➡️ 论文作者:Xiangyu Zhao, Xiangtai Li, Haodong Duan, Haian Huang, Yining Li, Kai Chen, Hua Ya…...

《棒球百科》长寿运动排名·棒球1号位
关于长寿运动的排名,运动长寿秘诀: 一、全球公认的「长寿运动」排名 游泳(低冲击、强化心肺) 快走/健走(每日30分钟降低15%早逝风险) 太极拳(平衡力减压,哈佛研究称可延缓衰老&am…...

Maven 项目打包时添加本地 Jar 包
在 Maven 项目开发中,我们经常会遇到需要引入本地 Jar 包的场景,比如使用未发布到中央仓库的第三方库、公司内部自定义工具包,或者处理版本冲突的依赖项。本文将详细介绍如何通过 Maven 命令将本地 Jar 包安装到本地仓库,并在项目…...

记录将网站从http升级https
http与https 你知道http是什么吗,那你知道https吗?在进行升级之前我们应该都听说http不安全,要用https,那你知道这是为什么吗? 什么是http? HTTP 是超文本传输协议,也就是HyperText Transfer…...

如何利用 ORM 框架有效防范 SQL 注入攻击
如何利用 ORM 框架有效防范 SQL 注入攻击 1. 引言 在现代 Web 开发中,SQL 注入攻击始终是数据库安全的一大隐患。攻击者利用不安全的 SQL 语句执行恶意操作,可能导致数据库泄露、篡改甚至被完全控制。幸运的是,ORM(对象关系映射)框架为开发者提供了一种更安全、更高效的…...

spark-shuffle 类型及其对比
1. Hash Shuffle 原理:将数据按照分区键进行哈希计算,将相同哈希值的数据发送到同一个Reducer中。特点:实现简单,适用于数据分布均匀的场景。但在数据分布不均匀时,容易导致某些Reducer处理的数据量过大,产…...
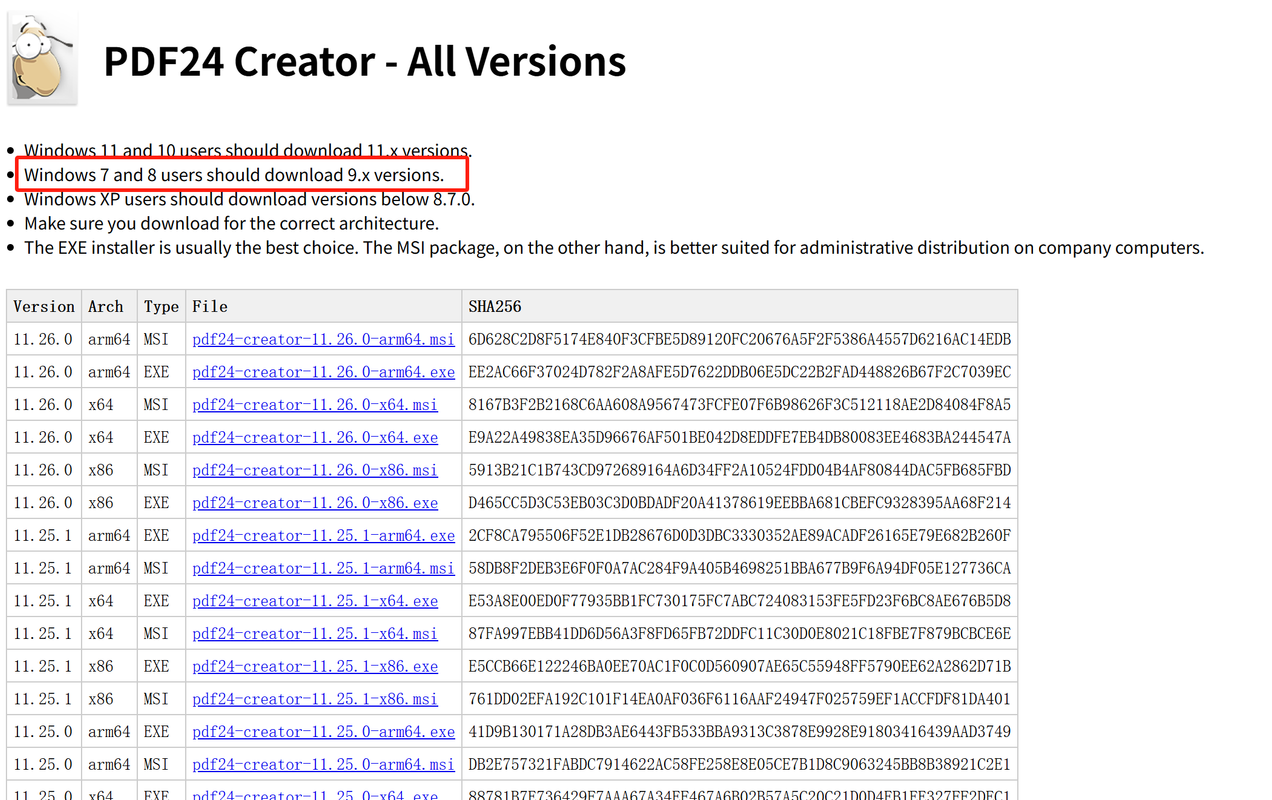
免费PDF工具-PDF24V9.16.0【win7专用版】
【百度】https://pan.baidu.com/s/1H7kvHudG5JTfxHg-eu2grA?pwd8euh 提取码: 8euh 【夸克】https://pan.quark.cn/s/92080b2e1f4c 【123】https://www.123912.com/s/0yvtTd-XAHjv https://creator.pdf24.org/listVersions.php...
:Python复刻「崩坏星穹铁道」嗷呜嗷呜事务所---源码级解析该小游戏背后的算法与设计模式【纯原创】)
游戏开发实战(二):Python复刻「崩坏星穹铁道」嗷呜嗷呜事务所---源码级解析该小游戏背后的算法与设计模式【纯原创】
文章目录 奇美拉和队列奇美拉被动技能多对多观察者关系实现自定义元类奇美拉基类 管理奇美拉的队列奇美拉队列类心得体会扩展 规则定义工作相关奇美拉相关 奇美拉属性 在本篇博文,我将介绍本项目的整体框架,以及“编码规则”,这些规则保证了本…...

人工智能发展
探秘人工智能领域的热门编程语言与关键知识 在当今科技飞速发展的时代,人工智能已渗透到生活的各个角落,从智能语音助手到精准的推荐系统,从自动驾驶汽车到医疗影像诊断,人工智能正以前所未有的速度改变着世界。而在这背后&#x…...

在Rockchip平台上利用FFmpeg实现硬件解码与缩放并导出Python接口
在Rockchip平台上利用FFmpeg实现硬件解码与缩放并导出Python接口 一、为什么需要硬件加速?二、[RK3588 Opencv-ffmpeg-rkmpp-rkrga编译与测试](https://hi20240217.blog.csdn.net/article/details/148177158)三、核心代码解释3.1 初始化硬件上下文3.2 配置解码器3.3 构建滤镜链…...

Flink集成资源管理器
Flink集成资源管理器 Apache Flink 支持多种资源管理器,主要包括以下几种: YARN ResourceManager :适用于使用 Hadoop YARN 作为资源管理器的环境。YARN ResourceManager 负责管理集群中的资源,包括 CPU、内存等,并…...
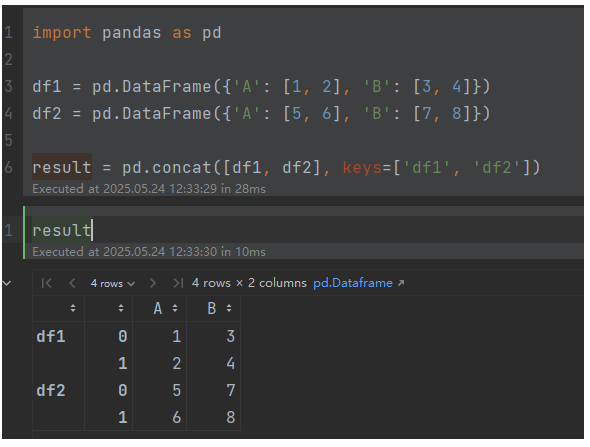
一周学会Pandas2 Python数据处理与分析-Pandas2数据合并与对比-pd.concat():轴向拼接
锋哥原创的Pandas2 Python数据处理与分析 视频教程: 2025版 Pandas2 Python数据处理与分析 视频教程(无废话版) 玩命更新中~_哔哩哔哩_bilibili 在数据分析中,数据往往分散在多个来源(如不同文件、数据库表或API),需…...

安卓原生兼容服务器
安卓原生兼容服务器的定义 安卓原生兼容服务器指基于Android系统内核和服务框架构建的服务器环境,能够在不依赖第三方适配层的情况下,直接运行符合Android API规范的服务程序,并满足与其他软硬件组件的协同工作需求。其核心特征体现在以下…...

优化用户体验:拦截浏览器前进后退、刷新、关闭、路由跳转等用户行为并弹窗提示
🧑💻 写在开头 点赞 收藏 学会🤣🤣🤣 需求 首先列举一下需要拦截的行为,接下来我们逐个实现。 浏览器前进后退标签页刷新和关闭路由跳转 1、拦截浏览器前进后退 这里的实现是核心,涉及到大…...

横川机器人驱动器导入参数教程
连接端口:有分220v和380v(刷新多次无效果就重新打开软件)升级固件:区分低压版和高压版导入参数:下载参数,下载成功后必须软重启,重新连接确认电机无干涉后相序测试 (等待10s&#x…...
大学生创新创业项目管理系统设计——数据库实验九
本实验为自己设计完成,我当年数据库实验得了94分 目录 1.实验目的 2.实验内容和要求 3.实验步骤 4.实验心得 实验九 数据库设计 1.实验目的 掌握数据库设计的过程和方法。 2.实验内容和要求 (35)大学生创新创业项目管理系统设计 一…...

电磁场与电场、磁场的关系
电磁场与电场、磁场之间存在着深刻的内在联系和统一性关系。这三者共同构成了电磁相互作用的基本框架,是理解电磁现象的关键所在。 电场和磁场实际上是电磁场的两个不同表现形式,它们既相互区别又密切联系。电场主要由静止电荷产生,表现为对…...
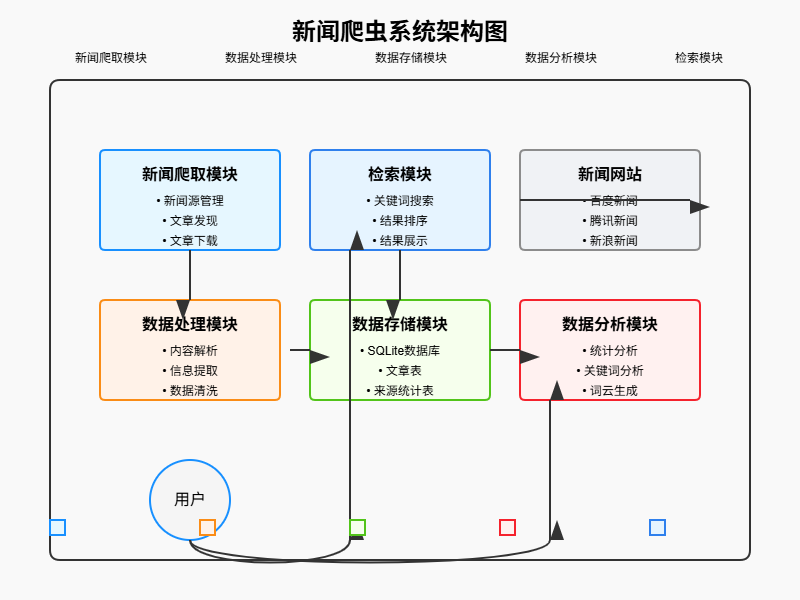
Python爬虫实战:研究Newspaper框架相关技术
1. 引言 1.1 研究背景与意义 互联网的快速发展使得新闻信息呈现爆炸式增长,如何高效地获取和分析这些新闻数据成为研究热点。新闻爬虫作为一种自动获取网页内容的技术工具,能够帮助用户从海量的互联网信息中提取有价值的新闻内容。本文基于 Python 的 …...
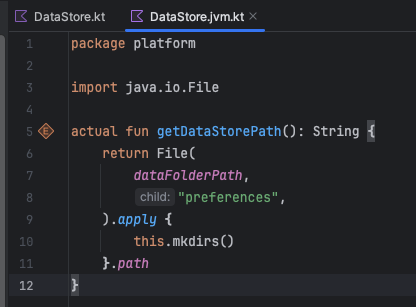
Kotlin MultiPlatform 跨平台版本的记账 App
前言 一刻记账 KMP (Kotlin MultiPlatform) 跨平台版本今天终于把 Android 和 iOS 进度拉齐了. 之前只有纯 Android 的版本. 最近大半年有空就在迁移代码到 KMP 上 中间学了 iOS 基础知识. xcode 的使用. 跨平台的架构的搭建… 感觉经历了很多很多. 一把辛酸泪 迁移的心路历…...
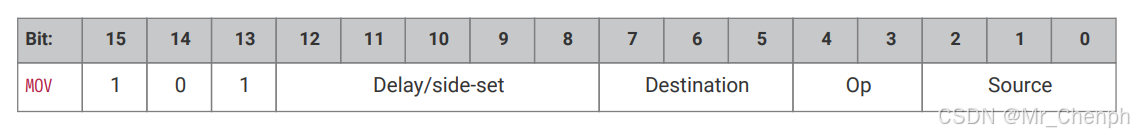
PIO 中的赋值魔术,MOV 指令
前言 在普通编程语言中,mov 可以理解为“赋值指令”,将一个值从一个地方拷贝到另一个地方。在 RP2040 的 PIO 汇编语言中,mov 同样是数据传递的关键指令,但它操作的是 PIO 独有的几个寄存器。 在 PIO 中,你可以用 mov …...

[docker]更新容器中镜像版本
从peccore-dev仓库拉取镜像 docker pull 10.12.135.238:8060/peccore-dev/configserver:v1.13.45如果报错,请参考docker拉取镜像失败,添加仓库地址 修改/etc/CET/Common/peccore-docker-compose.yml文件中容器的版本,为刚刚拉取的版本 # 配置中心confi…...
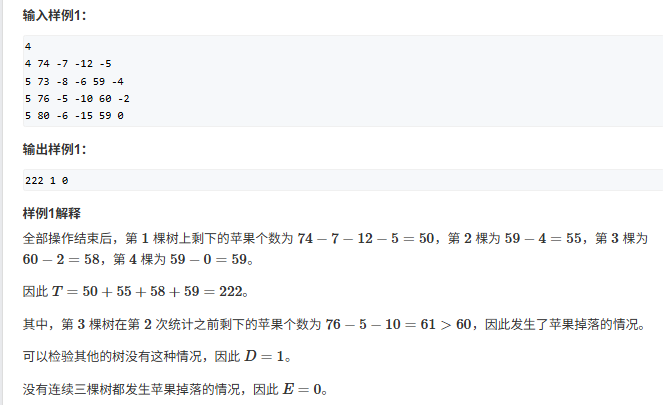
第十七次CCF-CSP算法(含C++源码)
第十七次CCF-CSP认证 小明种苹果AC代码 小明种苹果(续)AC代码 后面好难哈哈 小手冰凉 小明种苹果 输入输出: 题目链接 AC代码 #include<iostream> using namespace std; int n,m; int res,res3; int sum; int res21; int main(){cin …...