Prometheus学习之pushgateway和altermanager组件
[root@node-exporter41 /usr/local/alertmanager-0.28.1.linux-amd64]# pwd
/usr/local/alertmanager-0.28.1.linux-amd64[root@node-exporter41 /usr/local/alertmanager-0.28.1.linux-amd64]# cat alertmanager.yml
# 通用配置
global:resolve_timeout: 5msmtp_from: '914XXXXXX@qq.com'smtp_smarthost: 'smtp.qq.com:465'smtp_auth_username: '914XXXXXX@qq.com'smtp_auth_password: 'aalXXXjXXbXa'smtp_require_tls: falsesmtp_hello: 'qq.com'
# 定义路由信息
route:group_by: ['alertname']group_wait: 5sgroup_interval: 5srepeat_interval: 5mreceiver: 'sre_system'# 配置子路由routes:- receiver: 'sre_ops'match_re:job: linux96_ops_exporter# 建议将continue的值设置为true,表示当前的条件是否匹配,都将继续向下匹配规则# 这样做的目的是将消息发给最后的系统组(sre_system)continue: true- receiver: 'sre_k8s'match_re:job: linux96_k8s_exporter continue: true- receiver: 'sre_system'match_re:job: .*continue: true
# 定义接受者
receivers:
- name: 'sre_ops'email_configs:- to: '914XXXXX@qq.com'send_resolved: true- to: '914XXXXX@qq.com'send_resolved: true
- name: 'sre_k8s'email_configs:- to: '568XXXX@qq.com'send_resolved: true- to: '56XXXX@qq.com'send_resolved: true
- name: 'sre_system'email_configs:- to: '914XXXXX@qq.com'send_resolved: true- to: '56XXXXXX@qq.com'send_resolved: true
引言
在深入探索 Prometheus 的过程中,我们往往会对其核心组件有较为深入的了解,但与此同时,一些辅助组件也发挥着不可或缺的作用,它们就像是为整个监控系统增添羽翼的利器,让监控功能得以进一步拓展和完善。今天,我们就来聚焦于 Prometheus 生态系统中的两个重要组件 ——Pushgateway 和 Alertmanager,深入剖析它们的工作原理、应用场景以及与整个 Prometheus 监控体系的协同合作方式,一同揭开它们在监控领域所蕴含的巨大潜力和价值,为你的技术监控之旅增添新的助力和洞察。
一、背景
随着互联网行业的蓬勃发展,各种复杂的应用系统和微服务架构层出不穷,这些系统的正常运转对于企业的业务运营至关重要。为了确保这些系统能够以最佳状态持续运行,及时发现和解决潜在的问题,监控系统成为了不可或缺的基础设施。
Prometheus 作为一款开源的监控告警系统,以其强大的数据模型、灵活的查询语言(PromQL)以及高效的时序数据库等优势,在众多监控解决方案中脱颖而出。它采用拉取(Pull)模式来收集被监控目标的指标数据,这种模式在大多数场景下能够很好地工作,但在某些特殊场景,例如需要监控短生命周期的批处理任务、临时性的任务或者在防火墙受限的环境中等,仅仅依靠 Prometheus 的拉取模式就显得有些力不从心了,这就促使了 Pushgateway 这样一个组件的诞生,它允许客户端将指标数据推送到 Prometheus 中,从而弥补了拉取模式在这些特殊场景下的不足。
而另一方面,在监控过程中,当发现指标数据出现异常时,及时准确地发出告警通知对于快速响应和处理问题是至关重要的。虽然 Prometheus 自身具备一定的告警规则配置功能,但当涉及到复杂的告警通知策略、告警分组、抑制以及与多种通知渠道的集成等场景时,单独使用 Prometheus 的告警功能就会显得较为复杂和局限,此时 Alertmanager 便应运而生。它作为 Prometheus 的告警管理组件,专门负责处理来自 Prometheus Server 的告警信息,对告警进行分组、去重、抑制等处理,并能够根据预设的规则将告警通过多种方式(如邮件、Slack、PagerDuty 等)发送给相应的接收者,从而构建起一个完善且高效的告警通知体系。
通过对 Pushgateway 和 Alertmanager 这两个组件的深入学习和应用,我们能够使 Prometheus 监控系统在更多复杂多变的场景下发挥出更大的威力,为系统的稳定运行提供更加坚实可靠的保障。在接下来的博客内容中,我们将分别对这两个组件进行详细讲解,包括它们的安装部署、配置使用、实际案例分析等多个方面,希望能帮助你更好地掌握和运用这些强大的监控工具。
二、 Pushgateway组件部署
1. 下载软件包
部署pushgateway
[root@node-exporter41 ~]# wget https://github.com/prometheus/pushgateway/releases/download/v1.11.0/pushgateway-1.11.0.linux-amd64.tar.gz解压软件包
[root@node-exporter41 ~]# tar xf pushgateway-1.11.0.linux-amd64.tar.gz -C /usr/local/bin/ pushgateway-1.11.0.linux-amd64/pushgateway --strip-components=1
[root@node-exporter41 ~]#
[root@node-exporter41 ~]# ll /usr/local/bin/pushgateway
-rwxr-xr-x 1 1001 1002 20656129 Jan  9 22:36 /usr/local/bin/pushgateway*
[root@node-exporter41 ~]#
2. 运行pushgateway
[root@node-exporter41 ~]# pushgateway --web.telemetry-path="/metrics" --web.listen-address=:9091 --persistence.file=/data/pushgateway.data访问pushgateway的WebUI
http://10.0.0.41:9091/#
3. 使用pushgateway监控TCP的12种状态
[root@elk93 ~]# cat /usr/local/bin/tcp_status2.sh
#!/bin/bashpushgateway_url="http://10.0.0.41:9091/metrics/job/tcp_status"
time=$(date +%Y-%m-%d+%H:%M:%S)state="SYN-SENT SYN-RECV FIN-WAIT-1 FIN-WAIT-2 TIME-WAIT CLOSE CLOSE-WAIT LAST-ACK LISTEN CLOSING ESTAB"
for i in  $statedot=`ss -tan |grep $i |wc -l`echo tcp_connections{state=\""$i"\"} $t >>/tmp/tcp.txt
done;cat /tmp/tcp.txt | curl --data-binary @- $pushgateway_url
rm -rf  /tmp/tcp.txt
[root@elk93 ~]# 2.调用脚本
[root@elk93 ~]# bash /usr/local/bin/tcp_status2.sh
三、Alertmanager单机环境部署
1. 下载软件包
2.下载Alertmanager
wget https://github.com/prometheus/alertmanager/releases/download/v0.28.1/alertmanager-0.28.1.linux-amd64.tar.gz3.解压安装包
[root@node-exporter43 ~]# tar xf alertmanager-0.28.1.linux-amd64.tar.gz  -C /usr/local/
[root@node-exporter43 ~]#
2. 修改Alertmanager的配置文件
[root@node-exporter41 /usr/local/alertmanager-0.28.1.linux-amd64]# pwd
/usr/local/alertmanager-0.28.1.linux-amd64[root@node-exporter41 /usr/local/alertmanager-0.28.1.linux-amd64]# cat alertmanager.yml
# 通用配置
global:resolve_timeout: 5msmtp_from: '914@qq.com'smtp_smarthost: 'smtp.qq.com:465'smtp_auth_username: '914@qq.com'smtp_auth_password: 'ahjplbbja'smtp_require_tls: falsesmtp_hello: 'qq.com'
# 定义路由信息
route:group_by: ['alertname']group_wait: 5sgroup_interval: 5srepeat_interval: 5mreceiver: 'sre_system'# 配置子路由routes:- receiver: 'sre_ops'match_re:job: linux96_ops_exporter# 建议将continue的值设置为true,表示当前的条件是否匹配,都将继续向下匹配规则# 这样做的目的是将消息发给最后的系统组(sre_system)continue: true- receiver: 'sre_k8s'match_re:job: linux96_k8s_exporter continue: true- receiver: 'sre_system'match_re:job: .*continue: true
# 定义接受者
receivers:
- name: 'sre_ops'email_configs:- to: '914@qq.com'send_resolved: true- to: '914@qq.com'send_resolved: true
- name: 'sre_k8s'email_configs:- to: '5@qq.com'send_resolved: true- to: '5689@qq.com'send_resolved: true
- name: 'sre_system'email_configs:- to: '914@qq.com'send_resolved: true- to: '56@qq.com'send_resolved: true
3. 检查配置是否正确
[root@node-exporter41 /usr/local/alertmanager-0.28.1.linux-amd64]# ./amtool check-config alertmanager.yml
Checking 'alertmanager.yml'  SUCCESS
Found:- global config- route- 0 inhibit rules- 3 receivers- 0 templates
4. 启动Alertmanager服务并测试
[root@node-exporter43 alertmanager-0.28.1.linux-amd64]# ./alertmanager # 访问webUI测试
http://10.0.0.41:9093/#/status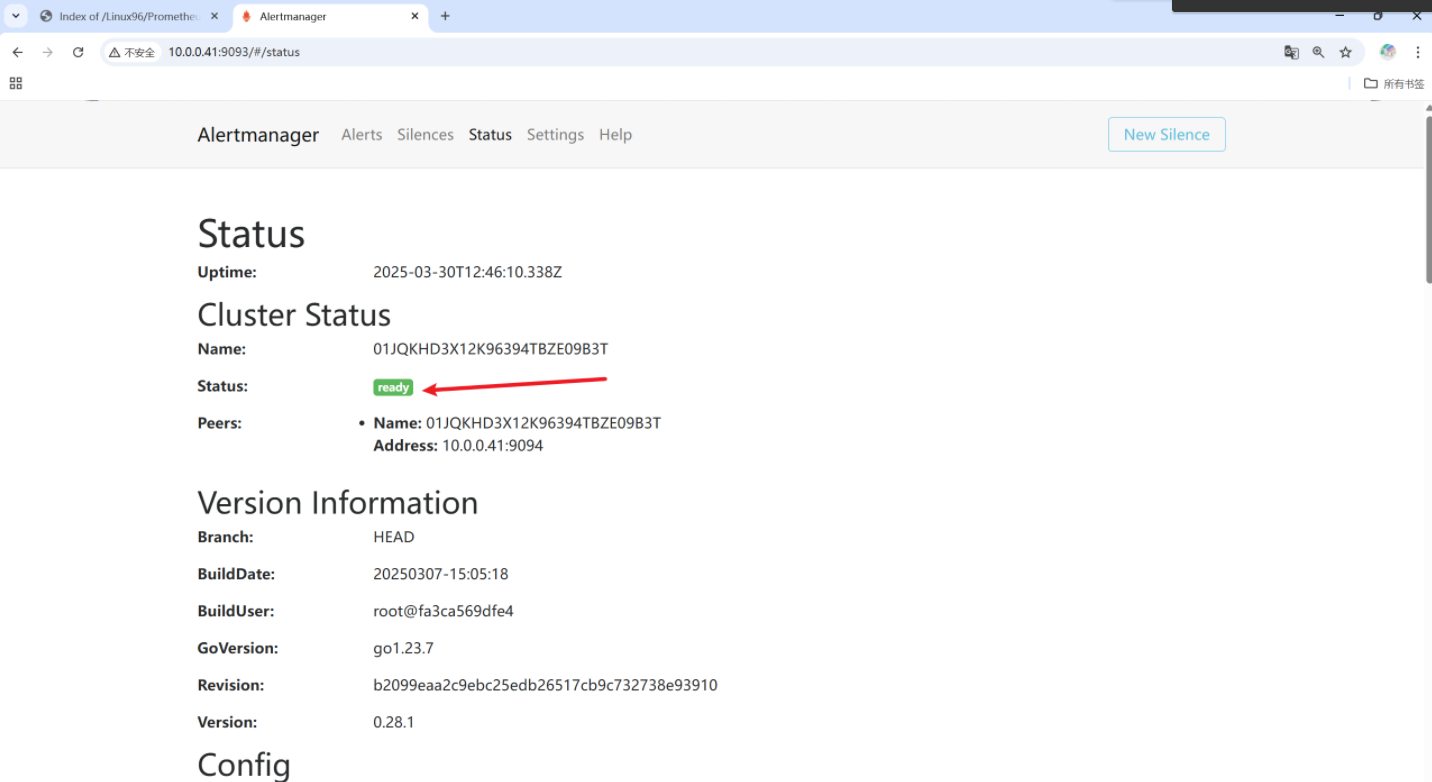
四、Prometheus server集成Alertmanager实现告警功能
1. 修改Prometheus配置文件,打开告警功能
[root@prometheus-server31 /softwares/prometheus-2.53.4.linux-amd64]# cat prometheus.yml
# my global config
global:scrape_interval: 3s # Set the scrape interval to every 15 seconds. Default is every 1 minute.evaluation_interval: 15s # Evaluate rules every 15 seconds. The default is every 1 minute.# scrape_timeout is set to the global default (10s).# Alertmanager configuration   ------------------->打开此alter的配置信息~~
alerting:alertmanagers:- static_configs:- targets:- 10.0.0.41:9093# Load rules once and periodically evaluate them according to the global 'evaluation_interval'.
rule_files:                   ------------------> 此配置是告警规则可以自定义# - "first_rules.yml"# - "second_rules.yml"- "linux96-rules.yml"# A scrape configuration containing exactly one endpoint to scrape:
# Here it's Prometheus itself.
scrape_configs:# The job name is added as a label `job=<job_name>` to any timeseries scraped from this config.- job_name: "prometheus"# metrics_path defaults to '/metrics'# scheme defaults to 'http'.static_configs:- targets: ["localhost:9090"]# 这里就是静态配置- job_name: "linux96_ops_exporter"static_configs:- targets:- 10.0.0.41:9100- job_name: "linux96_k8s_exporter"static_configs:- targets:- 10.0.0.42:9100- job_name: "whatever_job_exporter"static_configs:- targets:- 10.0.0.43:9100
2. 编写告警配置
[root@prometheus-server31 /softwares/prometheus-2.53.4.linux-amd64]# cat linux96-rules.yml
groups:
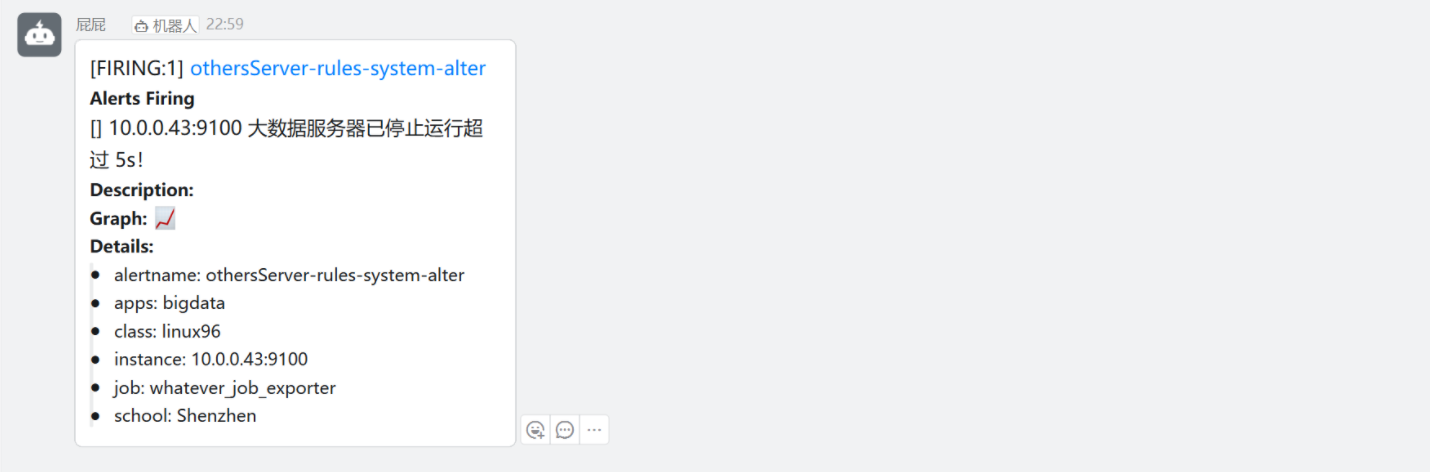
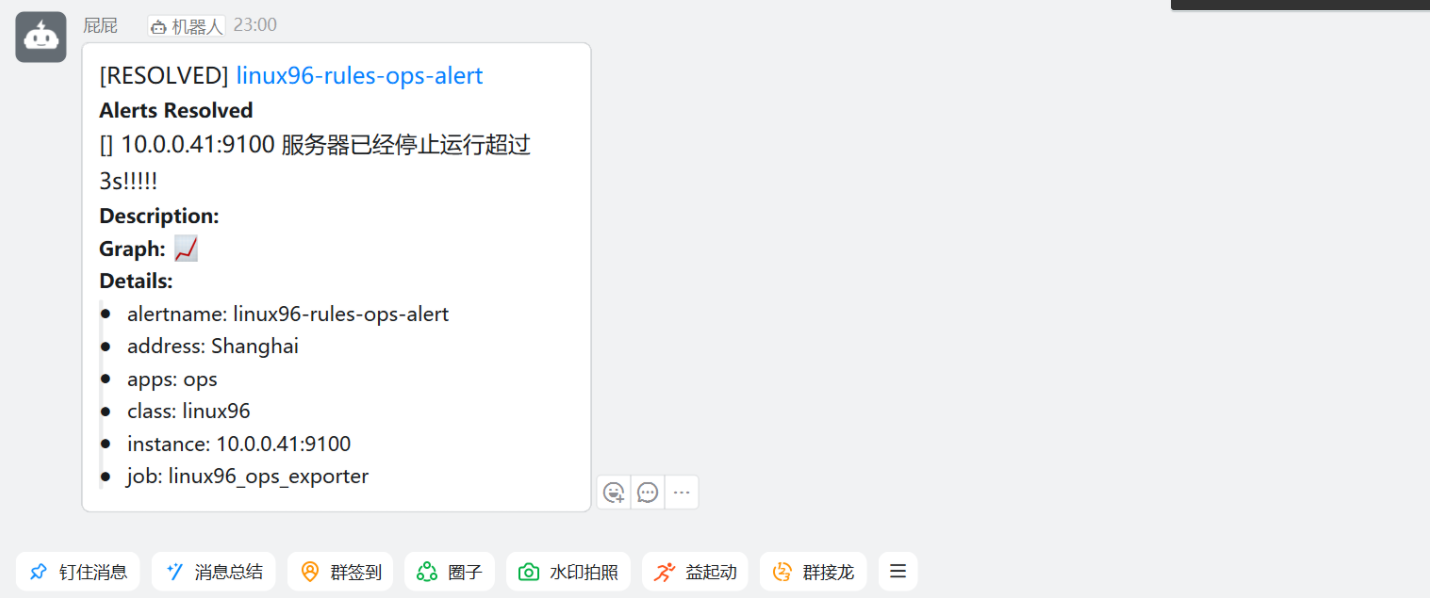
- name: linux96-rules-alertrules:- alert: linux96-rules-ops-alertexpr: up{job="linux96_ops_exporter"} == 0for: 3slabels:address: Shanghai class: linux96apps: opsannotations:summary: "{{ $labels.instance }} 服务器已经停止运行超过 3s!!!!!"- alert: linux96-rules-k8s-alterexpr: up{job="linux96_k8s_exporter"} == 0for: 3slabels:school: Beijingclass: linux96apps: k8sannotations:summary: "{{ $labels.instance }} K8S服务器已停止运行超过 3s!"- alert: othersServer-rules-system-alterexpr: up{job="whatever_job_exporter"} == 0for: 5slabels:school: Shenzhenclass: linux96apps: bigdataannotations:summary: "{{ $labels.instance }} 大数据服务器已停止运行超过 5s!"3. 检查配置文件语法并重新加载配置
[root@prometheus-server31 /softwares/prometheus-2.53.4.linux-amd64]# ./promtool check config prometheus.yml
Checking prometheus.ymlSUCCESS: 1 rule files foundSUCCESS: prometheus.yml is valid prometheus config file syntaxChecking linux96-rules.ymlSUCCESS: 3 rules found[root@prometheus-server31 /softwares/prometheus-2.53.4.linux-amd64]# ### 重新加载prometheus的配置
curl -X POST http://10.0.0.31:9090/-/reload
4. 触发告警功能
[root@node-exporter41 ~]# systemctl stop node-exporter.service
[root@node-exporter41 ~]# ss -ntl | grep 9100
[root@node-exporter41 ~]# [root@node-exporter42 ~]# systemctl stop  node-exporter.service
[root@node-exporter42 ~]#
[root@node-exporter42 ~]# ss -ntl | grep 9100
[root@node-exporter42 ~]# [root@node-exporter43 ~]# systemctl stop node-exporter.service
[root@node-exporter43 ~]#
[root@node-exporter43 ~]# ss -ntl | grep 9100
5. 查看alermanager的WebUI及邮箱接受者
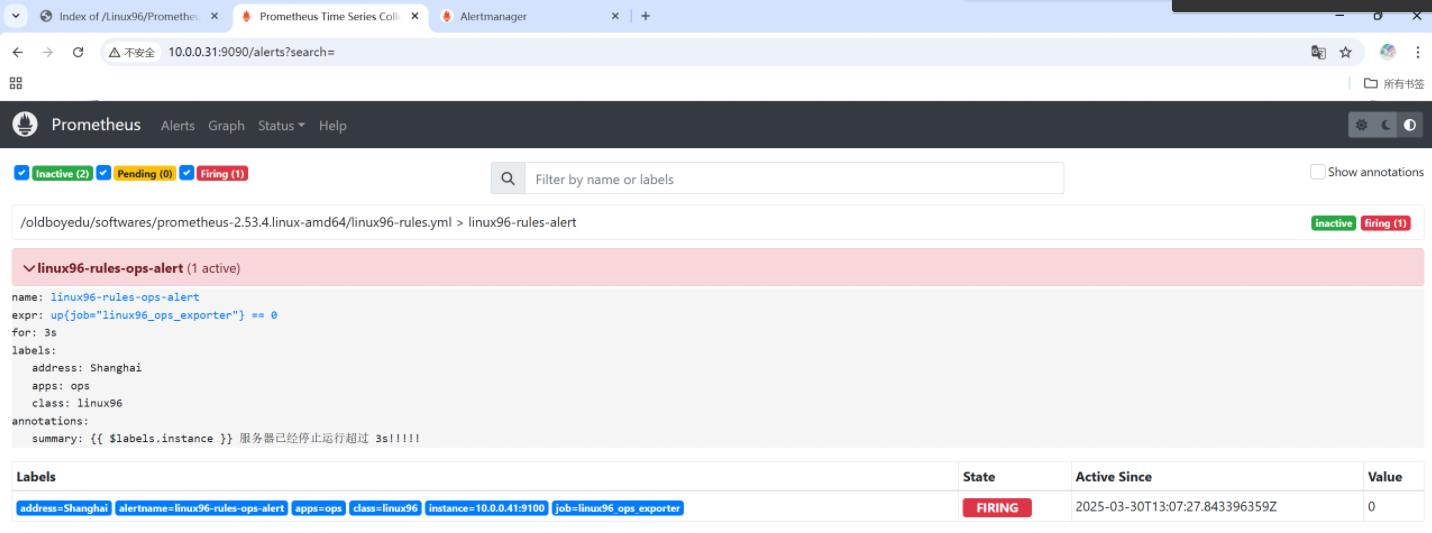
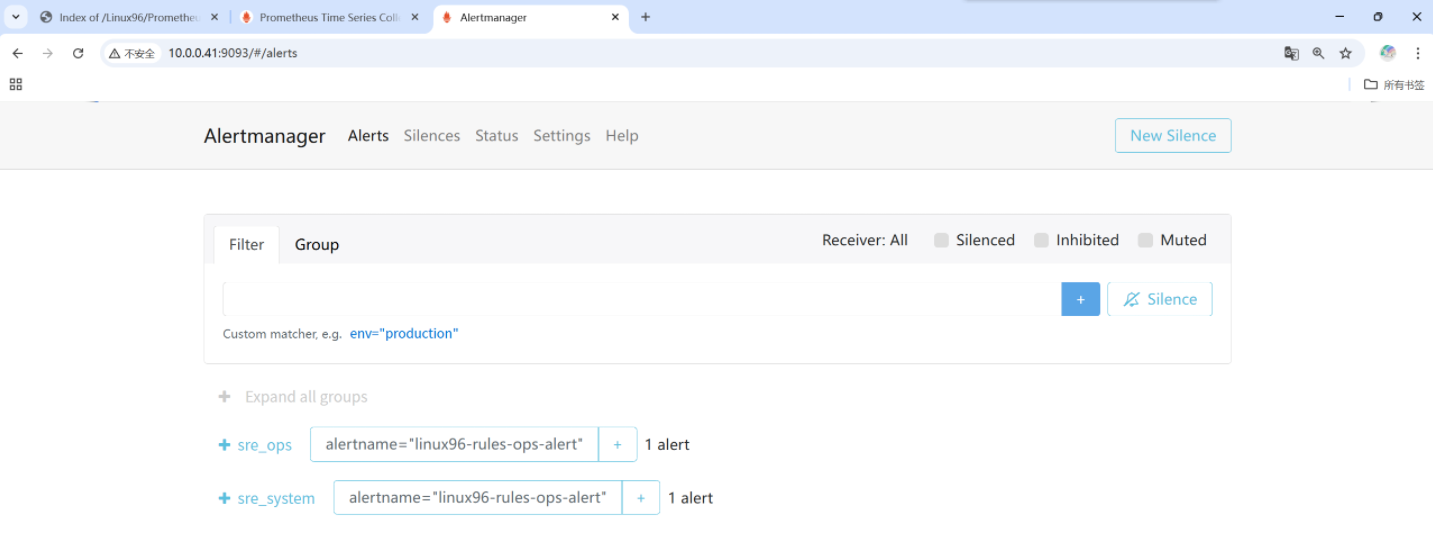

由此webUI可以发现我们的ops模块异常了
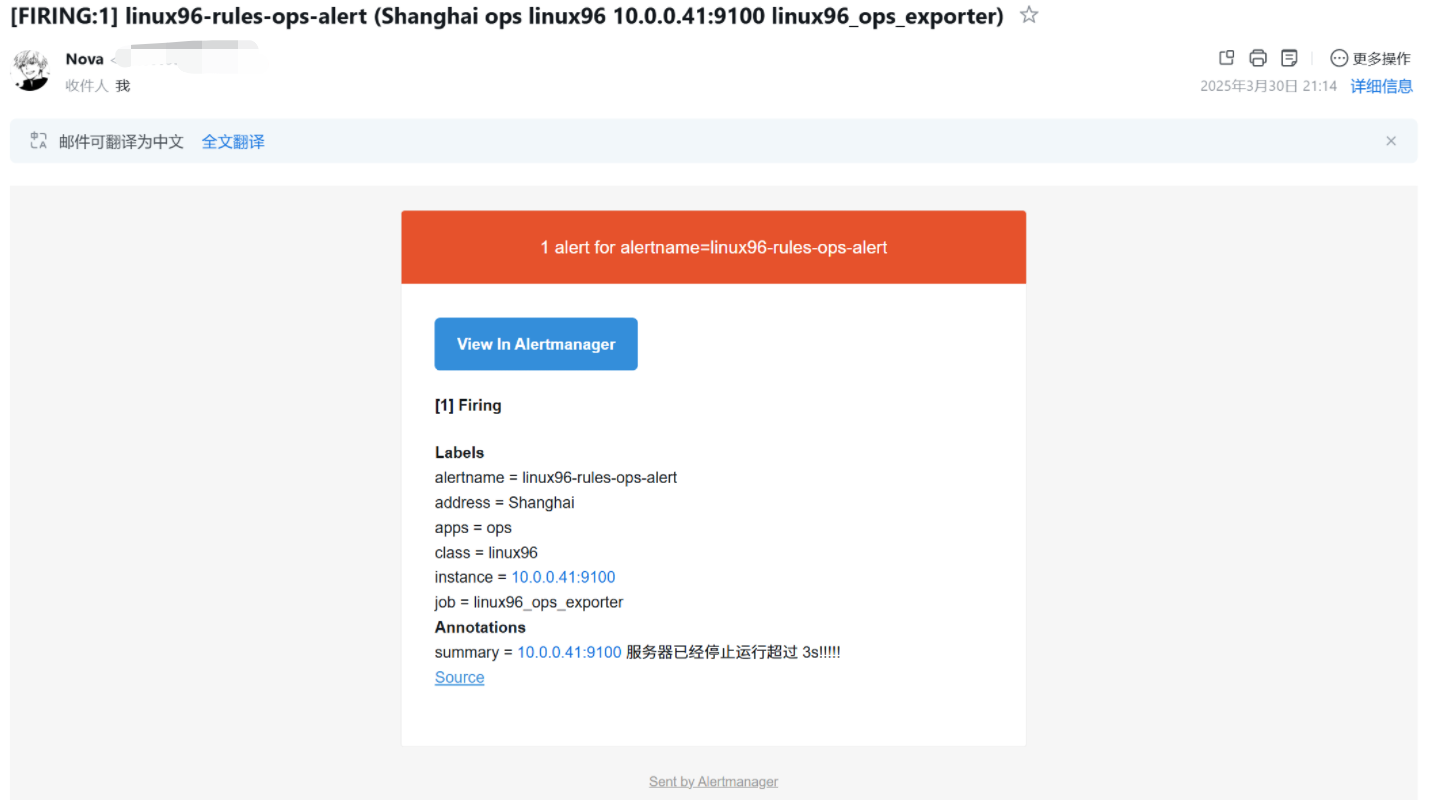
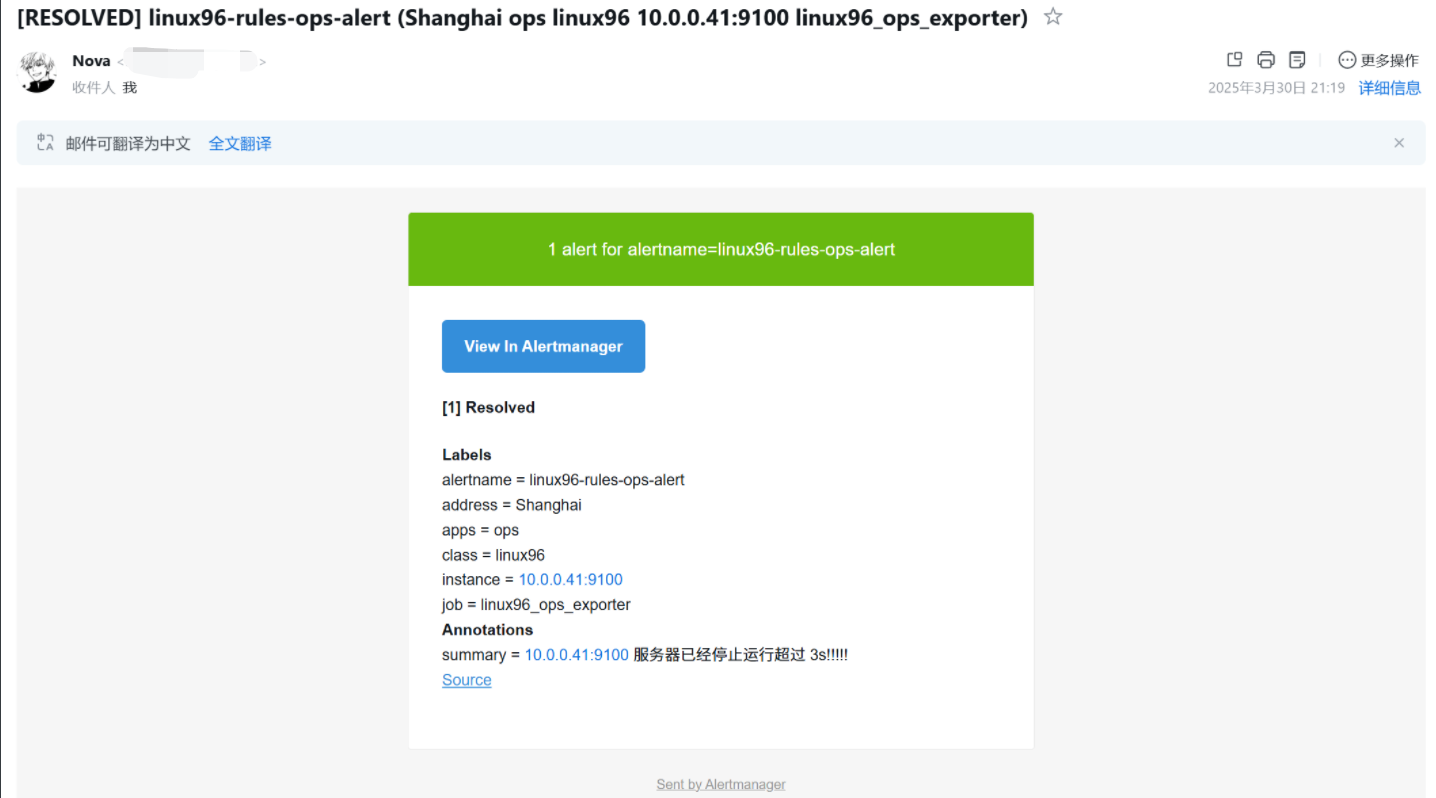
此时邮箱就会出现告警
 这时候我们去修复一下服务
[root@node-exporter41 /usr/local/alertmanager-0.28.1.linux-amd64]# systemctl start node-exporter.service
[root@node-exporter41 /usr/local/alertmanager-0.28.1.linux-amd64]# ss -ntl |grep 9100
LISTEN 0 4096 *:9100 *:* 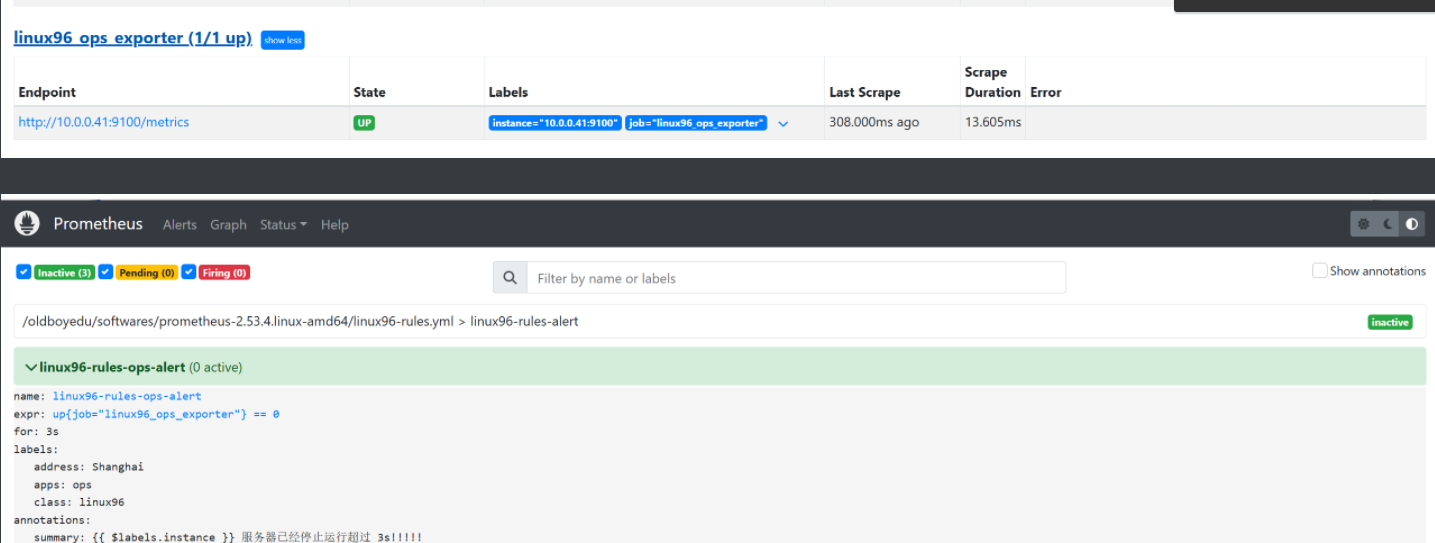
此时邮箱依旧会发送邮件告诉我们故障已解决
五、Alertmanager集成钉钉插件实现告警
参考链接:
https://github.com/timonwong/prometheus-webhook-dingtalk/
1.部署钉钉插件
	1.1 下载钉钉插件
wget https://github.com/timonwong/prometheus-webhook-dingtalk/releases/download/v2.1.0/prometheus-webhook-dingtalk-2.1.0.linux-amd64.tar.gz1.2 解压文件
[root@node-exporter43 ~]# tar xf prometheus-webhook-dingtalk-2.1.0.linux-amd64.tar.gz  -C /usr/local/
[root@node-exporter43 ~]#
[root@node-exporter43 ~]# cd /usr/local/prometheus-webhook-dingtalk-2.1.0.linux-amd64/
[root@node-exporter43 prometheus-webhook-dingtalk-2.1.0.linux-amd64]#
[root@node-exporter43 prometheus-webhook-dingtalk-2.1.0.linux-amd64]# ll
total 18752
drwxr-xr-x  3 3434 3434     4096 Apr 21  2022 ./
drwxr-xr-x 12 root root     4096 Mar 30 17:47 ../
-rw-r--r--  1 3434 3434     1299 Apr 21  2022 config.example.yml
drwxr-xr-x  4 3434 3434     4096 Apr 21  2022 contrib/
-rw-r--r--  1 3434 3434    11358 Apr 21  2022 LICENSE
-rwxr-xr-x  1 3434 3434 19172733 Apr 21  2022 prometheus-webhook-dingtalk*
[root@node-exporter43 prometheus-webhook-dingtalk-2.1.0.linux-amd64]# [root@node-exporter43 /usr/local/prometheus-webhook-dingtalk-2.1.0.linux-amd64]# cp config{.example,}.yml
[root@node-exporter43 /usr/local/prometheus-webhook-dingtalk-2.1.0.linux-amd64]# ll
total 18756
drwxr-xr-x  3 3434 3434     4096 Mar 30 13:47 ./
drwxr-xr-x 11 root root     4096 Mar 30 13:46 ../
-rw-r--r--  1 3434 3434     1299 Apr 21  2022 config.example.yml
-rw-r--r--  1 root root     1299 Mar 30 13:47 config.yml
drwxr-xr-x  4 3434 3434     4096 Apr 21  2022 contrib/
-rw-r--r--  1 3434 3434    11358 Apr 21  2022 LICENSE
-rwxr-xr-x  1 3434 3434 19172733 Apr 21  2022 prometheus-webhook-dingtalk*
[root@node-exporter43 /usr/local/prometheus-webhook-dingtalk-2.1.0.linux-amd64]#
2. 登录钉钉添加自定义机器人
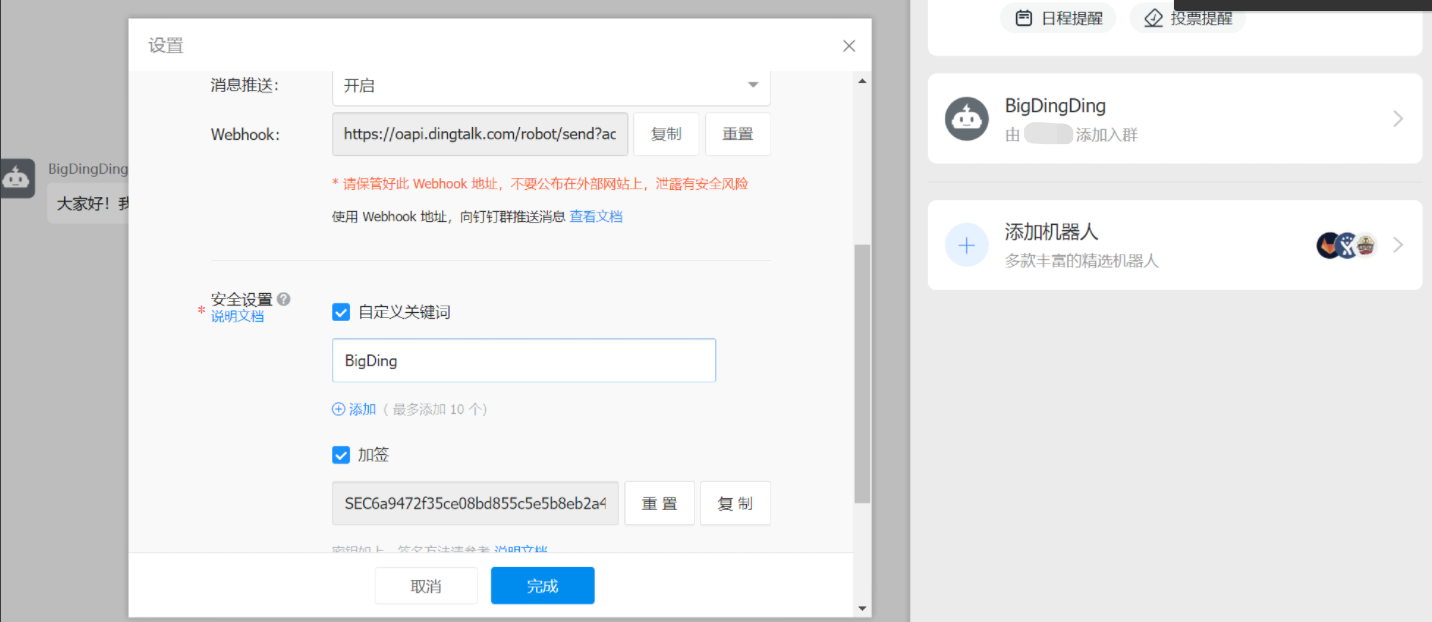
保存好配置文件信息
webhook地址:
https://oapi.dingtalk.com/robot/send?access_token=4b1f23e7286ebce1f626474534050d1cb3868f5055914d77d9217
加签信息:
SEC6a9472f35ce08bd855c5e5b8cf3b39fd57fdb99d650aa35786acd884b9e
3. 配置钉钉的config.yml
[root@node-exporter43 /usr/local/prometheus-webhook-dingtalk-2.1.0.linux-amd64]# vim config.yml
## Request timeout
.....
### 配置钉钉的config.yml
## Targets, previously was known as "profiles"
targets:webhook1:url: https://oapi.dingtalk.com/robot/send?access_token=4b1f23e7286ebce1f624dff7c4eb236474534050d1cb3868f5055914d77d9217# secret for signaturesecret: SEC6a9472f35ce08bd855c5e5b8eb2a4cf3b39fd57fdb99d650aa35786acd884b9e
.....
当前只要一个自定触发的钩子,如果有多个可以继续写
4. 启动钉钉
[root@node-exporter43 /usr/local/prometheus-webhook-dingtalk-2.1.0.linux-amd64]# ./prometheus-webhook-dingtalk --web.listen-address="10.0.0.43:8060"
..........
这里有URL和一些messages
ts=2025-03-30T14:07:59.409Z caller=main.go:97 level=info component=configuration msg="Loading templates" templates=
ts=2025-03-30T14:07:59.410Z caller=main.go:113 component=configuration msg="Webhook urls for prometheus alertmanager" urls=http://10.0.0.43:8060/dingtalk/webhook1/send
ts=2025-03-30T14:07:59.411Z caller=web.go:208 level=info component=web msg="Start listening for connections" address=10.0.0.43:8060
5. Alertmanager集成钉钉插件
[root@node-exporter41 /usr/local/alertmanager-0.28.1.linux-amd64]# vim alertmanager.yml .....### 添加此配置- name: 'sre_system'webhook_configs:# 指向的是DingDing的插件地址- url: 'http://10.0.0.43:8060/dingtalk/webhook1/send'http_config: {}max_alerts: 0send_resolved: true#- name: 'sre_system'#  email_configs:#  - to: '94@qq.com'#    send_resolved: true#    headers: { Subject: "[WARN] LINUX96报警邮件" }
"alertmanager.yml" 76L, 2274B written
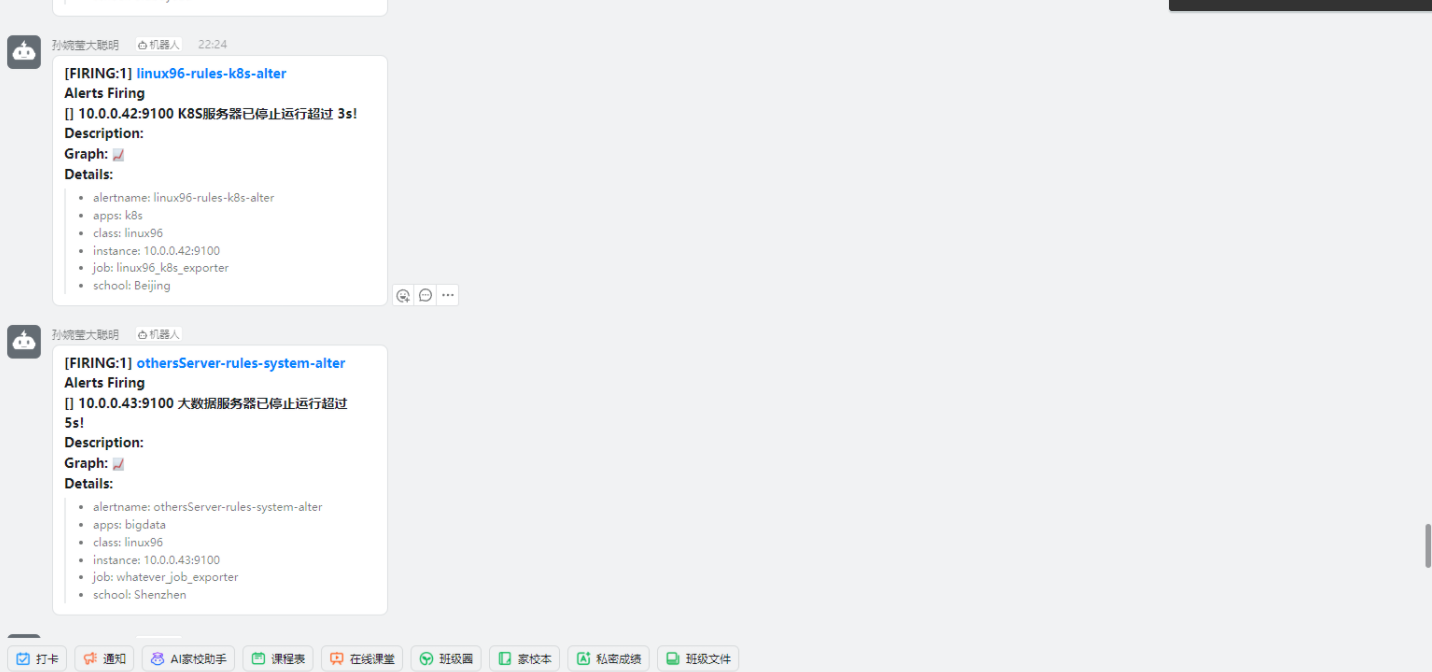
6. 测试
[root@node-exporter43 ~]# systemctl stop node-exporter.service
[root@node-exporter43 ~]#
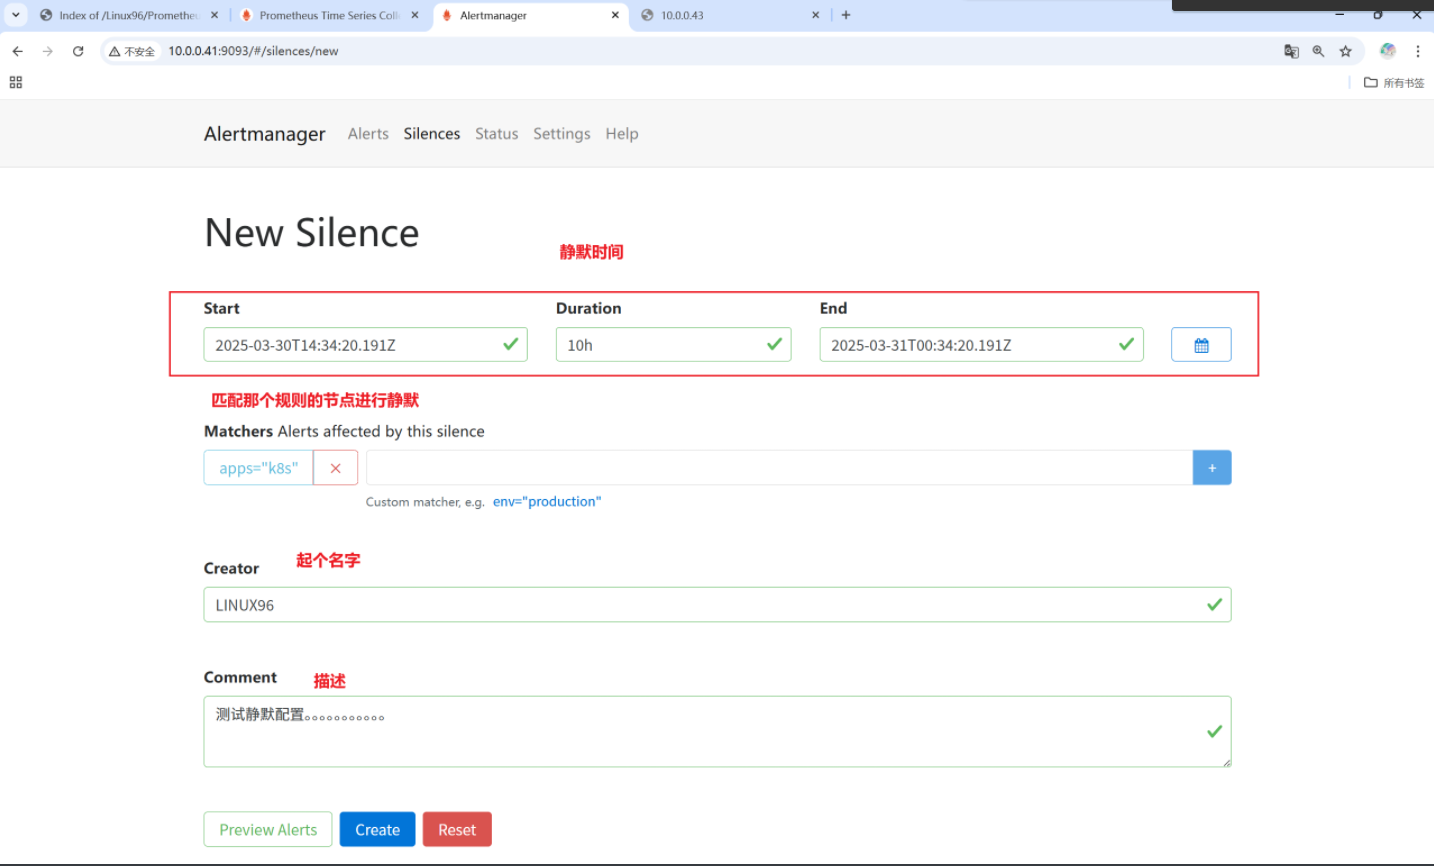
六. Alertmanager的告警静默(Silence)
1.告警静默(Silence)
一般用于系统维护,预期要做的操作,这意味着就没有必要告警。比如系统升级,需要8h,在这8h过程中,就可以考虑先不用告警。

这时候就可以说明当前标签为K8S规则的节点正在静默,所以他即使有问题也不会报警,相反其他节点就可以正常。
测试
[root@node-exporter42 ~]# systemctl stop node-exporter.service
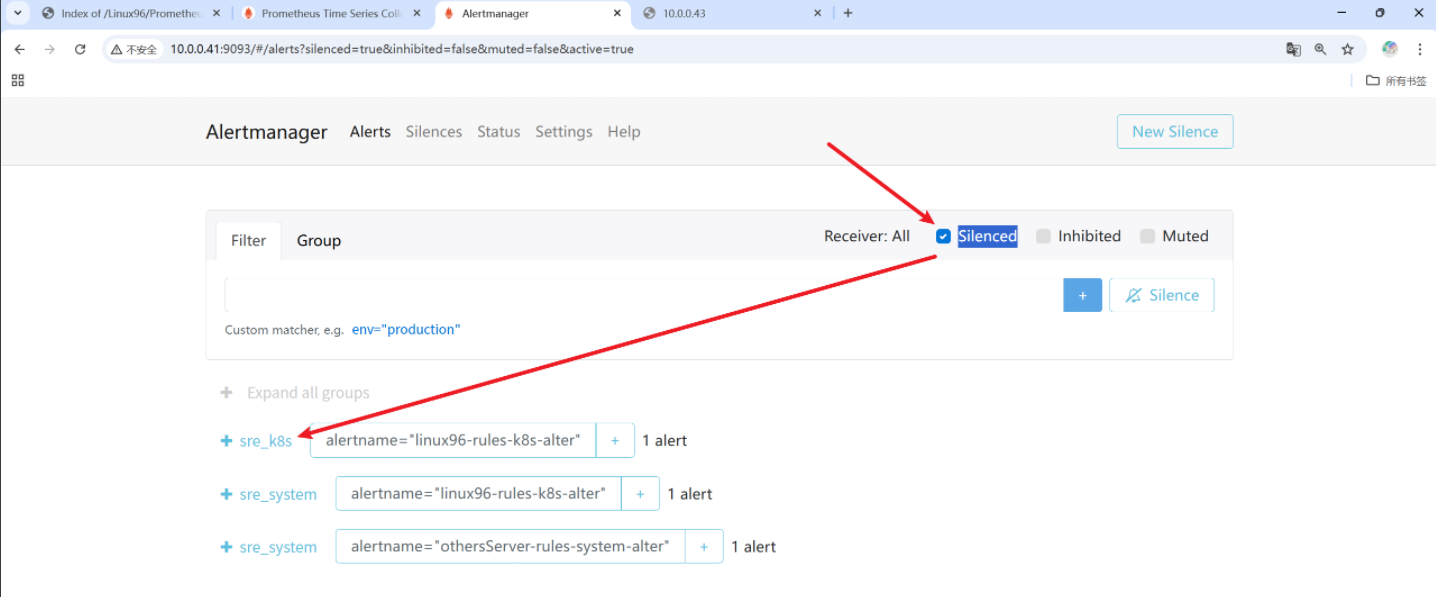
[root@node-exporter43 ~]# systemctl stop node-exporter.service 我们就可以看到42的k8s的警告就被静默了,但是43还是正常报警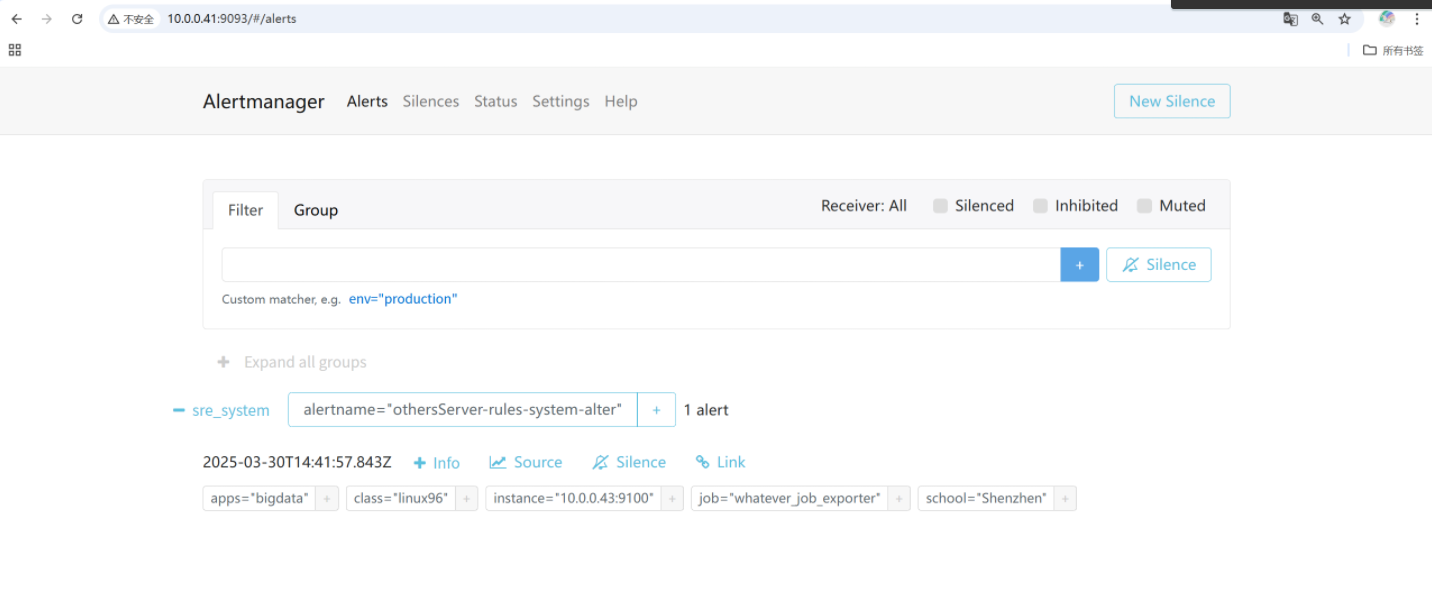 打开静默就发现了K8S
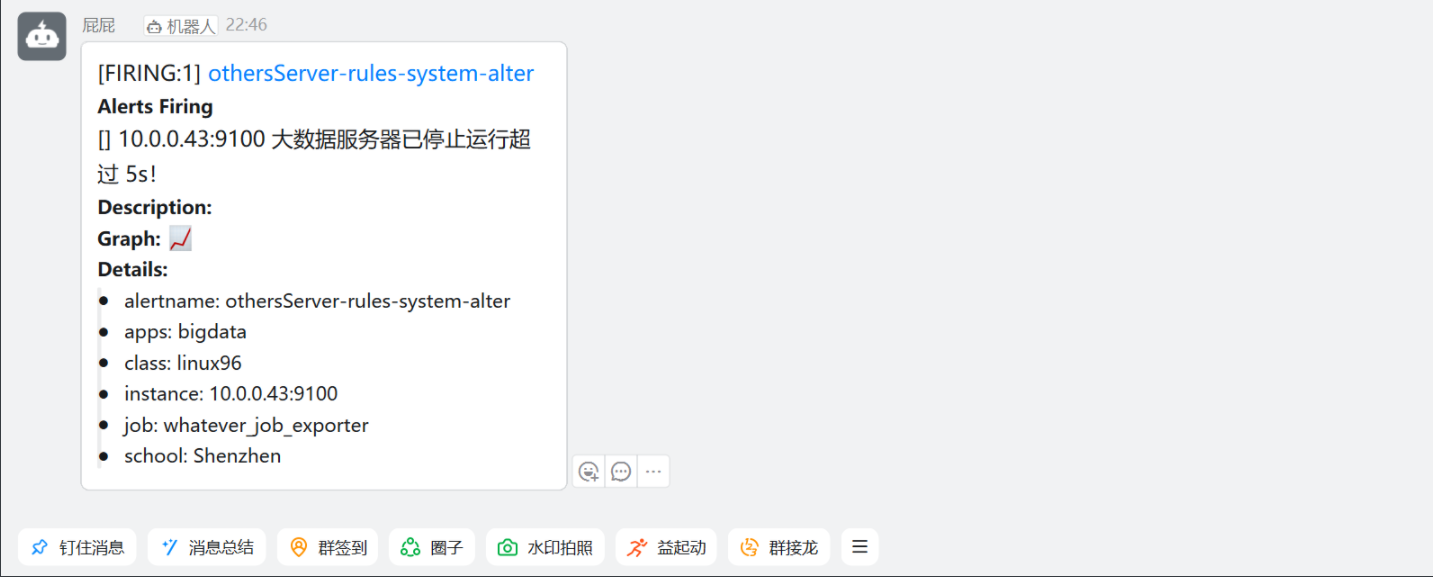
机器人的报警也是一样的
没有k8s标签的警告
恢复节点
[root@node-exporter42 ~]# systemctl start node-exporter.service
[root@node-exporter43 ~]# systemctl start node-exporter.service 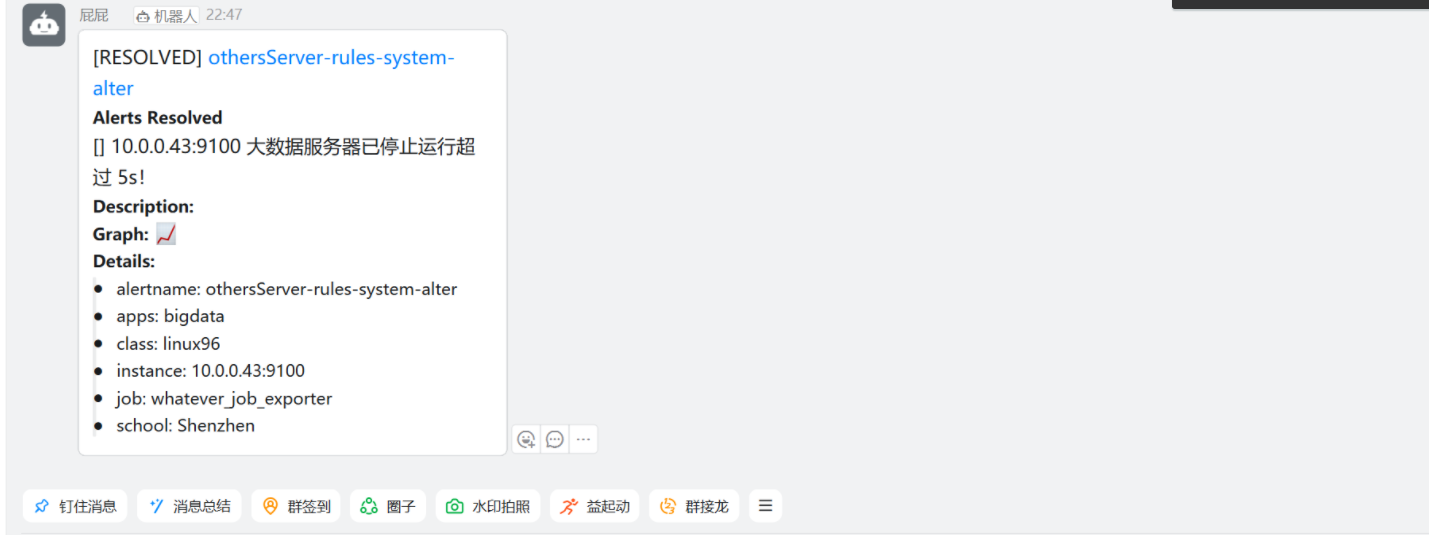
七、Alertmanager的告警抑制(inhibit)
1.什么是告警抑制
说白了,就是抑制告警,和静默不同的是,抑制的应用场景一般用于抑制符合条件的告警。举个例子:
一个数据中心有800台服务器,每台服务器有50个监控项,假设一个意味着有4w个监控告警。
如果数据中心端点,理论上来说就会有4w条告警发送到你的手机,你是处理不过来的,所以我们只需要将数据中心断电的告警发出来即可。
1. Prometheus编写规则
### 主要添加severity: criticaldc: beijing
这两行,标志着报警的级别和(可以理解为)标签[root@prometheus-server31 /softwares/prometheus-2.53.4.linux-amd64]# vim linux96-rules.yml
- name: linux96-rules-alertrules:
groups:
- name: linux96-rules-alertrules:- alert: linux96-rules-ops-alertexpr: up{job="linux96_ops_exporter"} == 0for: 3slabels:address: Shanghaiclass: linux96apps: opsseverity: criticaldc: beijingannotations:summary: "{{ $labels.instance }} 服务器已经停止运行超过 3s!!!!!"- alert: linux96-rules-k8s-alterexpr: up{job="linux96_k8s_exporter"} == 0for: 3slabels:school: Beijingclass: linux96apps: k8sseverity: warningdc: beijingannotations:summary: "{{ $labels.instance }} K8S服务器已停止运行超过 3s!"- alert: othersServer-rules-system-alterexpr: up{job="whatever_job_exporter"} == 0for: 5slabels:school: Shenzhenclass: linux96apps: bigdataseverity: warningdc: Shenzhenannotations:summary: "{{ $labels.instance }} 大数据服务器已停止运行超过 5s!"
"linux96-rules.yml" 36L, 981B written
2. Alertmanager配置告警抑制规则
......
### 在最后加入
## 配置告警抑制规则
inhibit_rules:# 如果"dc"的值相同的前提条件下。#	则当触发了"severity: critical"告警,就会抑制"severity: warning"的告警信息。
- source_match:severity: criticaltarget_match:severity: warningequal:- dc
3. 启动Alertmanager&&DingDing
[root@node-exporter43 prometheus-webhook-dingtalk-2.1.0.linux-amd64]# ./prometheus-webhook-dingtalk --web.listen-address="10.0.0.43:8060" [root@node-exporter43 alertmanager-0.28.1.linux-amd64]# ./alertmanager 4. 停止服务在钉钉验证
[root@node-exporter41 ~]# systemctl stop node-exporter.service
[root@node-exporter42 ~]# systemctl stop node-exporter.service
### 这里故意停止了相同的equal指标但是警告等级不一样,这时候只会报警我们警告时(灾难)严重级别的节点信息。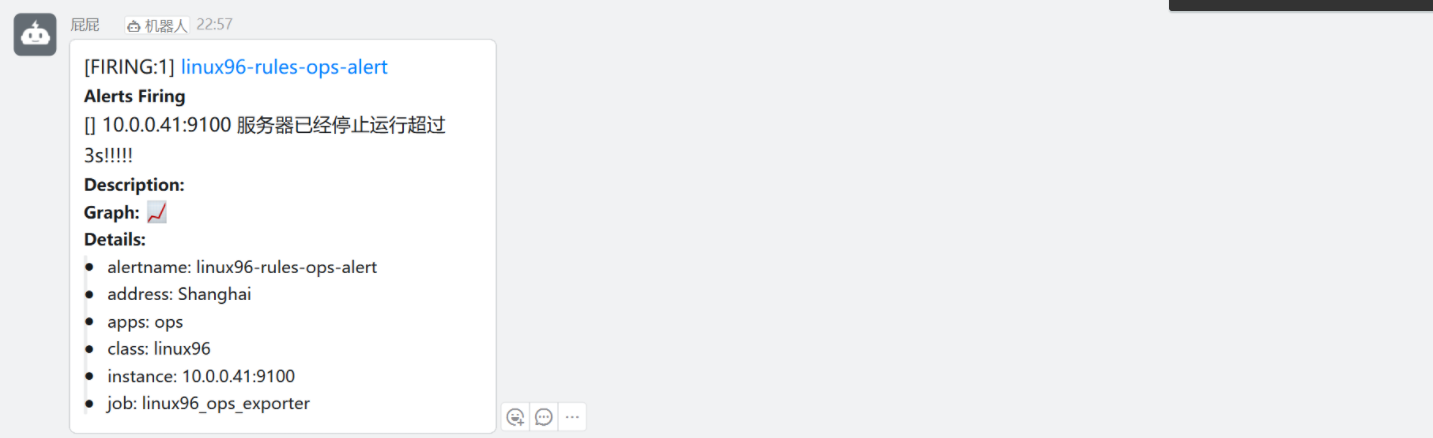
[root@node-exporter43 ~]# systemctl stop node-exporter.service
再停止一个43节点不同equal指标的,当然就可以正常通知了
5. 恢复测试
如果恢复了就正常恢复报警
[root@node-exporter41 ~]# systemctl start node-exporter.service
[root@node-exporter42 ~]# systemctl start node-exporter.service
[root@node-exporter43 ~]# systemctl start node-exporter.service
八、总结
在本博客中,我们深入探讨了 Prometheus 生态系统中的两个重要组件 ——Pushgateway 和 Alertmanager。通过学习和实践,我们了解到 Pushgateway 在特殊场景下(如短生命周期任务、防火墙限制等)弥补了 Prometheus 拉模式的不足,能够接收客户端推送的指标数据并临时存储,以便 Prometheus Server 进行拉取监控。我们还了解到 Alertmanager 的强大功能,它负责处理来自 Prometheus Server 的告警信息,实现了告警的分组、去重、抑制以及灵活的通知方式,使得告警系统更加高效和智能。
同时,我们还通过示例脚本的讲解,掌握了如何利用 Pushgateway 来推送自定义的 TCP 连接状态指标数据,进一步拓展了 Prometheus 的监控能力。理解并熟练运用 Pushgateway 和 Alertmanager 这两个组件,对于我们构建一个完整、高效、可靠的监控告警体系具有重要意义,能够更好地保障系统的稳定运行和及时响应问题。
相关文章:
Prometheus学习之pushgateway和altermanager组件
[rootnode-exporter41 /usr/local/alertmanager-0.28.1.linux-amd64]# pwd /usr/local/alertmanager-0.28.1.linux-amd64[rootnode-exporter41 /usr/local/alertmanager-0.28.1.linux-amd64]# cat alertmanager.yml # 通用配置 global:resolve_timeout: 5msmtp_from: 914XXXXX…...
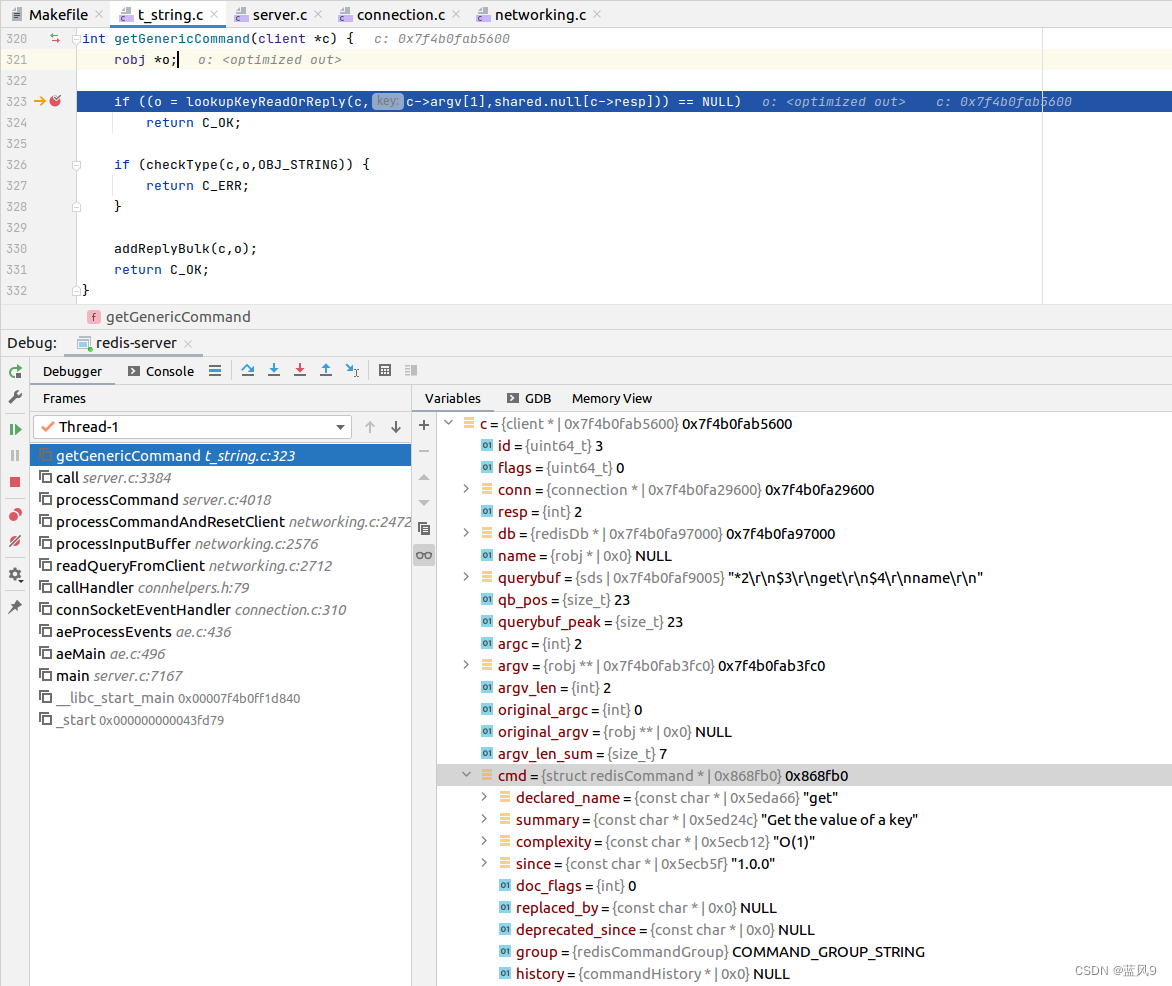
01 redis 的环境搭建
前言 这一系列文章主要包含的内容主要是 各种常用软件的调试环境的搭建 主要的目的是 搭建一个可打断点的一个调试环境 c 系列 主要是基于 clion 调试, java 系列主要是基于 idea 调试, js 系列主要是基于 webstorm 调试 需要有一定的 c, c, java, js 相关基础 基于的…...
《操作系统真相还原》——加载器
显存 将上一章的中断输出,变为显存输出 加载器 使用mbr引导程序从磁盘中加载loader程序。 MBR %include "boot.inc" SECTION MBR vstart0x7c00 mov ax,cs mov ds,axmov es,axmov ss,axmov fs,axmov sp,0x7c00mov ax,0xb800mov gs,ax;cl…...

电网即插即用介绍
一、统一设备信息模型与标准接口 实现即插即用功能的基础在于建立统一的设备信息模型。不同厂家生产的各类电网设备,其内部结构、通信协议、数据格式等往往千差万别。通过制定统一的设备信息模型,能够对设备的各种属性、功能以及接口进行标准化定义&…...
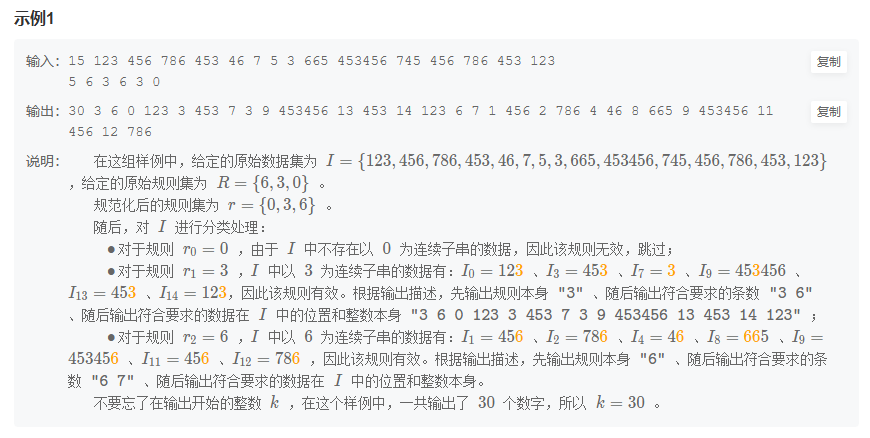
HJ25 数据分类处理【牛客网】
文章目录 零、原题链接一、题目描述二、测试用例三、解题思路四、参考代码 零、原题链接 HJ25 数据分类处理 一、题目描述 二、测试用例 三、解题思路 基本思路: 首先理解题目,题目要求对规则集先进行排序,然后去重,这一步我…...

spring-boot redis lua脚本实现滑动窗口限流
因为项目中没有集成redisson,但是又需要用到限流,所以简单的将redisson中限流的核心lua代码移植过来,并进行改造,因为公司版本的redis支持lua版本为5.1,针对于长字符串的数字,使用tonumber转换的时候会得到…...

USB MSC
主机(如电脑)识别USB MSC(Mass Storage Class)设备中的文件,本质上是通过多层协议协作实现的,涉及USB枚举、SCSI命令传输和文件系统解析三个核心环节。以下是详细机制: 🔍 一、USB…...

css实现文字渐变
在前端开发中,给文字设置渐变色是完全可以实现的,常用的方式是结合 CSS 的 background、-webkit-background-clip 和 -webkit-text-fill-color 属性。下面是一个常见的实现方法: <!DOCTYPE html> <html lang"zh-CN"> …...

FART 自动化脱壳框架一些 bug 修复记录
版权归作者所有,如有转发,请注明文章出处:https://cyrus-studio.github.io/blog/ open() 判断不严谨 https://github.com/CYRUS-STUDIO/FART/blob/master/fart10/art/runtime/art_method.cc 比如: int dexfilefp open(dex_pat…...
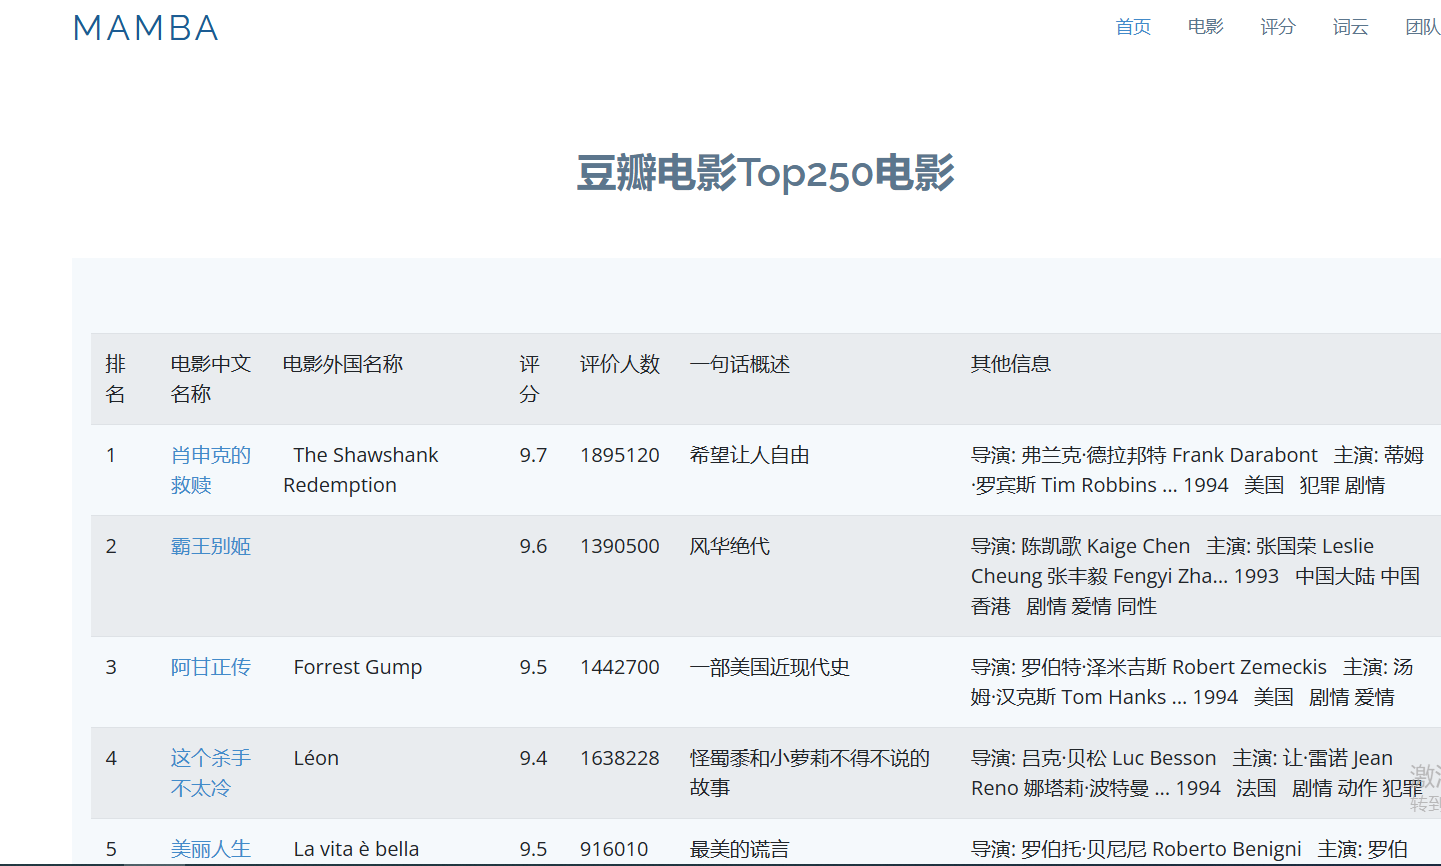
基于Flask实现豆瓣Top250电影可视化
项目截图 概述 该项目旨在对豆瓣Top 250电影进行全面的数据分析,使用了Python爬虫、Flask框架进行开发,并采用了Echarts进行数据可视化以及WordCloud进行词云分析。应用展示了多个功能,如电影列表、评分分布、词频统计和团队信息。 主要功能…...
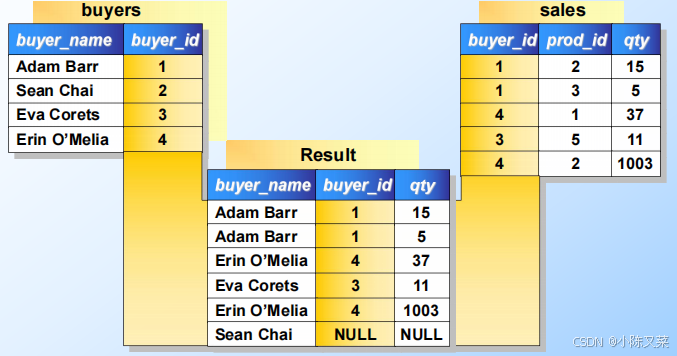
More SQL(Focus Subqueries、Join)
目录 Subqueries Subqueries That Return One Tuple Subqueries and Self Connection The IN Operator The Exists Operator The Operator ANY The Operator ALL Union, Intersection, and Difference(交并差) Bag Semantics Controlling Dupl…...

项目部署react经历
简单的说: 1. 编译打包并压缩为压缩包 2. 将压缩包上传到服务器(这里以宝塔面板为例:www/wwwroot/目录下) 3. 将文件解压生成比如:www/wwwroot/ttms/build/* 多文件 4. php 项目建站,选择静态ÿ…...

从图像处理到深度学习:直播美颜SDK的人脸美型算法详解
在直播的镜头前,每一位主播都希望自己“光彩照人”。但在高清摄像头无死角的审视下,哪怕是天生丽质,也难免需要一点技术加持。于是,美颜SDK应运而生,成为直播平台提升用户粘性和视觉体验的重要工具。 尤其是在“人脸美…...

智能教育个性化学习路径规划系统实战指南
引言 在数字化教育革命中,如何利用AI技术实现"因材施教"的千年教育理想?本文将通过构建一个完整的智能教育系统,演示如何基于Python生态(Django机器学习)实现从数据采集到个性化推荐的全流程。系统将通过分…...

spark- ResultStage 和 ShuffleMapStage介绍
目录 1. ShuffleMapStage(中间阶段)1.1 作用1.2 核心特性1.3 示例2. ResultStage(最终结果阶段)2.1 作用2.2 核心特性2.3 示例3. 对比总结4. 执行流程示例5. 常见问题Q1:为什么需要区分两种 Stage?**Q2:如何手动观察 Stage 划分?Q3:ShuffleMapStage 的数据一定会落盘吗…...
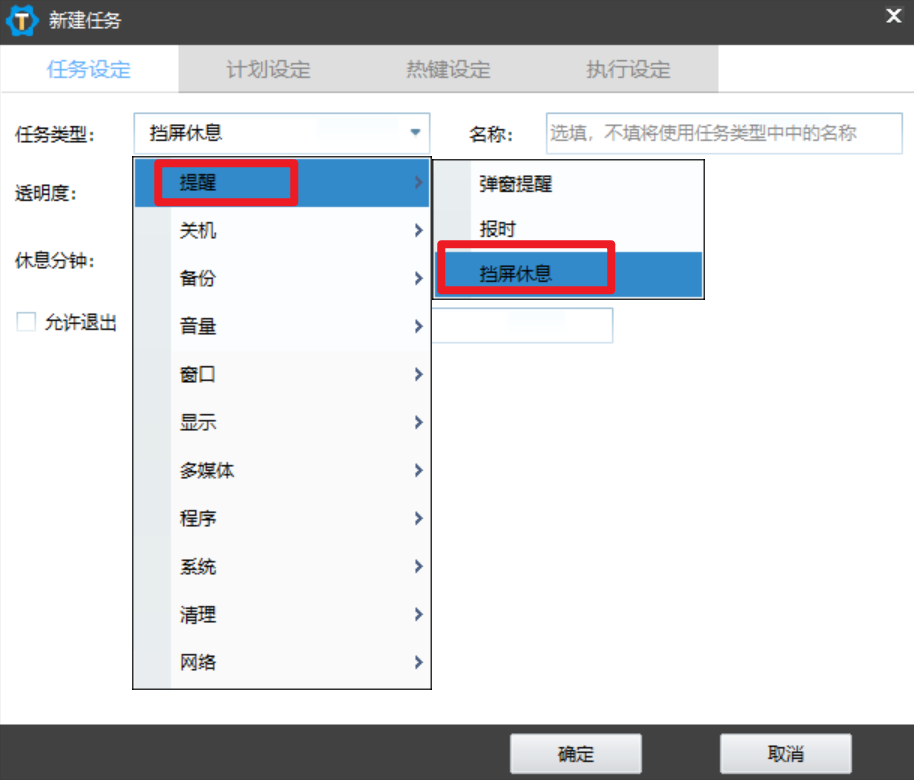
zTasker一款Windows自动化软件,提升效率:大小仅有10MB,免费无广告
一、zTasker是什么? zTasker是一款发布于2023年9月的免费无广告工具,专为Windows用户打造。它以仅8MB的轻量体积、极低资源占用(内存消耗不足10MB)和秒级启动速度脱颖而出,堪称“任务计划程序的终极强化版”。无论是定…...

人工智能100问☞第34问:什么是语音识别与合成?
目录 一、通俗解释 二、专业解析 三、权威参考 在人工智能的世界里,“看、听、说、写”早已不是人类的专属技能。语音识别,让机器有了耳朵;语音合成,让机器长了嘴巴;合在一起,机器就开始“说人话、听人言”了。 一、通俗解释 1、语音识别:让机器听懂人说话 你有没…...

最大流-Ford-Fulkerson增广路径算法py/cpp/Java三语言实现
最大流-Ford-Fulkerson增广路径算法py/cpp/Java三语言实现 一、网络流问题与相关概念1.1 网络流问题定义1.2 关键概念 二、Ford-Fulkerson算法原理2.1 核心思想2.2 算法步骤 三、Ford-Fulkerson算法的代码实现3.1 Python实现3.2 C实现3.3 Java实现 四、Ford-Fulkerson算法的时间…...

怎么从一台电脑拷贝已安装的所有python第三方库到另一台
要将Python库从一台电脑拷贝到另一台,可以采用以下方法: 方法一:使用pip命令导出和安装依赖 如果目标电脑在线,且python与pip命令可以正常使用 在源电脑上,打开命令行,执行以下命令导出所有依赖库到requ…...
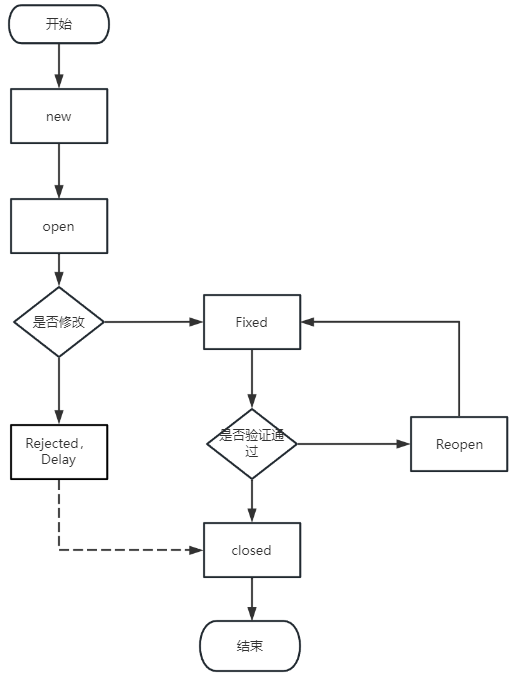
【测试】Bug和用例
软件测试贯穿于软件的整个⽣命周期 软件测试的⽣命周期是指测试流程,这个流程是按照⼀定顺序执⾏的⼀系列特定的步骤,去保证产品质量符合需求。在软件测试⽣命周期流程中,每个活动都按照计划的系统的执⾏。每个阶段有不同的⽬标和交付产物 Bu…...
)
缓存穿透、缓存击穿、缓存雪崩目前记录(纯日记)
今天学了学这三个知识,这命名真是有点东西。 1.先说在命名方面与其余两个内容能明显区分开的缓存雪崩,简单来讲: 缓存雪崩就是缓存宕机了,也甭管咋宕机了,反正就是某一时刻,缓存用不了了。 那咋办&#…...

鸿蒙OS的5.0.1.120版本体验怎么样?
点击上方关注 “终端研发部” 设为“星标”,和你一起掌握更多数据库知识 越来越是好用了,之前是凑合能用,现在是大多能用。 我朋友的mate30PRO和PuraX一起用,新系统确实满足我90%以上的需求 一个系统适配一款机型,是要…...
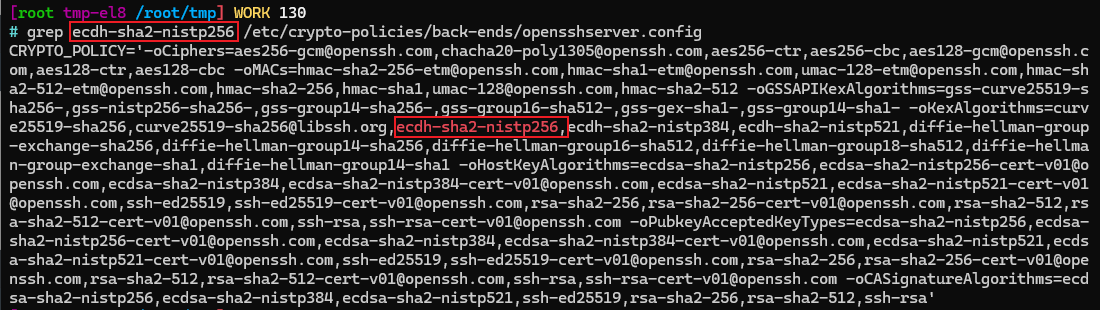
使用ssh-audit扫描ssh过期加密算法配置
使用ssh-audit扫描ssh过期加密算法配置 安装检查ssh的加密算法配置修改ssh的加密算法配置 安装 # pip3安装ssh-audit pip3 instal ssh-audit检查ssh的加密算法配置 # 检查ssh的配置 ssh-audit 192.168.50.149修改ssh的加密算法配置 # 查看ssh加密配置文件是否存在 ls /etc/c…...
详解)
前端工程化 Source Map(源码映射)详解
我们来深入讲解前端 Source Map(源码映射),围绕以下结构展开: 一、为什么要用 Source Map?(Why) 背景问题: 在前端构建中,源代码通常会被压缩(minify&#…...

2025.05.28-华为暑期实习第二题-200分
📌 点击直达笔试专栏 👉《大厂笔试突围》 💻 春秋招笔试突围在线OJ 👉 笔试突围OJ 02. A先生的旅游路径规划 问题描述 A先生正在为即将到来的假期规划一次城市旅游。这座城市有 n n n...
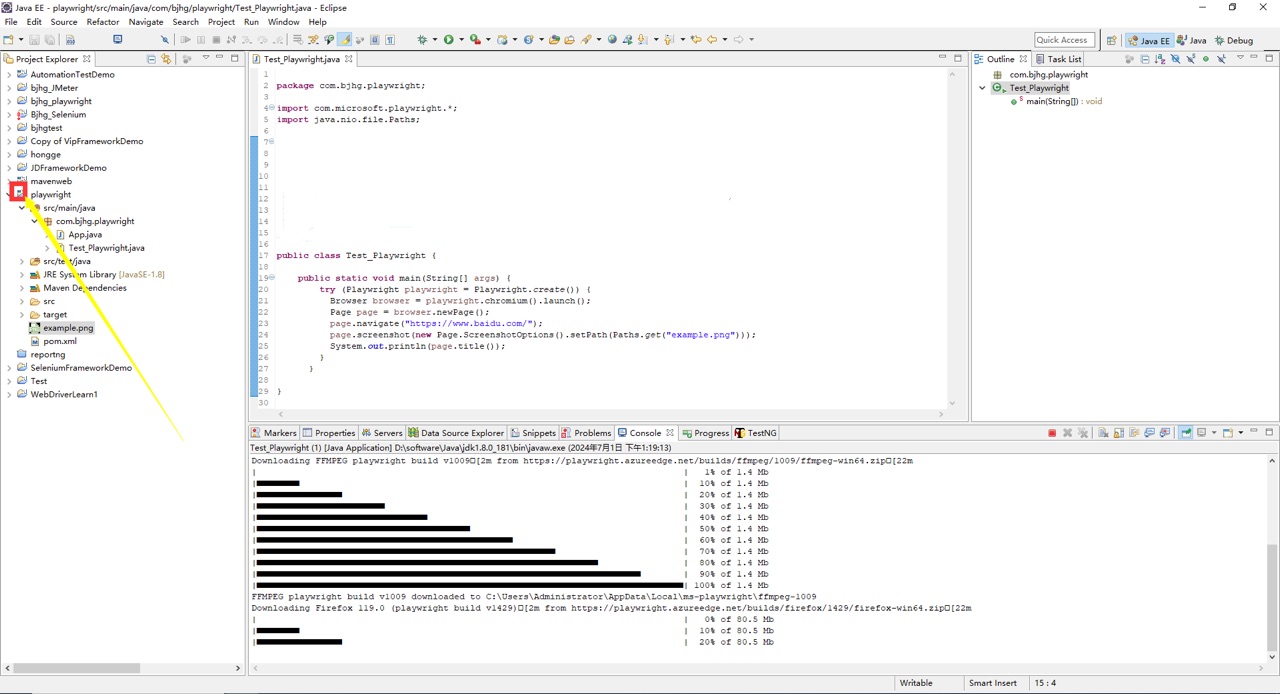
Java+Playwright自动化-2-环境准备与搭建-基于Maven
1.简介 上一章中已经讲如何通过引入jar包来搭建JavaPlaywright自动化测试环境,这一种是比较老的方法,说白了就是过时的老古董,但是我们必须了解和知道,其实maven搭建无非也就是下载引入相关的jar包,只不过相比之下是简…...

由sigmod权重曲线存在锯齿的探索
深度学习的知识点,一般按照执行流程,有 网络层类型,归一化,激活函数,学习率,损失函数,优化器。如果是研究生上课学的应该系统一点,自学的话知识点一开始有点乱。 一、激活函数Sigmod…...
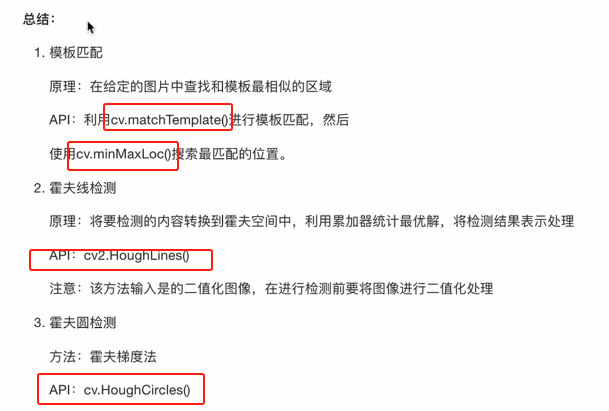
二、OpenCV图像处理-图像处理
目录 1、连通性 2、形态学操作 2.1腐蚀和膨胀 2.2开闭运算 2.3礼帽和黑帽 2.4总结 3、图像平滑 3.1图像噪声 3.2均值滤波 3.3高斯滤波 3.4中值滤波 3.5总结 4、直方图 4.1直方图的原理与显示 4.2掩膜的应用 4.3直方图均衡化 4.4自适应均衡化 4.5总结 5、边缘…...
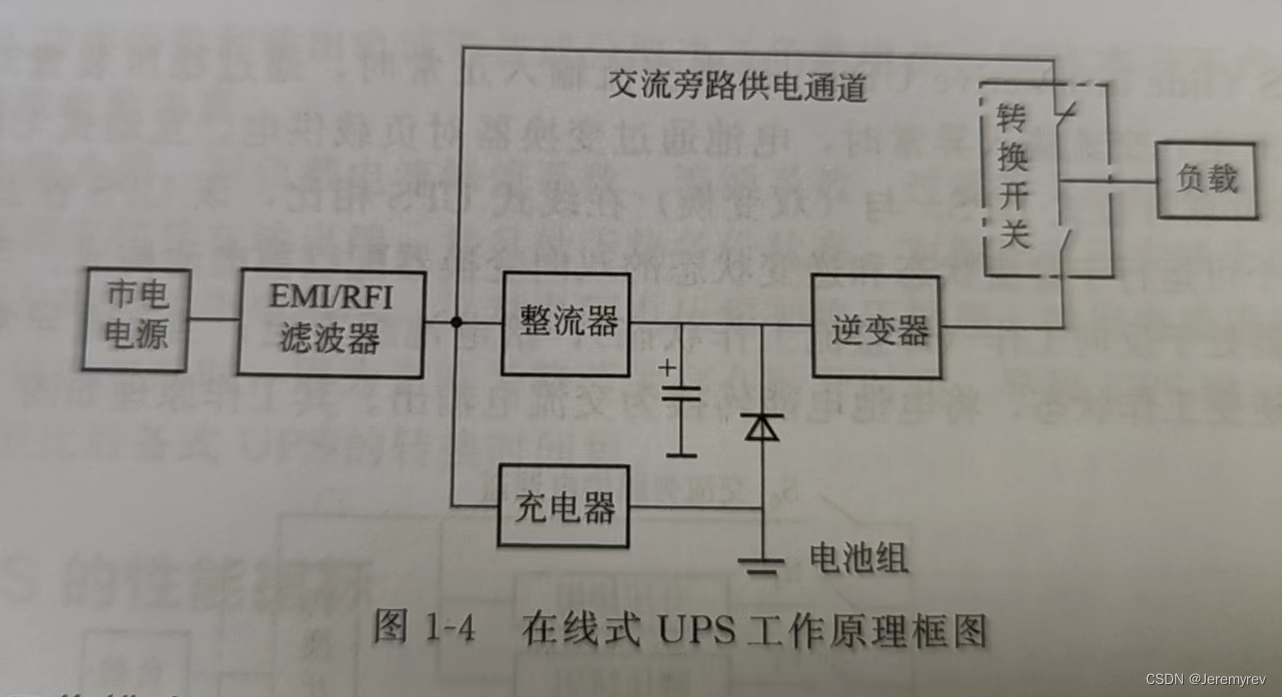
UPS的工作原理和UPS系统中旁路的作用
UPS(不间断电源)根据工作原理和适用场景的不同,主要分为以下三种类型,每种类型的特点和适用场景如下: 1. 后备式UPS(Offline/Standby UPS) 工作原理: 正常供电时,负载直接…...
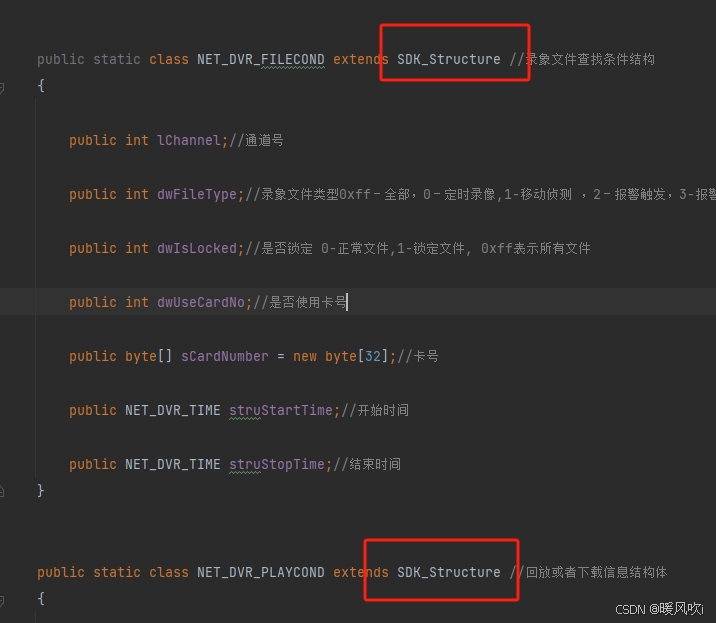
麒麟系统 Linux(aarch64处理器)系统java项目接入海康SDK问题
1. 麒麟系统部署海康摄像头时的 JNA 链接错误, 海康提供的jna sdk版本太低,需升级版本4.5及以上,把集成的Structure 替换成以下类 public class SDK_Structure extends Structure {protected List<String> getFieldOrder() {List<St…...