@Docker Compose 部署 Prometheus
文章目录
- Docker Compose 部署 Prometheus
- 1. 环境准备
- 2. 配置文件准备
- 3. 编写 Docker Compose 文件
- 4. 启动服务
- 5. 验证部署
- 6. 常用操作
- 7. 生产环境增强建议
- 8. 扩展监控对象
Docker Compose 部署 Prometheus
1. 环境准备
- 安装 Docker(版本 ≥ 20.10)和 Docker Compose(版本 ≥ 1.29)
- 创建项目目录:
mkdir prometheus && cd prometheus
2. 配置文件准备
-
创建 Prometheus 配置文件
prometheus.yml(基础配置):global:scrape_interval: 15sevaluation_interval: 15sscrape_configs:- job_name: "prometheus"static_configs:- targets: ["localhost:9090"] # 监控自身# 示例:添加 Node Exporter(需额外部署)# - job_name: "node"# static_configs:# - targets: ["node-exporter:9100"] -
创建告警规则文件(可选)
alerts.yml:groups: - name: examplerules:- alert: InstanceDownexpr: up == 0for: 1mlabels:severity: criticalannotations:summary: "Instance {{ $labels.instance }} down"linux_rules.yml:groups: - name: linux-system-rulesrules:# CPU 相关规则- alert: HighCpuLoadexpr: 100 - (avg by(instance) (irate(node_cpu_seconds_total{mode="idle"}[5m])) * 100) > 80for: 10mlabels:severity: warningannotations:summary: "High CPU load on {{ $labels.instance }}"description: "CPU usage is {{ $value }}% for last 10 minutes"# 内存相关规则- alert: HighMemoryUsageexpr: (node_memory_MemTotal_bytes - node_memory_MemFree_bytes - node_memory_Buffers_bytes - node_memory_Cached_bytes) / node_memory_MemTotal_bytes * 100 > 5 # 修改测试触发告警for: 10mlabels:severity: warningannotations:summary: "High memory usage on {{ $labels.instance }}"description: "Memory usage is {{ $value }}% for last 10 minutes"# 交换分区规则- alert: HighSwapUsageexpr: (node_memory_SwapTotal_bytes - node_memory_SwapFree_bytes) / node_memory_SwapTotal_bytes * 100 > 50for: 15mlabels:severity: warningannotations:summary: "High swap usage on {{ $labels.instance }}"description: "Swap usage is {{ $value }}% for last 15 minutes"# 磁盘空间规则- alert: LowDiskSpaceexpr: (node_filesystem_avail_bytes{mountpoint!~"^(/run|/var/lib/docker).*",fstype!="tmpfs"} / node_filesystem_size_bytes * 100) < 15for: 10mlabels:severity: warningannotations:summary: "Low disk space on {{ $labels.instance }} ({{ $labels.mountpoint }})"description: "Only {{ $value }}% free space left on {{ $labels.mountpoint }}"# 磁盘 I/O 规则- alert: HighDiskIoLoadexpr: rate(node_disk_io_time_seconds_total[1m]) * 100 > 80for: 10mlabels:severity: warningannotations:summary: "High disk I/O load on {{ $labels.instance }} ({{ $labels.device }})"description: "Disk I/O load is {{ $value }}% for last 10 minutes"# 网络相关规则- alert: HighNetworkErrorsexpr: increase(node_network_receive_errs_total[5m]) > 10 or increase(node_network_transmit_errs_total[5m]) > 10for: 5mlabels:severity: warningannotations:summary: "High network errors on {{ $labels.instance }} ({{ $labels.device }})"description: "Network errors detected on interface {{ $labels.device }}"# 系统负载规则- alert: HighSystemLoadexpr: node_load5 / count by(instance)(node_cpu_seconds_total{mode="system"}) > 1.5for: 15mlabels:severity: warningannotations:summary: "High system load on {{ $labels.instance }}"description: "5-minute load average is {{ $value }} (relative to CPU count)"# 节点宕机规则- alert: InstanceDownexpr: up{job="node"} == 0for: 5mlabels:severity: criticalannotations:summary: "Instance {{ $labels.instance }} down"description: "{{ $labels.instance }} has been down for more than 5 minutes"# 文件描述符规则- alert: HighFileDescriptorUsageexpr: node_filefd_allocated / node_filefd_maximum * 100 > 80for: 10mlabels:severity: warningannotations:summary: "High file descriptor usage on {{ $labels.instance }}"description: "File descriptor usage is {{ $value }}% of maximum"windows_rules.yml:groups: - name: windows-system-rulesrules:# CPU 相关规则- alert: HighCpuUsageWindowsexpr: 100 - (avg by(instance) (rate(windows_cpu_time_total{mode="idle"}[5m])) * 100) > 85for: 10mlabels:severity: warningannotations:summary: "High CPU usage on {{ $labels.instance }}"description: "CPU usage is {{ $value }}% for last 10 minutes"# 内存相关规则- alert: HighMemoryUsageWindowsexpr: (windows_os_physical_memory_total_bytes - windows_os_physical_memory_free_bytes) / windows_os_physical_memory_total_bytes * 100 > 90for: 10mlabels:severity: warningannotations:summary: "High memory usage on {{ $labels.instance }}"description: "Memory usage is {{ $value }}% for last 10 minutes"# 磁盘空间规则- alert: LowDiskSpaceWindowsexpr: (windows_logical_disk_free_bytes / windows_logical_disk_size_bytes * 100) < 95 # 修改测试触发告警for: 10mlabels:severity: warningannotations:summary: "Low disk space on {{ $labels.instance }} ({{ $labels.volume }})"description: "Only {{ $value }}% free space left on {{ $labels.volume }}"# 磁盘 I/O 规则- alert: HighDiskIoWindowsexpr: rate(windows_logical_disk_read_seconds_total[5m]) * 100 > 80 or rate(windows_logical_disk_write_seconds_total[5m]) * 100 > 80for: 10mlabels:severity: warningannotations:summary: "High disk I/O on {{ $labels.instance }} ({{ $labels.volume }})"description: "Disk I/O utilization is {{ $value }}% for last 10 minutes"# 服务状态规则- alert: CriticalServiceDownexpr: windows_service_status{status!="running"} == 1for: 2mlabels:severity: criticalannotations:summary: "Critical service down on {{ $labels.instance }}"description: "Service {{ $labels.service }} is not running"# 系统启动时间规则- alert: SystemRebootedexpr: time() - windows_system_system_up_time > 300for: 0mlabels:severity: infoannotations:summary: "System rebooted on {{ $labels.instance }}"description: "System was rebooted, uptime is {{ $value }} seconds"# 网络连接规则- alert: HighNetworkUtilizationWindowsexpr: rate(windows_net_bytes_total[5m]) / windows_net_speed_bits * 8 * 100 > 80for: 10mlabels:severity: warningannotations:summary: "High network utilization on {{ $labels.instance }} ({{ $labels.interface }})"description: "Network utilization is {{ $value }}% for last 10 minutes"# 进程内存泄漏检测- alert: ProcessMemoryLeakWindowsexpr: predict_linear(windows_process_private_bytes[1h], 3600) / 1024 / 1024 / 1024 > 2for: 30mlabels:severity: warningannotations:summary: "Possible memory leak in {{ $labels.process }} on {{ $labels.instance }}"description: "Process {{ $labels.process }} is predicted to exceed 2GB memory in 1 hour"# 系统日志错误规则- alert: SystemLogErrorsWindowsexpr: rate(windows_event_log_errors_total[5m]) > 5for: 5mlabels:severity: warningannotations:summary: "High system log errors on {{ $labels.instance }}"description: "{{ $value }} errors per second in system logs"linux_recording_rules.yml:groups: - name: linux-recording-rulesinterval: 1mrules:# CPU Usage (兼容多版本Node Exporter)- record: instance:node_cpu_usage:rate5mexpr: 100 - (avg by(instance) (rate(node_cpu_seconds_total{mode="idle",job=~".*"}[5m])) * 100)# Memory Usage (排除缓存/缓冲区)- record: instance:node_memory_usage:ratioexpr: >(node_memory_MemTotal_bytes - node_memory_MemFree_bytes- node_memory_Buffers_bytes - node_memory_Cached_bytes)/ node_memory_MemTotal_bytes * 100# Disk Space Usage (过滤无效挂载点)- record: instance:node_filesystem_usage:ratioexpr: >(node_filesystem_size_bytes{fstype!~"tmpfs|squashfs",mountpoint!~"/run|/snap"}- node_filesystem_avail_bytes{fstype!~"tmpfs|squashfs",mountpoint!~"/run|/snap"})/ node_filesystem_size_bytes{fstype!~"tmpfs|squashfs",mountpoint!~"/run|/snap"} * 100# Network Traffic (过滤虚拟接口)- record: instance:node_network_receive_mbps:rate5mexpr: sum by(instance)(rate(node_network_receive_bytes_total{device!~"lo|veth.*"}[5m])) * 8 / 1048576# System Load (标准化)- record: instance:node_load_ratio:rate5mexpr: node_load5 / count by(instance)(node_cpu_seconds_total{mode="system"})
3. 编写 Docker Compose 文件
docker-compose.yml:
version: '3.8'services:prometheus:image: prom/prometheus:latestcontainer_name: prometheusvolumes:- ./prometheus.yml:/etc/prometheus/prometheus.yml- ./alerts.yml:/etc/prometheus/alerts.yml # 挂载告警规则- prometheus-data:/prometheus # 数据持久化command:- '--config.file=/etc/prometheus/prometheus.yml'- '--storage.tsdb.path=/prometheus'- '--web.enable-lifecycle' # 允许热重载配置ports:- "9090:9090"restart: unless-stoppednetworks:- monitor-net# 可选:添加 Grafana 可视化grafana:image: grafana/grafana:latestcontainer_name: grafanavolumes:- grafana-data:/var/lib/grafanaports:- "3000:3000"restart: unless-stoppednetworks:- monitor-net# 可选:添加 Node Exporter 监控主机# node-exporter:# image: prom/node-exporter:latest# container_name: node-exporter# restart: unless-stopped# network_mode: host # 需主机模式# pid: host# volumes:# - /:/host:ro,rslave# command:# - '--path.rootfs=/host'volumes:prometheus-data:grafana-data:networks:monitor-net:driver: bridge
4. 启动服务
docker-compose up -d # 后台启动
5. 验证部署
- Prometheus UI:访问
http://<服务器IP>:9090- 检查 Targets:Status → Targets
- 查询指标:Graph → 输入
up查看状态
- Grafana UI(如部署):
http://<服务器IP>:3000(默认账号 admin/admin)- 添加 Prometheus 数据源:
http://prometheus:9090
- 添加 Prometheus 数据源:
6. 常用操作
- 重载配置(不重启):
curl -X POST http://localhost:9090/-/reload - 查看日志:
docker-compose logs -f prometheus - 停止服务:
docker-compose down - 备份数据:备份
prometheus-data卷(默认位置:/var/lib/docker/volumes/...)
7. 生产环境增强建议
- 安全加固:
- 设置 Prometheus
--web.config.file启用基础认证 - 限制 Grafana 登录策略
- 设置 Prometheus
- 持久化优化:
volumes:prometheus-data:driver_opts:type: nfso: addr=<nfs_server>,rwdevice: ":/path/to/nfs" - 资源限制:
prometheus:deploy:resources:limits:cpus: '2'memory: 4G - 高可用方案:
- 部署多个 Prometheus 实例 + Thanos
- 使用 Alertmanager 集群
8. 扩展监控对象
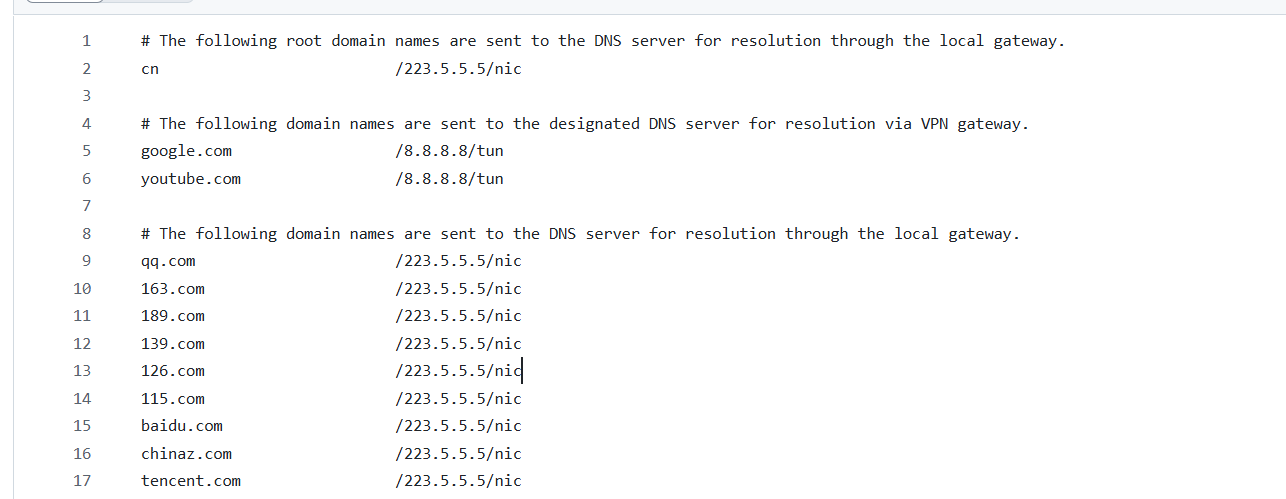
修改 prometheus.yml 添加:
# 监控 Docker 容器
- job_name: "docker"static_configs:- targets: ["docker-host:9323"]  # 需配置 docker daemon 暴露 metrics# 监控 MySQL
- job_name: "mysql"static_configs:- targets: ["mysql-exporter:9104"]  # 需部署 mysqld-exporter
注:完整配置参考 Prometheus 官方文档
相关文章:

@Docker Compose 部署 Prometheus
文章目录 Docker Compose 部署 Prometheus1. 环境准备2. 配置文件准备3. 编写 Docker Compose 文件4. 启动服务5. 验证部署6. 常用操作7. 生产环境增强建议8. 扩展监控对象 Docker Compose 部署 Prometheus 1. 环境准备 安装 Docker(版本 ≥ 20.10)和 …...
openppp2 -- 1.0.0.25225 优化多线接入运营商路由调配
本文涉及到的内容,涉及到上个发行版本相关内容,人们在阅读本文之前,建议应当详细阅读上个版本之中的VBGP技术相关的介绍。 openppp2 -- 1.0.0.25196 版本新增的VBGP技术-CSDN博客 我们知道在现代大型的 Internet 网络服务商,很多…...

二次封装 Vuex for Uniapp 微信小程序开发
作为高级前端开发工程师,我将为你提供一个针对 Uniapp Vue2 Vuex 的 Store 二次封装方案,使团队成员能够更便捷地使用和管理状态。 封装目标 模块化管理状态 简化调用方式 提供类型提示(在 Vue2 中尽可能实现) 便于维护和查…...
详细到用手撕transformer下半部分
之前我们讨论了如何实现 Transformer 的核心多头注意力机制,那么这期我们来完整地实现整个 Transformer 的编码器和解码器。 Transformer 架构最初由 Vaswani 等人在 2017 年的论文《Attention Is All You Need》中提出,专为序列到序列(seq2s…...

Spring Boot 整合 Spring Data JPA、strategy 的策略区别、什么是 Spring Data JPA
DAY29.2 Java核心基础 Spring Boot 整合 Spring Data JPA Spring Data JPA根据具体的数据库分为不同的子模块,无论是关系型数据库和非关系型数据库,Spring Data都提供了支持 Mysql:Spring Data JPA Redis:Spring Data Redis …...

Vue 3.0 中的路由导航守卫详解
1. 路由导航守卫 1.1. 全局前置守卫 Vue-Router 提供的导航守卫主要用来守卫路由的跳转或取消。它们可以植入到全局、单个路由或组件级别。 全局前置守卫可以使用 router.beforeEach 注册: const router createRouter({... });router.beforeEach((to, from) &g…...

【Sqoop基础】Sqoop生态集成:与HDFS、Hive、HBase等组件的协同关系深度解析
目录 1 Sqoop概述与大数据生态定位 2 Sqoop与HDFS的深度集成 2.1 技术实现原理 2.2 详细工作流程 2.3 性能优化实践 3 Sqoop与Hive的高效协同 3.1 集成架构设计 3.2 数据类型映射处理 3.3 案例演示 4 Sqoop与HBase的实时集成 4.1 数据模型转换挑战 4.2 详细集成流程…...
MySQL + CloudCanal + Iceberg + StarRocks 构建全栈数据服务
简述 在业务数据快速膨胀的今天,企业对 低成本存储 与 实时查询分析能力 的需求愈发迫切。 本文将带你实战构建一条 MySQL 到 Iceberg 的数据链路,借助 CloudCanal 快速完成数据迁移与同步,并使用 StarRocks 完成数据查询等操作,…...

MSVC支持但是Clang会报错的C++行为
MSVC的非标 目的友元别名模板类显式特例化的命名空间限制 目的 因为在使用clang进行ast分析msvc项目的时候,出现了爆红现象,了解到msvc会有一些不严格按照c标准但是允许的语法,在这点上clang就很严格,所以本文以clang为基准&…...

截屏精灵:轻松截屏,高效编辑
在移动互联网时代,截图已经成为我们日常使用手机时的一项基本操作。无论是记录重要信息、分享有趣内容,还是进行学习和工作,一款好用的截图工具都能极大地提升我们的效率。截屏精灵就是这样一款功能强大、操作简单的截图工具,它不…...
【JavaWeb】基本概念、web服务器、Tomcat、HTTP协议
目录 1. 基本概念1.1 基本概念1.2 web应用程序1.3 静态web1.4 动态web 2. web服务器3. tomcat详解3.1 安装3.2 启动3.3 配置3.3.1 配置启动的端口号3.3.2 配置主机的名称3.3.3 其他常用配置项日志配置数据源配置安全配置 3.4 发布一个网站 4. Http协议4.1 什么是http4.2 http的…...

黑马程序员C++核心编程笔记--4 类和对象--封装
C面向对象三大特征:封装、继承、多态 C认为万事万物皆对象,对象有其属性和行为,具有相同性质的对象可以抽象称为类 4.1 封装 4.1.1 封装的意义 将属性和行为作为一个整体,表现生活中的事物将属性和行为加以权限控制 在设计类…...

Debian:自由操作系统的精神图腾与技术基石
🔥「炎码工坊」技术弹药已装填! 点击关注 → 解锁工业级干货【工具实测|项目避坑|源码燃烧指南】 ——解码Linux世界最纯粹的开源哲学 一、Debian的诞生:从个人实验到全球协作 1993年,一位名为Ian Murdock的程序员在开源社区的启…...
云计算Linux Rocky day02(安装Linux系统、设备表示方式、Linux基本操作)
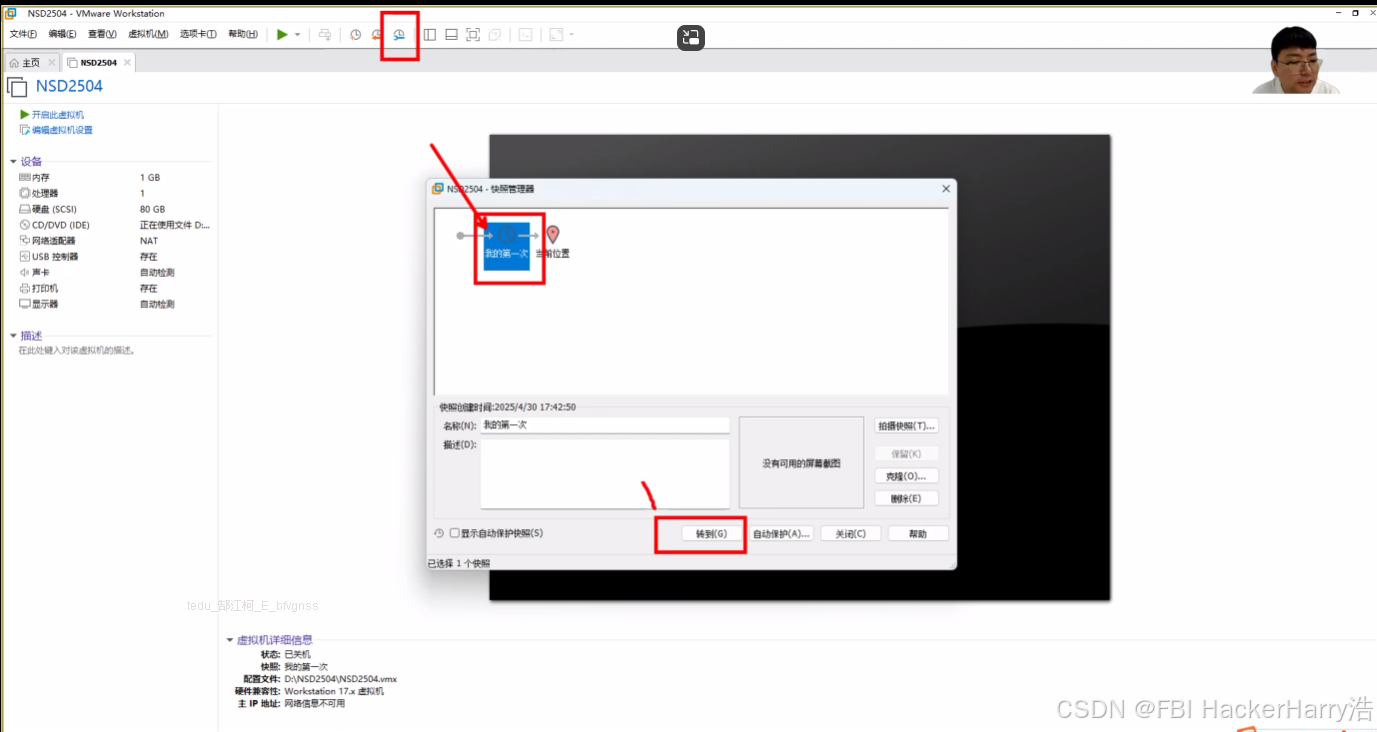
云计算Linux Rocky day02(安装Linux系统、设备表示方式、Linux基本操作) 目录 云计算Linux Rocky day02(安装Linux系统、设备表示方式、Linux基本操作)1、虚拟机VMware安装Rocky2、Linux命令行3、Linux Rocky修改字体大小和背景颜…...
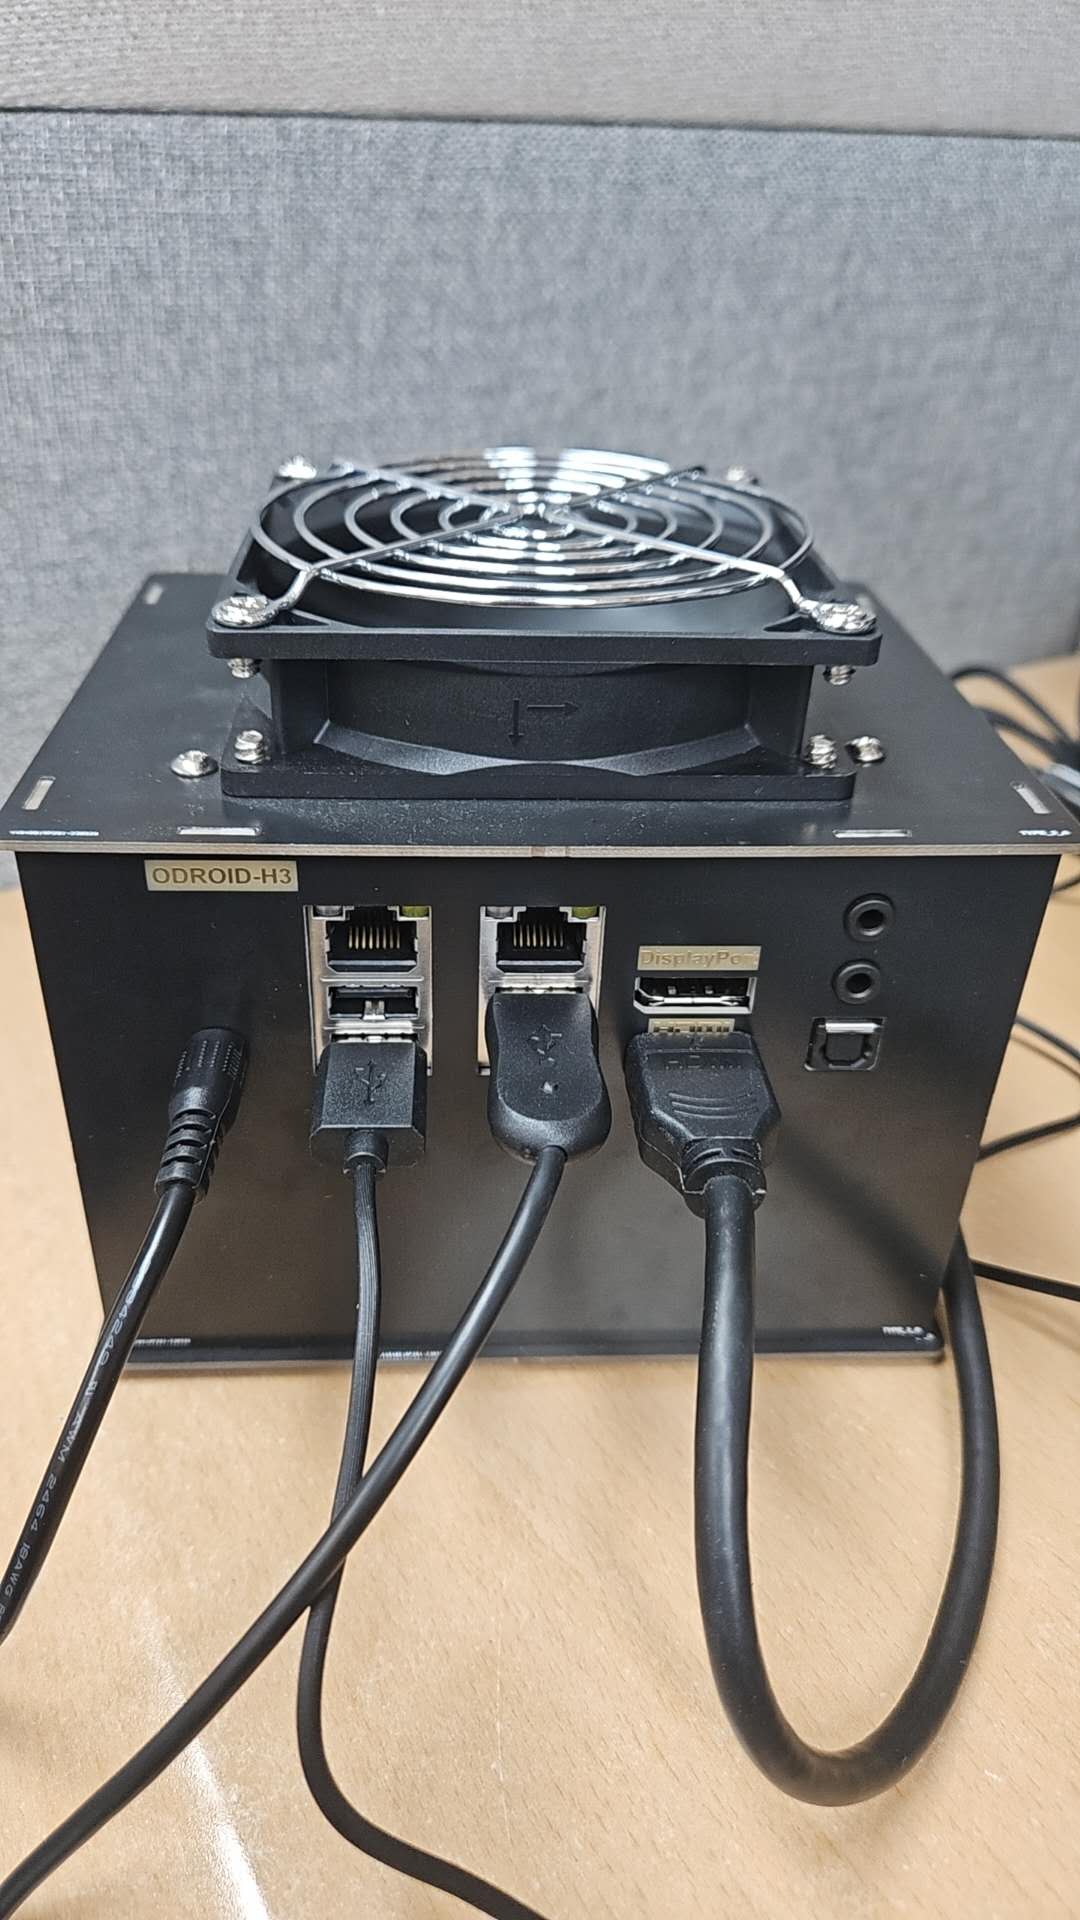
在 ODROID-H3+ 上安装 Win11 系统
在 ODROID-H3 上安装 Windows 11 系统。 以下是完整的步骤,包括 BIOS 设置、U 盘制作、安装和驱动处理,全程不保留之前的系统数据。 ✅ 准备工作 1. 准备一个 ≥8GB 的 USB 启动盘 用另一台电脑制作 Windows 11 安装盘。 👉 推荐工具&…...
)
Docker常用命令操作指南(一)
Docker常用命令操作指南-1 一、Docker镜像相关命令1.1 搜索镜像(docker search)1.2 拉取镜像(docker pull)1.3 查看本地镜像(docker images)1.4 删除镜像(docker rmi) 二、Docker容器…...

什么是 SQL 注入?如何防范?
什么是 SQL 注入?如何防范? 1. SQL 注入概述 1.1 基本定义 SQL 注入(SQL Injection)是一种通过将恶意SQL 语句插入到应用程序的输入参数中,从而欺骗服务器执行非预期SQL命令的攻击技术。攻击者可以利用此漏洞绕过认证、窃取数据甚至破坏数据库。 关键结论:SQL 注入是O…...
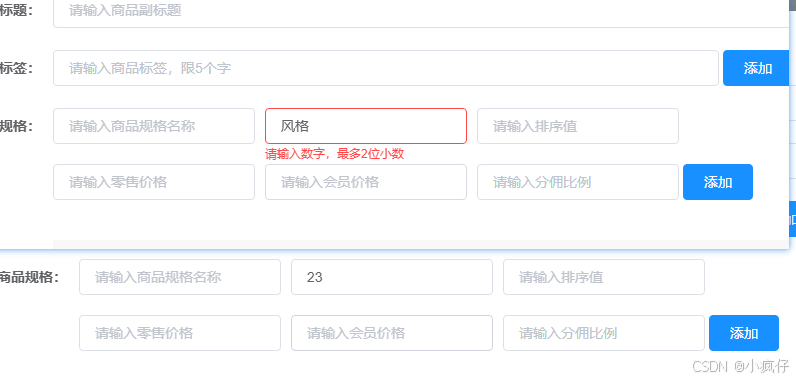
使用el-input数字校验,输入汉字之后校验取消不掉
先说说复现方式 本来input是只能输入数字的,然后你不小心输入了汉字,触发校验了,然后这时候,你发现校验取消不掉了 就这样了 咋办啊,你一看校验没错啊,各种number啥的也写了,发现没问题啊 <el-inputv…...
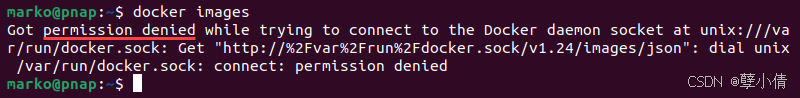
Docker容器启动失败的常见原因分析
我们在开发部署的时候,用 Docker 打包环境,理论上是“我装好了你就能跑”。但理想很丰满,现实往往一 docker run 下去就翻车了。 今天来盘点一下我实际工作中经常遇到的 Docker 容器启动失败的常见原因,顺便给点 debug 的小技巧&a…...

Java提取markdown中的表格
Java提取markdown中的表格 说明 这篇博文是一个舍近求远的操作,如果只需要要对markdown中的表格数据进行提取,完全可以通过正在表达式或者字符串切分来完成。但是鉴于学习的目的,这次采用了commonmark包中的工具来完成。具体实现过程如下 实…...
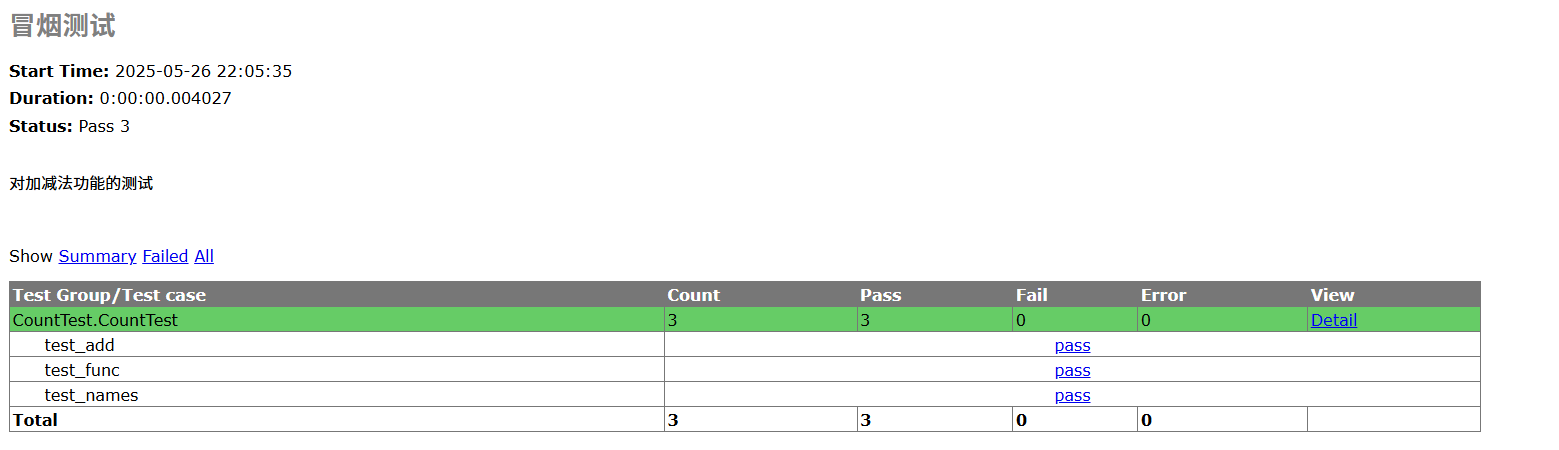
立志成为一名优秀测试开发工程师(第七天)——unittest框架的学习
目录 unittest框架的学习 一、测试类的编写 创建相关测试类cal.py、CountTest.py 二、常见断言方法 使用unittest单元测试框架编写测试用例CountTest.py 注意:执行的时候光标一定要放在括号后面,鼠标右键运行 三、对测试环境的初始化和清除模块…...
:营收阶段的核心指标与盈利模型优化——从数据到商业决策的落地)
精益数据分析(85/126):营收阶段的核心指标与盈利模型优化——从数据到商业决策的落地
精益数据分析(85/126):营收阶段的核心指标与盈利模型优化——从数据到商业决策的落地 c。 一、营收健康度的核心指标:投资回报率模型 (一)季度再发性营收增长率(QRR) 该指标衡量…...
论坛系统(4)
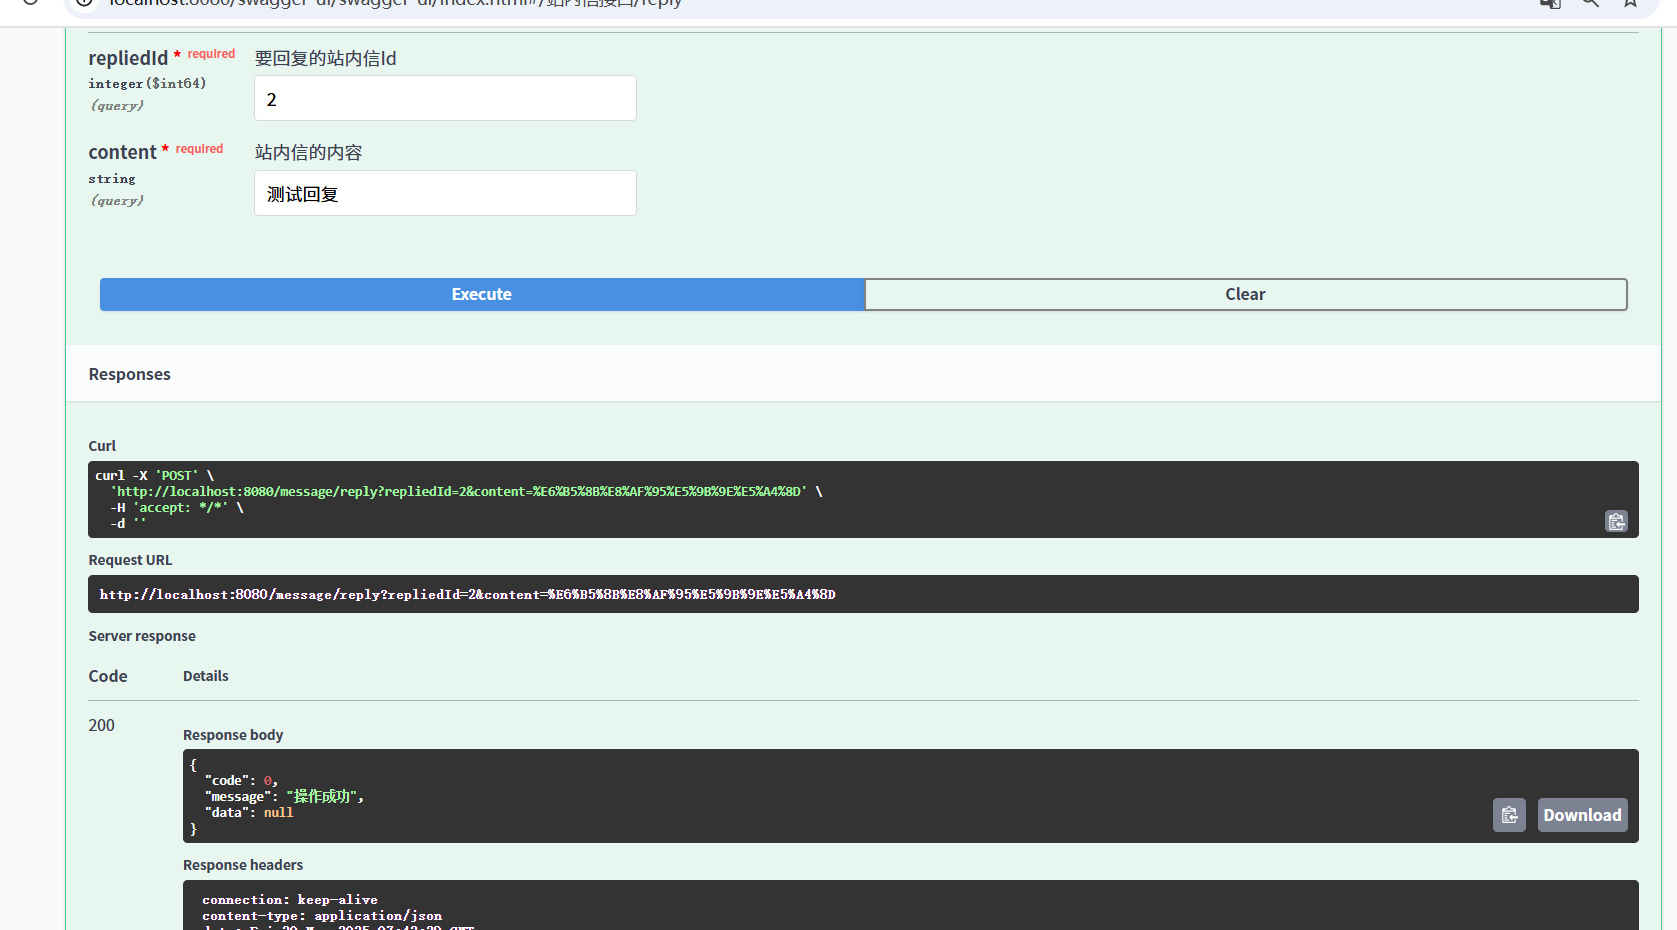
用户详情 获取用户信息 实现逻辑 ⽤⼾提交请求,服务器根据是否传⼊Id参数决定返回哪个⽤⼾的详情 1. 不传⽤⼾Id,返回当前登录⽤⼾的详情(从session获取) 2. 传⼊⽤⼾Id,返回指定Id的⽤⼾详情(根据用户id去查) 俩种方式获得用户信息 参…...

本地Markdown开源知识库选型指南
本地Markdown开源知识库选型指南 以下是几款优秀的本地Markdown开源知识库解决方案,适合不同需求场景: 1. Obsidian (非完全开源但免费) 特点:基于Markdown的本地优先知识管理,丰富的插件生态优势:双向链接、图形视…...

【.net core】SkiaSharp 如何在Linux上实现
1. 安装依赖库 首先需要安装 SkiaSharp 运行时依赖: # Ubuntu/Debian sudo apt-get update sudo apt-get install -y libfontconfig1 libfreetype6 libx11-6 libx11-xcb1 libxcb1 \libxcomposite1 libxcursor1 libxdamage1 libxi6 libxtst6 \libnss3 libcups2 lib…...

后端项目中静态文案国际化语言包构建选型
这是一个很关键的问题。在做国际化(i18n)时,不同语言包格式如 .resx、.properties 和 .json 都可用,但各自有适用场景、特性与限制,你在选择时可以根据你的开发语言、生态和维护成本权衡。 ✅ 一张对比表:.…...

前端面经 React常见的生命周期
初始化阶段 constructor state的初始化,防抖节流的绑定getDerivedStateFromProps 静态函数 当作纯函数使用 传入props和state,合并成一个新的statecomponentWillMount 组件如果有getDrivedStatefromprops不会执行 针对一些接口的预请求时使用rendercomp…...
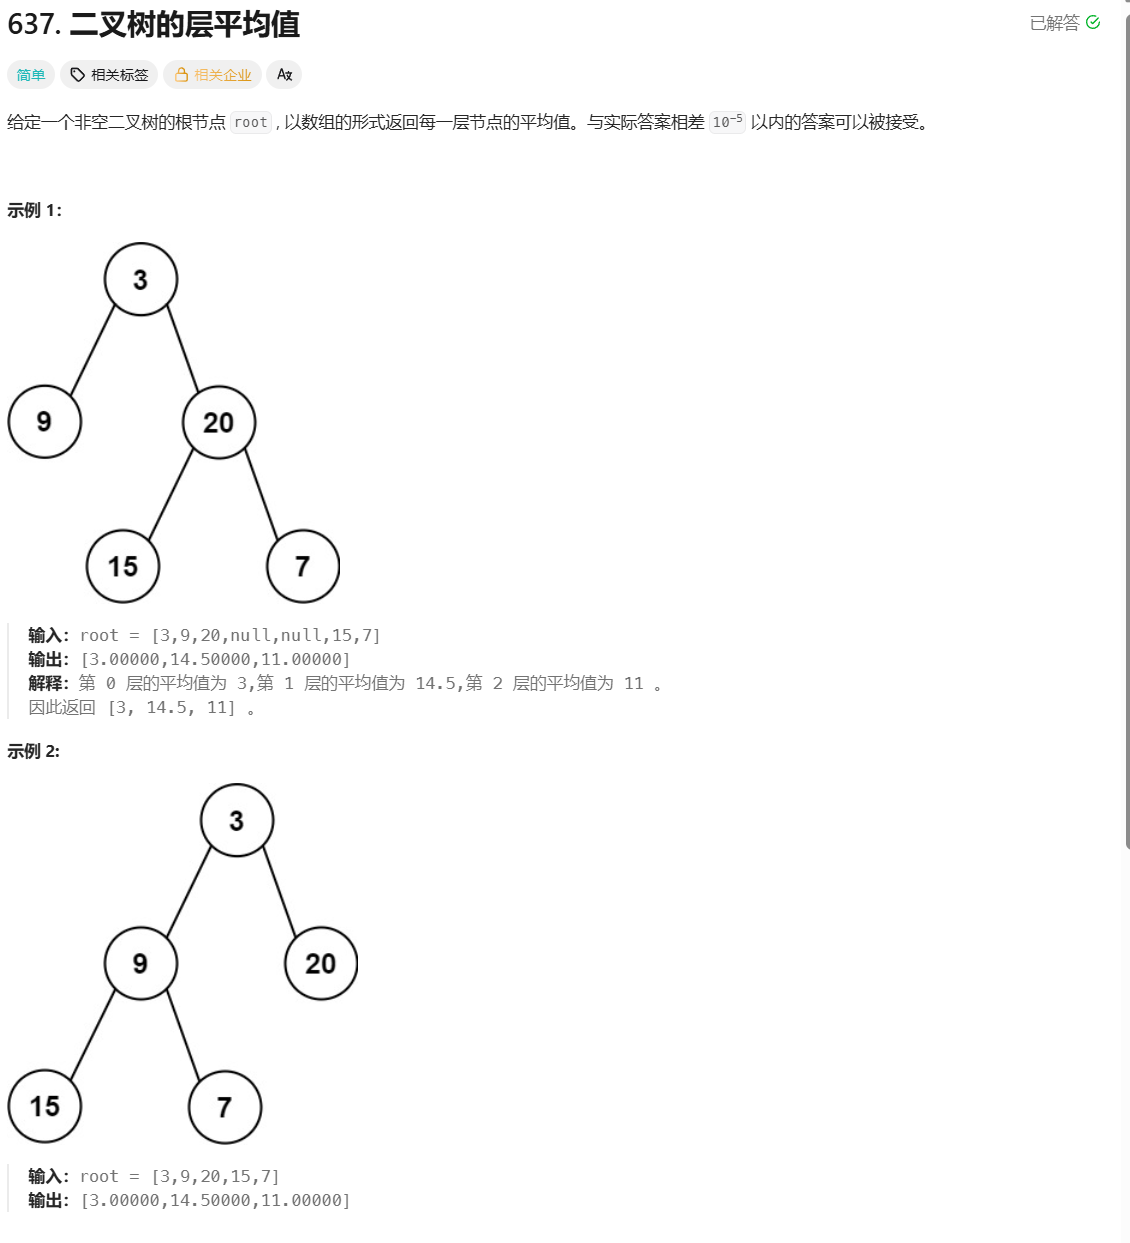
力扣面试150题--二叉树的层平均值
Day 54 题目描述 思路 初次做法(笨):使用两个队列,一个队列存放树的节点,一个队列存放对应节点的高度,使用x存放上一个节点,highb存放上一个节点的高度,sum存放当前层的节点值之和…...
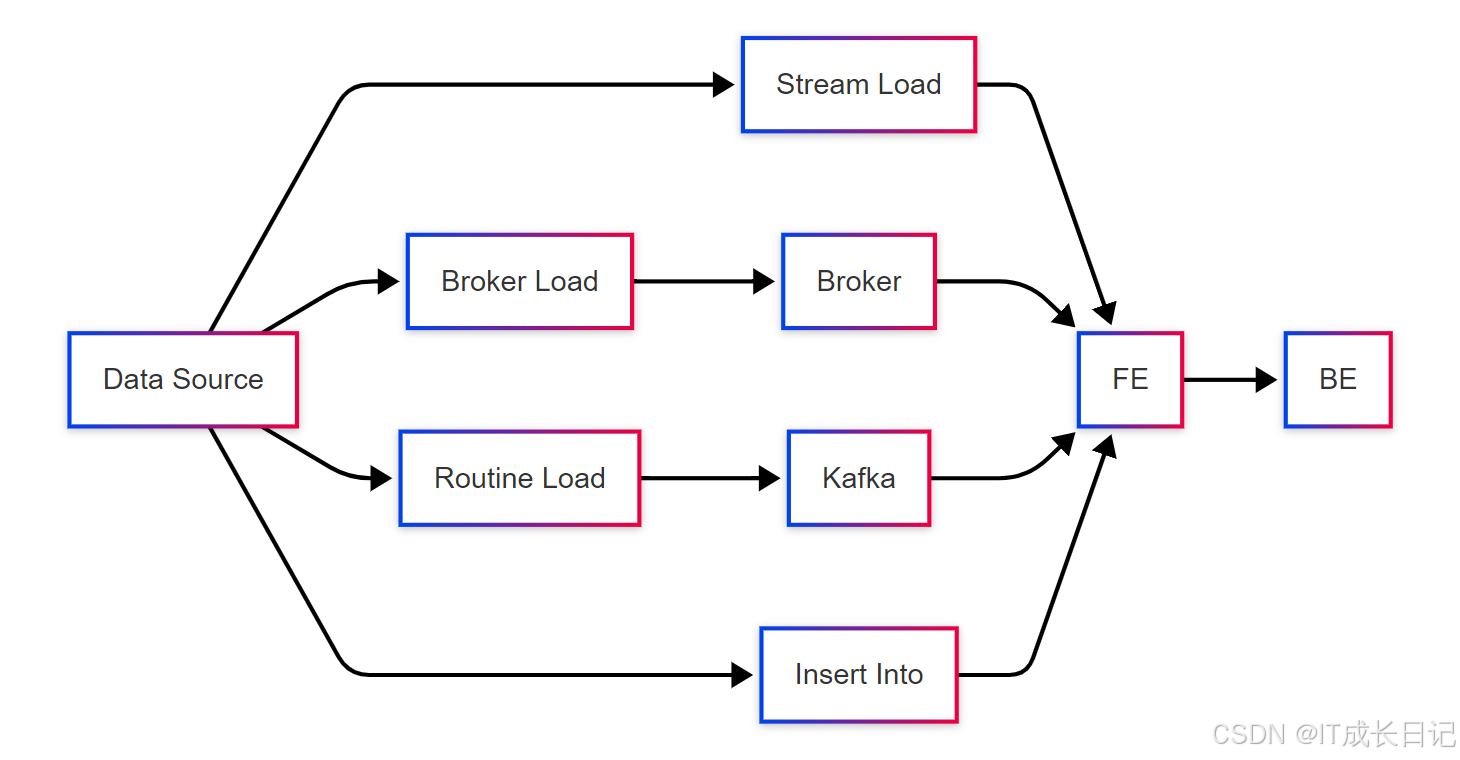
【Doris入门】Doris初识:分布式分析型数据库的核心价值与架构解析
目录 1 Doris简介与核心价值 2 Doris架构深度解析 2.1 Frontend(FE)架构 2.2 Backend(BE)架构 3 Doris核心概念详解 3.1 数据分布模型 3.2 Tablet与Replica 3.3 数据模型 4 Doris关键技术解析 4.1 存储引擎 4.2 查询执…...

C#面试问题41-60
41. What is the Singleton design pattern? Singleton is a class that only allows creating a single instance of itselt. 单例设计模式是一个类,它只允许创建自己的单个实例。 构造函数防止他在单例类以外的地方被调用。 使用情景:need a sing…...