A 题:震源属性识别模型构建与震级预测 :代码分析:
问题一:
import numpy as np
import matplotlib.pyplot as plt
import seaborn as sns
from sklearn.svm import SVC
from sklearn.model_selection import train_test_split
from sklearn.metrics import accuracy_score
import matplotlib.font_manager as fm
# 读取文件夹中的地震波数据和标签
data = []
labels = []
folder_path = "A/"# 读取文件夹中的所有数据文件
for i in range(1, 8):for j in range(1, 21):file_path = folder_path + f"附件{i}/{j}.txt"with open(file_path, "r") as file:lines = file.readlines()wave_data = []for line in lines:line_data = line.strip().split()  # 分割成单个浮点数line_data = np.array([float(num) for num in line_data])  # 转换为浮点数类型wave_data.extend(line_data)data.append(wave_data)labels.append("天然地震")for i in range(1, 31):file_path = folder_path + f"附件8/{i}.txt"with open(file_path, "r") as file:lines = file.readlines()wave_data = []for line in lines:line_data = line.strip().split()  # 分割成单个浮点数line_data = np.array([float(num) for num in line_data])  # 转换为浮点数类型wave_data.extend(line_data)data.append(wave_data)labels.append("非天然地震")# 将数据转换为numpy数组
data = np.array(data)
labels = np.array(labels)# 划分训练集和测试集
X_train, X_test, y_train, y_test = train_test_split(data, labels, test_size=0.2, random_state=42)# 创建SVM分类器
model = SVC()# 训练模型
model.fit(X_train, y_train)# 在测试集上进行预测
y_pred = model.predict(X_test)# 计算准确率
accuracy = accuracy_score(y_test, y_pred)
print("准确率:", accuracy)# 绘制折线图
sns.set(style="darkgrid")
plt.rcParams['font.family'] = 'Arial Unicode MS'
# 显示真实结果和预测结果
plt.plot(y_test, label='True Labels')
plt.plot(y_pred, label='Predicted Labels')
plt.xlabel("Sample Index")
plt.ylabel("Label")
plt.title("True and Predicted Labels")
plt.legend()plt.tight_layout()
plt.show()
当对这段代码进行分块分析时,可以将其分为以下几个部分:
第一部分:
import numpy as np
import matplotlib.pyplot as plt
import seaborn as snsfrom sklearn.svm
import SVCfrom sklearn.model_selection
import train_test_splitfrom sklearn.metrics
import accuracy_scoreimport matplotlib.font_manager as fm
这部分代码包含了引入需要使用的Python库。
第二部分:
# 读取文件夹中的地震波数据和标签
data = []
labels = []
folder_path = "A/"
# 读取文件夹中的所有数据文件for i in range(1, 8):for j in range(1, 21):file_path = folder_path + f"附件{i}/{j}.txt"with open(file_path, "r") as file:lines = file.readlines()wave_data = []for line in lines:line_data = line.strip().split()  # 分割成单个浮点数line_data = np.array([float(num) for num in line_data])  # 转换为浮点数类型wave_data.extend(line_data)data.append(wave_data)labels.append("天然地震")
for i in range(1, 31):file_path = folder_path + f"附件8/{i}.txt"with open(file_path, "r") as file:lines = file.readlines()wave_data = []for line in lines:line_data = line.strip().split()  # 分割成单个浮点数line_data = np.array([float(num) for num in line_data])  # 转换为浮点数类型wave_data.extend(line_data)data.append(wave_data)labels.append("非天然地震")
这部分代码读取文件夹中的地震波数据和标签,将数据存储在data变量中,将标签存储在labels变量中。
通过嵌套循环,依次读取每个数据文件,将文件路径拼接后通过open函数读取文件内容,并使用readlines方法获取每行的数据。然后,通过字符串处理和类型转换,将每行数据转换为numpy数组,并将数据按照附件类型加入data列表中,同时将标签加入labels列表中。
第三部分:
# 将数据转换为numpy数组
data = np.array(data)
labels = np.array(labels)
这部分代码将data和labels列表转换为numpy数组。
第四部分:
# 划分训练集和测试集
X_train, X_test, y_train, y_test = train_test_split(data, labels, test_size=0.2, random_state=42)
这部分代码使用train_test_split函数将数据和标签划分为训练集和测试集,其中test_size参数指定了测试集大小的比例,random_state参数用于指定随机数种子。
第五部分:
# 创建SVM分类器
model = SVC()
# 训练模型
model.fit(X_train, y_train)
这部分代码创建一个支持向量机分类器模型,并通过fit方法对模型进行训练。
第六部分:
# 在测试集上进行预测
y_pred = model.predict(X_test)
# 计算准确率
accuracy = accuracy_score(y_test, y_pred)print("准确率:", accuracy)
这部分代码使用训练好的模型对测试集进行预测,然后通过accuracy_score函数计算模型在测试集上的准确率,并将结果打印出来。
第七部分:
# 绘制折线图
sns.set(style="darkgrid")
plt.rcParams['font.family'] = 'Arial Unicode MS'# 显示真实结果和预测结果
plt.plot(y_test, label='True Labels')
plt.plot(y_pred, label='Predicted Labels')
plt.xlabel("Sample Index")
plt.ylabel("Label")
plt.title("True and Predicted Labels")
plt.legend()plt.tight_layout()
plt.show()
这部分代码使用matplotlib.pyplot和seaborn库绘制折线图,将真实结果和预测结果进行可视化展示。设置了横坐标和纵坐标标签,添加了图表标题,并使用legend函数添加图例。
最后,使用tight_layout函数调整图表布局,并使用show函数显示图表。
问题二:
import os
import numpy as np
import matplotlib.pyplot as plt
from sklearn.linear_model import LinearRegression
import matplotlib
matplotlib.rcParams['font.family'] = 'Arial Unicode MS'
# 训练集数据路径
train_folder = 'A/'
train_labels = [4.2, 5.0, 6.0, 6.4, 7.0, 7.4, 8.0]
X_train = []
y_train = []# 读取训练集数据
for i, label in enumerate(train_labels):folder_path = os.path.join(train_folder, f"附件{i+1}")for file in os.listdir(folder_path):if file.endswith('.txt'):file_path = os.path.join(folder_path, file)with open(file_path, 'r') as f:lines = f.readlines()magnitudes = []for line in lines[:20]:  # 只读取每个文件的前20个数据magnitude = float(line.strip().split()[0])magnitudes.append(magnitude)X_train.append(magnitudes)y_train.append(label)X_train = np.array(X_train)
y_train = np.array(y_train)# 建立线性回归模型
model = LinearRegression()
# 模型训练
model.fit(X_train, y_train)# 测试集数据路径
test_folder = os.path.join(train_folder, '附件9')
X_test = []# 读取测试集数据
for file in os.listdir(test_folder):if file.endswith('.txt'):file_path = os.path.join(test_folder, file)with open(file_path, 'r') as f:lines = f.readlines()magnitudes = []for line in lines[:12]:  # 只读取12个数据magnitude = float(line.strip().split()[0])magnitudes.append(magnitude)X_test.append(magnitudes)X_test = np.array(X_test)# 预测地震震级
y_pred = model.predict(X_test)# 生成折线图
x_axis = np.arange(1, len(y_pred) + 1)
plt.plot(x_axis, y_pred, marker='o')# 设置横轴刻度和标签
plt.xticks(x_axis)# 设置图表标题和坐标轴标签
plt.title('预测地震事件的地震震级')
plt.xlabel('事件编号')
plt.ylabel('地震震级')plt.show()
当对这段代码进行分块分析时,可以将其分为以下几个部分:
第一部分:
import osimport numpy as npfrom sklearn.linear_model import LinearRegression
这部分代码包含了引入需要使用的Python库。
第二部分:
# 训练集数据路径
train_folder = 'A/'
train_labels = [4.2, 5.0, 6.0, 6.4, 7.0, 7.4, 8.0]
X_train = []
y_train = []
# 读取训练集数据for i, label in enumerate(train_labels):folder_path = os.path.join(train_folder, f"附件{i+1}")for file in os.listdir(folder_path):if file.endswith('.txt'):file_path = os.path.join(folder_path, file)with open(file_path, 'r') as f:lines = f.readlines()magnitudes = []for line in lines[:20]:  # 只读取每个文件的前20个数据magnitude = float(line.strip().split()[0])magnitudes.append(magnitude)X_train.append(magnitudes)y_train.append(label)X_train = np.array(X_train)
y_train = np.array(y_train)
这部分代码定义了训练集的文件夹路径、标签列表以及空的X_train和y_train列表。
通过嵌套循环,依次遍历训练集的文件夹和文件。使用os.path.join函数拼接文件夹路径和文件名,通过open函数打开文件,并使用readlines方法获取每行的数据。然后,通过字符串处理和类型转换,将每行数据的第一个数值转换为浮点数,并将前20个数据加入X_train列表中,同时将对应的标签加入y_train列表中。
最后,将X_train列表和y_train列表转换为numpy数组。
第三部分:
# 建立线性回归模型
model = LinearRegression()# 模型训练
model.fit(X_train, y_train)
这部分代码创建了一个线性回归模型,并通过fit方法对模型进行训练。
第四部分:
# 测试集数据路径
test_folder = os.path.join(train_folder, '附件9')
X_test = []
# 读取测试集数据for file in os.listdir(test_folder):if file.endswith('.txt'):file_path = os.path.join(test_folder, file)with open(file_path, 'r') as f:lines = f.readlines()magnitudes = []for line in lines[:12]:  # 只读取12个数据magnitude = float(line.strip().split()[0])magnitudes.append(magnitude)X_test.append(magnitudes)X_test = np.array(X_test)
这部分代码定义了测试集的文件夹路径以及空的X_test列表。
通过os.path.join函数拼接文件夹路径和文件名,使用open函数打开文件,并使用readlines方法获取每行的数据。然后,通过字符串处理和类型转换,将每行数据的第一个数值转换为浮点数,并将前12个数据加入X_test列表中。
最后,将X_test列表转换为numpy数组。
第五部分:
# 预测地震震级
y_pred = model.predict(X_test)
# 打印预测结果print('预测地震事件的地震震级为:')for i, pred in enumerate(y_pred):print(f'事件{i+1}: {round(pred, 1)}')
这部分代码使用训练好的线性回归模型对测试集进行预测,将预测结果存储在y_pred变量中,并通过循环打印每个事件的预测地震震级。
当对这段代码进行分块分析时,可以将其分为以下几个部分:
第一部分:
import osimport numpy as np
import matplotlib.pyplot as pltfrom sklearn.linear_model
import LinearRegression
import matplotlib
matplotlib.rcParams['font.family'] = 'Arial Unicode MS'
这部分代码包含了引入需要使用的Python库,并设置使用的字体为’Arial Unicode MS’。
第二部分:
# 训练集数据路径
train_folder = 'A/'
train_labels = [4.2, 5.0, 6.0, 6.4, 7.0, 7.4, 8.0]
X_train = []
y_train = []
# 读取训练集数据for i, label in enumerate(train_labels):folder_path = os.path.join(train_folder, f"附件{i+1}")for file in os.listdir(folder_path):if file.endswith('.txt'):file_path = os.path.join(folder_path, file)with open(file_path, 'r') as f:lines = f.readlines()magnitudes = []for line in lines[:20]:  # 只读取每个文件的前20个数据magnitude = float(line.strip().split()[0])magnitudes.append(magnitude)X_train.append(magnitudes)y_train.append(label)X_train = np.array(X_train)
y_train = np.array(y_train)
这部分代码定义了训练集的文件夹路径、标签列表以及空的X_train和y_train列表。
通过嵌套循环,依次遍历训练集的文件夹和文件。使用os.path.join函数拼接文件夹路径和文件名,通过open函数打开文件,并使用readlines方法获取每行的数据。然后,通过字符串处理和类型转换,将每行数据的第一个数值转换为浮点数,并将前20个数据加入X_train列表中,同时将对应的标签加入y_train列表中。
最后,将X_train列表和y_train列表转换为numpy数组。
第三部分:
# 建立线性回归模型
model = LinearRegression()# 模型训练
model.fit(X_train, y_train)
这部分代码创建了一个线性回归模型,并通过fit方法对模型进行训练。
第四部分:
# 测试集数据路径
test_folder = os.path.join(train_folder, '附件9')
X_test = []
# 读取测试集数据for file in os.listdir(test_folder):if file.endswith('.txt'):file_path = os.path.join(test_folder, file)with open(file_path, 'r') as f:lines = f.readlines()magnitudes = []for line in lines[:12]:  # 只读取12个数据magnitude = float(line.strip().split()[0])magnitudes.append(magnitude)X_test.append(magnitudes)X_test = np.array(X_test)
这部分代码定义了测试集的文件夹路径以及空的X_test列表。
通过os.path.join函数拼接文件夹路径和文件名,使用open函数打开文件,并使用readlines方法获取每行的数据。然后,通过字符串处理和类型转换,将每行数据的第一个数值转换为浮点数,并将前12个数据加入X_test列表中。
最后,将X_test列表转换为numpy数组。
第五部分:
# 预测地震震级
y_pred = model.predict(X_test)
这部分代码使用训练好的线性回归模型对测试集进行预测,将预测结果存储在y_pred变量中。
第六部分:
# 生成折线图
x_axis = np.arange(1, len(y_pred) + 1)
plt.plot(x_axis, y_pred, marker='o')
# 设置横轴刻度和标签
plt.xticks(x_axis)
# 设置图表标题和坐标轴标签
plt.title('预测地震事件的地震震级')
plt.xlabel('事件编号')
plt.ylabel('地震震级')plt.show()
这部分代码使用Matplotlib库生成折线图,其中x_axis定义了横轴刻度,plt.plot绘制折线图并设置了标记点,plt.xticks设置横轴刻度和标签,plt.title、plt.xlabel和plt.ylabel设置图表标题和坐标轴标签。最后,通过plt.show显示生成的折线图。
问题三:
import pandas as pd
from sklearn.linear_model import LinearRegression
from sklearn.preprocessing import LabelEncoder
from sklearn.model_selection import train_test_split
from sklearn.metrics import mean_squared_error# 读取数据
data = pd.read_csv('A\附件10.csv')# 将分类变量进行标签编码
label_encoder = LabelEncoder()
data['断层类型'] = label_encoder.fit_transform(data['断层类型'])
data['构造活动/基本烈度'] = label_encoder.fit_transform(data['构造活动/基本烈度'])
data['岩性'] = label_encoder.fit_transform(data['岩性'])# 准备自变量和因变量
X = data[['库深/m', '库容', '断层类型', '构造活动/基本烈度', '岩性']]
y = data['震级']# 拆分数据集
X_train, X_test, y_train, y_test = train_test_split(X, y, test_size=0.2, random_state=42)# 构建线性回归模型并拟合数据
model = LinearRegression()
model.fit(X_train, y_train)# 打印回归系数和截距
print('回归系数:', model.coef_)
print('截距:', model.intercept_)# 预测并评估模型
y_pred = model.predict(X_test)
rmse = mean_squared_error(y_test, y_pred, squared=False)
print('均方根误差:', rmse)
当对这段代码进行分块分析时,可以将其分为以下几个部分:
第一部分:
import pandas as pdfrom sklearn.linear_model
import LinearRegressionfrom sklearn.preprocessing
import LabelEncoderfrom sklearn.model_selection
import train_test_splitfrom sklearn.metrics
import mean_squared_error
这部分代码包含了引入需要使用的Python库。
第二部分:
# 读取数据
data = pd.read_csv('A\附件10.csv')
这部分代码使用pandas库的read_csv函数读取名为"附件10.csv"的CSV文件,并将数据存储在data变量中。
第三部分:
# 将分类变量进行标签编码
label_encoder = LabelEncoder()
data['断层类型'] = label_encoder.fit_transform(data['断层类型'])
data['构造活动/基本烈度'] = label_encoder.fit_transform(data['构造活动/基本烈度'])
data['岩性'] = label_encoder.fit_transform(data['岩性'])
这部分代码使用sklearn.preprocessing库的LabelEncoder类对数据中的分类变量进行标签编码,将其转换为数值形式。
第四部分:
# 准备自变量和因变量
X = data[['库深/m', '库容', '断层类型', '构造活动/基本烈度', '岩性']]
y = data['震级']
这部分代码将编码后的自变量存储在X变量中,将因变量存储在y变量中。
第五部分:
# 拆分数据集
X_train, X_test, y_train, y_test = train_test_split(X, y, test_size=0.2, random_state=42)
这部分代码使用sklearn.model_selection库的train_test_split函数将数据集拆分为训练集和测试集,其中训练集占80%,测试集占20%。
第六部分:
# 构建线性回归模型并拟合数据
model = LinearRegression()
model.fit(X_train, y_train)
这部分代码使用sklearn.linear_model库的LinearRegression类构建一个线性回归模型,并使用训练集数据对模型进行拟合。
第七部分:
# 打印回归系数和截距
print('回归系数:', model.coef_)
print('截距:', model.intercept_)
这部分代码打印出线性回归模型的回归系数和截距。
第八部分:
# 预测并评估模型
y_pred = model.predict(X_test)
rmse = mean_squared_error(y_test, y_pred, squared=False)print('均方根误差:', rmse)
这部分代码使用训练好的回归模型对测试集数据进行预测,并计算预测结果与实际结果之间的均方根误差,最后将均方根误差打印出来。
相关文章:

A 题:震源属性识别模型构建与震级预测 :代码分析:
问题 1: 针对附件 1~8 中的地震波数据,找出一系列合适的指 标与判据,构建震源属性识别模型,进行天然地震事件(附件 1~7) 与非天然地震事件(附件 8)的准确区…...
源码分析CompletableFuture使用默认线程池ForkJoinPool的弊端
先说结论: 假如有20CompletableFuture任务并发执行时,都使用默认线程池ForkJoinPool,但cpu的核心数又小于3,那么就会新建20个线程(不使用默认线程池了),这20个线程相互竞争cpu资源和内存&#x…...

连接pgsql数据库 sslmode sslrootcert sslkey sslcert 参数的作用
sslmode 参数的作用 sslmode 参数用于指定数据库连接时使用的 SSL 加密模式。SSL(Secure Sockets Layer)是一种加密协议,用于保护数据在客户端和服务器之间的传输过程,以增加数据传输的安全性。sslmode 参数可以设置不同的值&…...

从零学算法3
3.给定一个字符串 s ,请你找出其中不含有重复字符的 最长子串 的长度。 示例 1: 输入: “abcabcbb” 输出: 3 解释: 因为无重复字符的最长子串是 “abc”,所以其长度为 3。 示例 2: 输入: “bbbbb” 输出: 1 解释: 因为无重复字符的最长子串是 “b”&…...
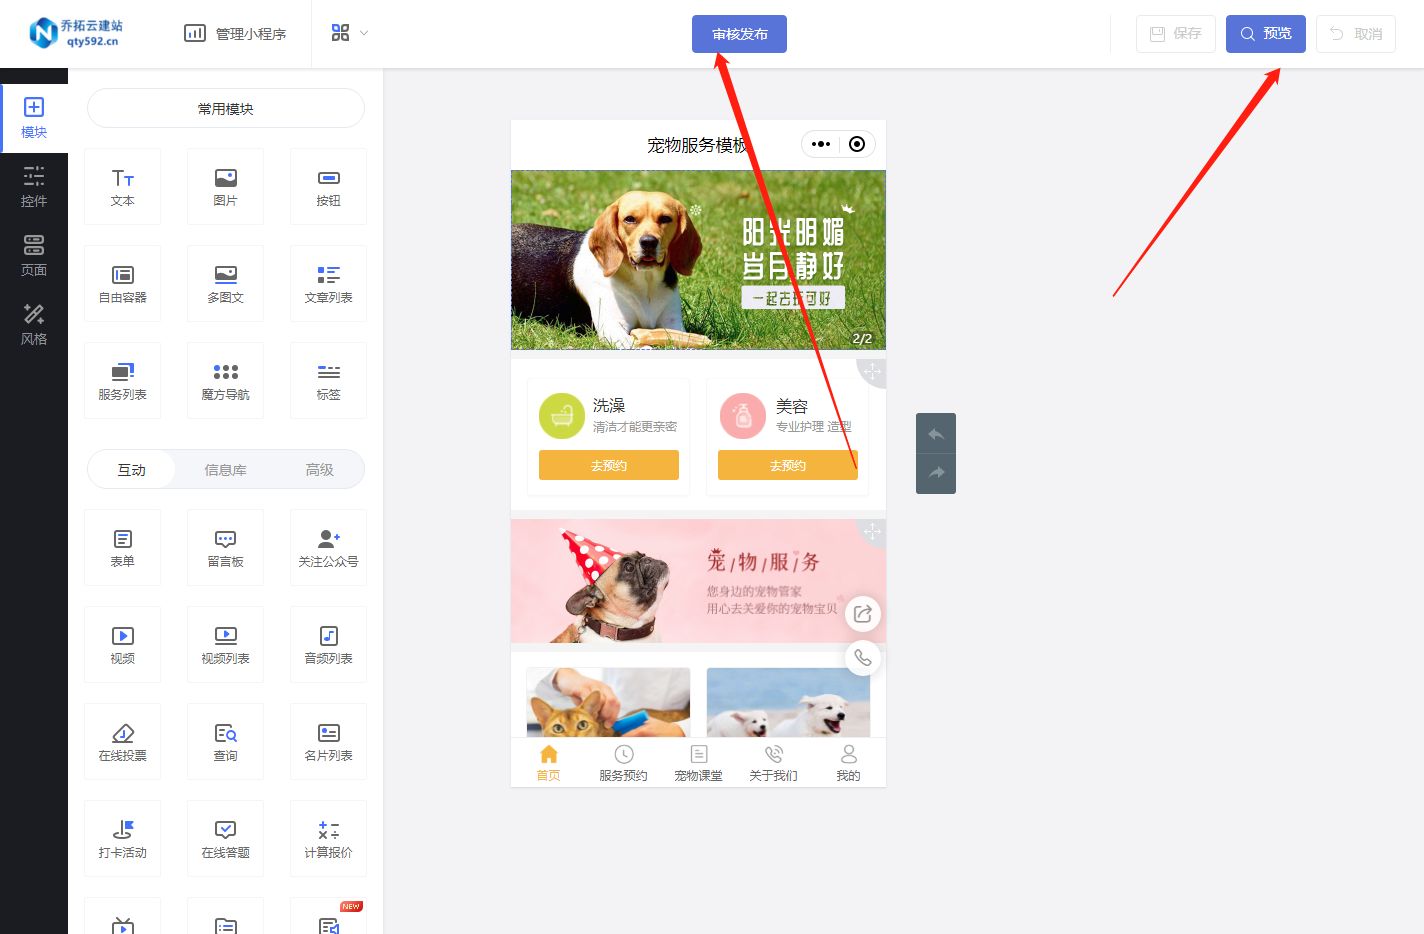
宠物小程序开发
在当今社会,宠物已成为许多人生活中不可或缺的一部分。宠物市场的持续增长为创业者提供了巨大的商机。然而,作为一个创业者,要在竞争激烈的宠物市场中脱颖而出并不容易。因此,开发一个专属于自己的宠物小程序成为了解决这一难题的…...
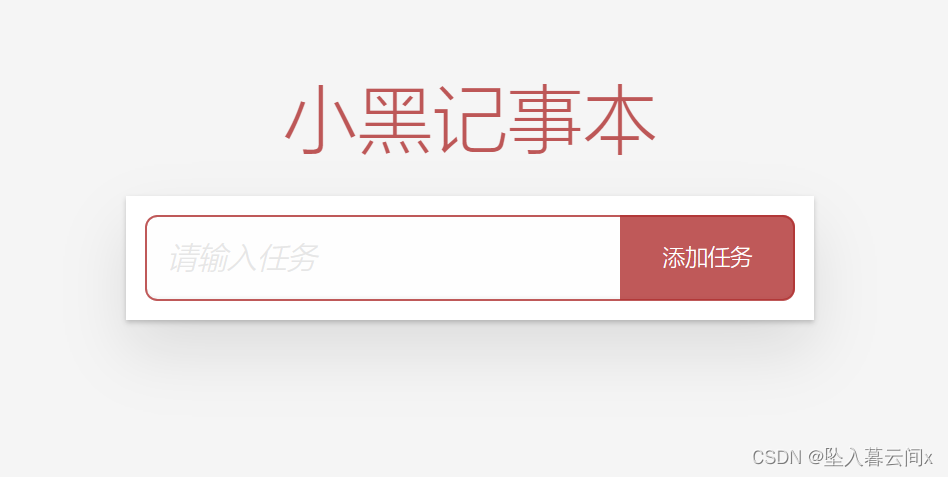
07-Vue基础之综合案例——小黑记事本
个人名片: 😊作者简介:一名大二在校生 🤡 个人主页:坠入暮云间x 🐼座右铭:懒惰受到的惩罚不仅仅是自己的失败,还有别人的成功。 🎅**学习目标: 坚持每一次的学习打卡 文章…...
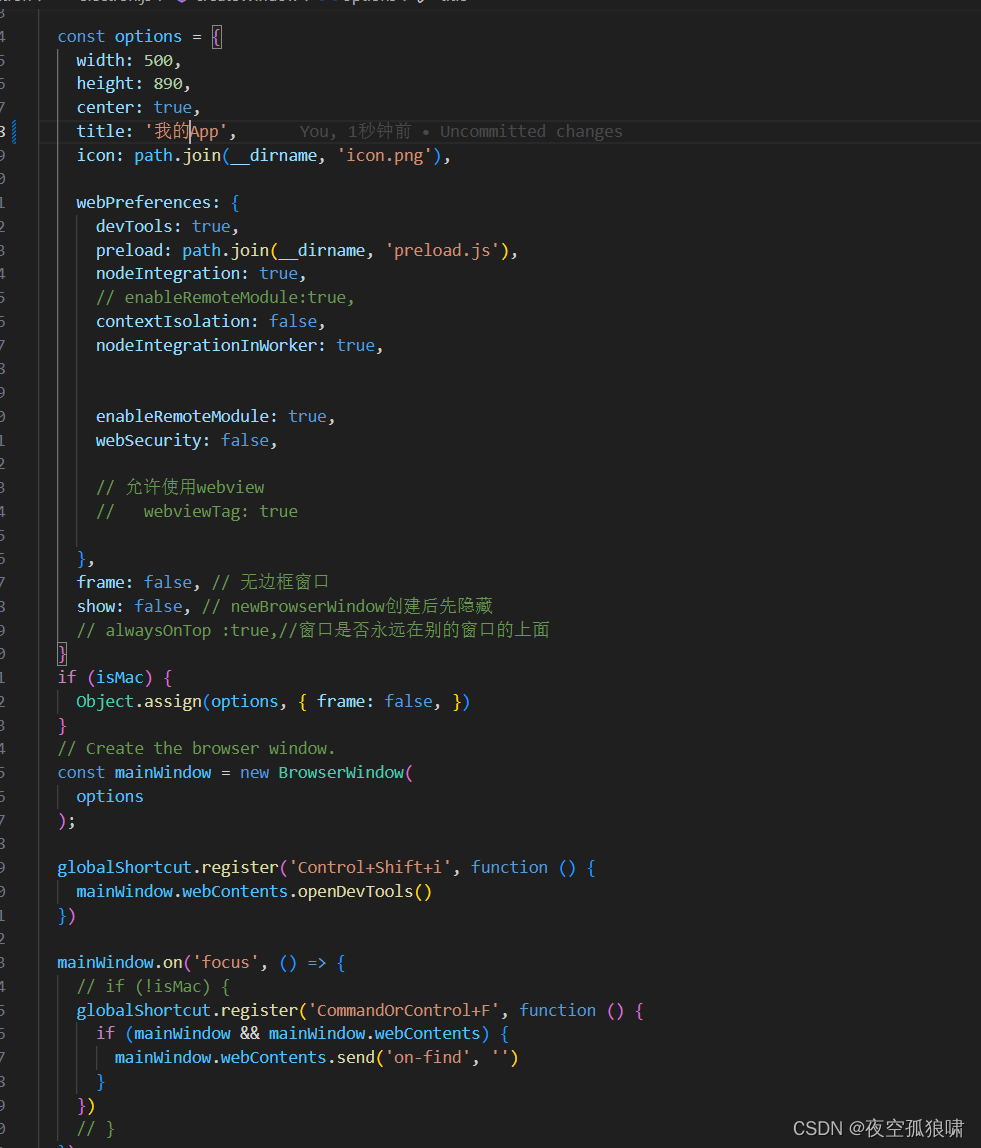
vite4+vue3+electron23.3+ts桌面应用bs端开发 打包windows、linux、max三个系统的安装包
vite4vue3electron23.3ts桌面应用bs端开发 打包windows、linux、max三个系统的安装包 主要包依赖 "electron-store": "^8.1.0", //全局数据状态管理,可选择性安装"electron": "23.3.8","electron-builder": &q…...
限制 el-input 输入 emoji
1. 电脑如何输入 emoji 表情 ? 快捷键 win; 或 win. 2. 代码实现 <template><el-input v-model"input" placeholder"请输入内容" input"inputChange"></el-input> </template><script> export default {name: D…...

【AI】解决Number_Words的安装和使用
It appears that you encountered an error while trying to install the “Numbers_Words” package using the specific version 0.18.2 of the PEAR channel. The error message indicates that there was a problem unpacking the “Math_BigInteger-1.0.3” package, whi…...

开启MySQL的binlog日志
在/etc/my.cnf增加如下配置 #binlog相关 log-bin /testdata/mysql/log/bin/mysql-bin expire_logs_days 7 binlog-format ROW binlog_cache_size 4M max_binlog_cache_size 20G binlog_rows_query_log_events 1 binlog_row_image FULL sync_binlog 1 log_bin_trust_fun…...

【支付宝小程序】支付宝小程序自定义组件技术教程
🦖我是Sam9029,一个前端 Sam9029的CSDN博客主页:Sam9029的博客_CSDN博客-JS学习,CSS学习,Vue-2领域博主 **🐱🐉🐱🐉恭喜你,若此文你认为写的不错,不要吝啬你的赞扬,…...
)
CSDN编程题-每日一练(2023-08-23)
CSDN编程题-每日一练(2023-08-23) 一、题目名称:圆小艺二、题目名称:连续子数组的最大和三、题目名称:投篮一、题目名称:圆小艺 时间限制:1000ms内存限制:256M 题目描述: 最近小艺酱渐渐变成了一个圆滑的形状-球!! 小艺酱开始变得喜欢上球! 小艺酱得到n个同心圆。 …...
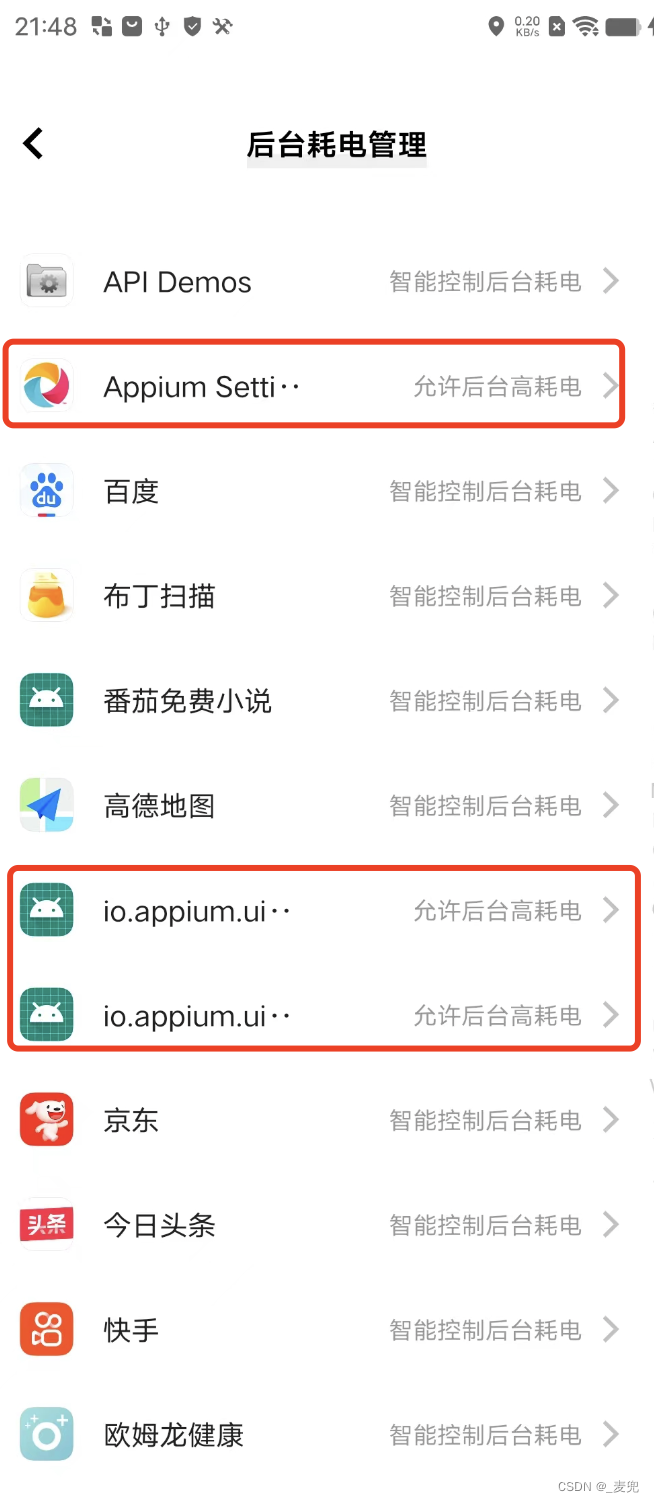
解决:Appium Inspector刷新页面一直加载转圈
目录 问题:Appium Inspector刷新页面一直加载转圈 解决办法: 1.进入设置页面-电池-后台耗电管理 2.找到下面3个应用,修改为允许后台高耗电 问题:Appium Inspector刷新页面一直加载转圈 1、手机进行操作后,Appium I…...
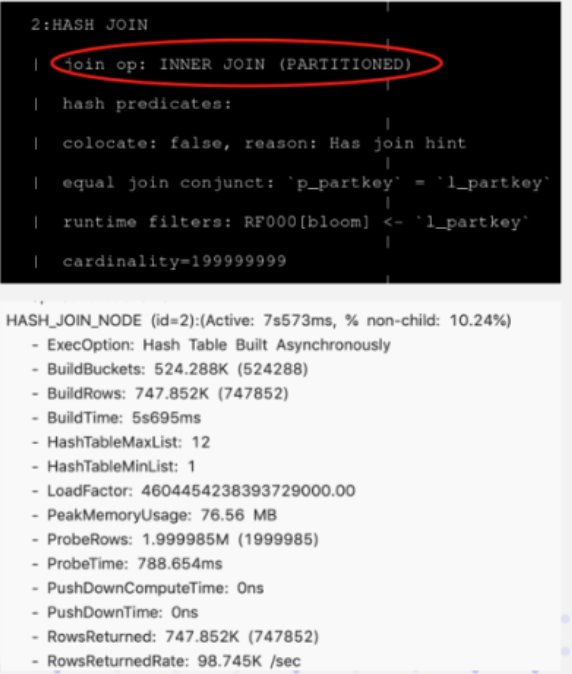
Apache Doris 入门教程34:Join 优化
Bucket Shuffle Join Bucket Shuffle Join 是在 Doris 0.14 版本中正式加入的新功能。旨在为某些 Join 查询提供本地性优化,来减少数据在节点间的传输耗时,来加速查询。 它的设计、实现和效果可以参阅 上面的图片展示了Bucket Shuffle Join的工作原理…...
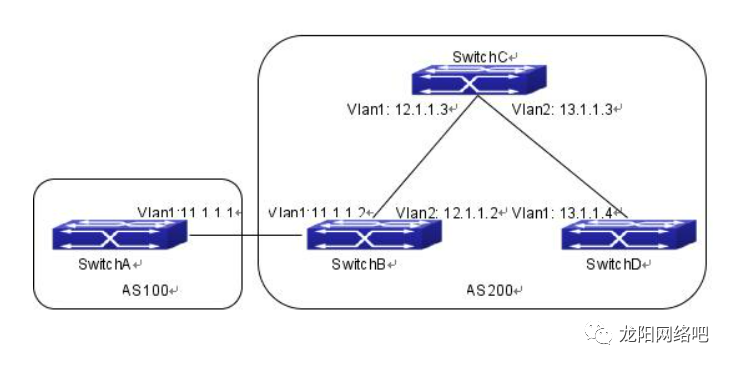
【神州数码】BGP路由器案例
SwitchB、SwitchC和SwitchD位于AS200中,SwitchA位于AS100中。SwitchA和SwitchB共享一个相同的网络段11.0.0.0。而SwitchB和SwitchD彼此物理上不相邻。 则SwitchA的配置如下: SwitchA(config)#router bgp 100SwitchA(config-router-bgp)#neighbor 11.1.1…...

gin框架实现大文件下载
在gin框架中实现大文件下载主要分为两个步骤: 将文件分块读取 由于大文件一次性读取会占用大量内存,容易导致内存溢出等问题,需要将文件分块读取,逐一发送给客户端。 在gin框架中,可以使用context.File方法向客户端…...
数据可视化-canvas-svg-Echarts
数据可视化 技术栈 canvas <canvas width"300" height"300"></canvas>当没有设置宽度和高度的时候,canvas 会初始化宽度为 300 像素和高度为 150 像素。切记不能通过样式去设置画布的宽度与高度宽高必须通过属性设置,…...
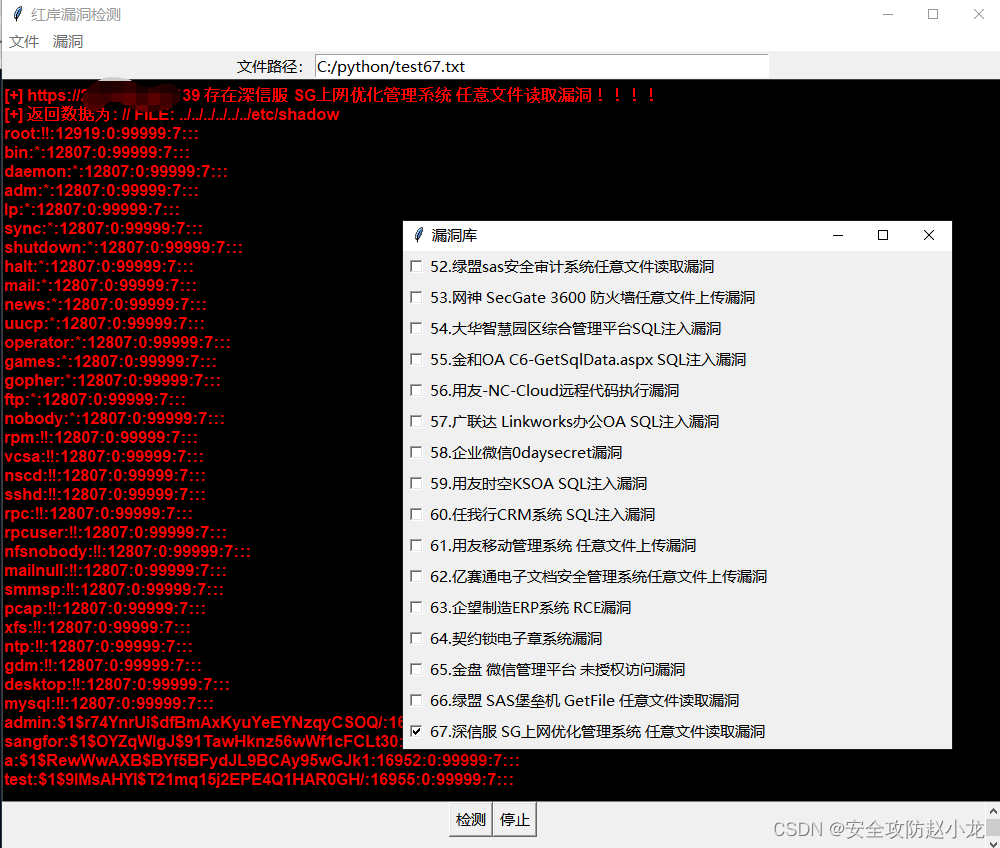
深信服 SG上网优化管理系统 catjs.php 任意文件读取漏洞[2023-HW]
深信服 SG上网优化管理系统 catjs.php 任意文件读取漏洞 一、漏洞描述二、漏洞影响三、网络测绘四、漏洞复现小龙POC检测: 五、 修复建议 免责声明:请勿利用文章内的相关技术从事非法测试,由于传播、利用此文所提供的信息或者工具而造成的任何直接或者间…...

java反序列化泛型中json对象
使用 jackson的objectMapper 来实现 import com.fasterxml.jackson.core.JsonProcessingException; import com.fasterxml.jackson.core.type.TypeReference; import com.fasterxml.jackson.databind.DeserializationFeature; import com.fasterxml.jackson.databind.ObjectMa…...

Docker Compose一键管理容器
可以一键批量管理docker的容器。将所有需要创建的容器定义在compose配置文件中,通过一个命令一键可以创建并运行这些容器,而不需要一个一个启动。可以批量启动停止服务。 安装 #安装Docker-Compose并安装到/usr/local/bin/docker-compose curl -L &quo…...

利用taotoken token plan套餐为stm32长期ai项目控制成本
🚀 告别海外账号与网络限制!稳定直连全球优质大模型,限时半价接入中。 👉 点击领取海量免费额度 利用 Taotoken Token Plan 套餐为 STM32 长期 AI 项目控制成本 对于计划在 STM32 产品中持续集成 AI 功能的项目负责人而言&#x…...

实战复盘:我是如何通过一个SSRF漏洞,利用Gopher协议拿下内网Redis的
从SSRF到内网Redis入侵:一次真实渗透测试的深度剖析 那天下午,我正在对某企业Web应用进行常规安全评估。一个看似普通的文件下载接口引起了我的注意——它接受URL参数并返回对应资源内容。直觉告诉我,这里可能存在SSRF漏洞。接下来的72小时&a…...

onlybooks/llm项目解析:大语言模型本地部署与微调实战指南
1. 项目概述与核心价值最近在折腾大语言模型本地部署和微调的朋友,估计没少在各种开源社区和模型仓库里翻找。我自己也是,从早期的GPT-2到现在的各种百亿、千亿参数模型,一路踩坑过来,深感一个清晰、易用、维护良好的项目对效率提…...

第八部分-企业级实践——40. 容器成本优化
40. 容器成本优化 1. 成本优化概述 容器成本优化涉及资源利用率、云成本、存储成本、运维成本等多个维度。通过合理配置和优化策略,可以显著降低容器化环境的总体拥有成本(TCO)。 ┌────────────────────────────…...

基于Nuxt 4与Shadcn/ui的现代全栈仪表板开发实战
1. 项目概述:一个现代全栈仪表板的技术栈选择 最近在做一个内部管理后台,需要快速搭建一个既美观又功能齐全的仪表板。我的核心需求很明确:开发要快、代码质量要高、用户体验要好,并且要能轻松应对多语言场景。在评估了市面上各种…...

Gemini3.1Pro:商业分析框架搭建神器
做咨询的人都知道,真正难的从来不是“找到信息”,而是“把信息组织成框架”。 很多商业分析问题看起来复杂,本质上都是在有限时间内,把零散材料整理成一个能支撑判断的逻辑结构。如果你经常做行业分析、竞品分析、市场调研、经营诊…...

Gemini3.1Pro透明化指南:模型卡与数据卡入口解析
在 2026 年,越来越多的团队开始把“模型怎么用”升级为“模型用得是否可控、可追溯”。尤其是涉及合规审计、数据治理与风险评估时,工程侧最需要的往往是:能快速找到模型信息与数据来源的透明化页面入口,确保链路清晰、记录完整、…...

人工智能【第22篇】Seq2Seq模型与注意力机制:机器翻译的基石
作者的话:在前面的文章中,我们学习了RNN、LSTM以及NLP的基础知识。现在让我们进入NLP的核心应用——机器翻译。Seq2Seq(Sequence to Sequence)模型是机器翻译的基石,而注意力机制(Attention)的出…...

管道工程必看避坑指南粮油储罐通气帽选型要点
在粮油仓储的体系当中,通气帽看起来是一个不显得很起眼的小零件,却常常在关键的时候出现变化。我们看到很多项目,前期设计的时候非常华丽色彩很鲜艳,到后期运行的时候经常出现故障,去探究原因,原来是通气帽…...

EchoType开源键盘固件:基于状态感知的智能输入引擎深度解析
1. 项目概述:从“EchoType”看开源键盘固件的深度定制最近在键盘客制化圈子里,一个名为“EchoType”的项目开始被一些资深玩家频繁提及。它的GitHub仓库地址是ljyou001/echotype,从名字上你就能猜到,这大概率是一个与键盘固件、打…...