数据可视化-canvas-svg-Echarts
数据可视化
技术栈

canvas
<canvas width="300" height="300"></canvas>
- 当没有设置宽度和高度的时候,canvas 会初始化宽度为 300 像素和高度为 150 像素。切记不能通过样式去设置画布的宽度与高度
- 宽高必须通过属性设置,如果使用样式设置,会导致画布内的坐标出现问题
- 给canvas画布添加文本内容、子节点没有任何意义
- 浏览器认为canvas标签是一张图片,右键可保存图片
- 你想操作canvas画布:画布当中绘制图形、显示一个文字,都必须通过JS完成
获取上下文
const canvas = document.querySelector('canvas');
// 获取canvas的上下文 相当于笔
const ctx = canvas.getContext('2d');
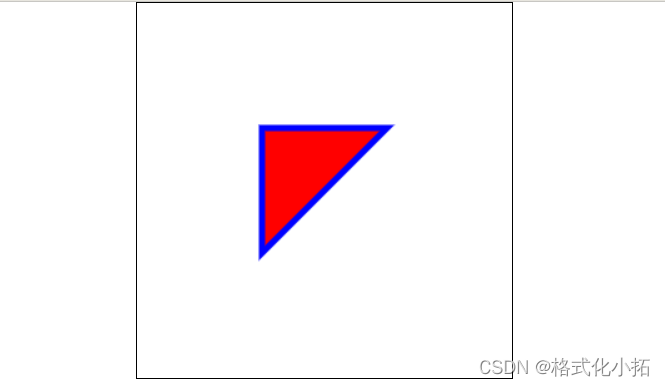
绘制线段
1.线段的起点 x,y
ctx.moveTo(100,100);
2.其他点
ctx.lineTo(100,200);
ctx.lineTo(200,100);
3.绘制线段
ctx.stroke();
4.图形的填充颜色
ctx.fillStyle = 'red';
5.填充
ctx.fill();
6.线段的颜色,宽度
ctx.strokeStyle = 'blue';
ctx.lineWidth = '5';
7.将起点和终点连接
ctx.closePath();
<style>*{margin: 0;padding: 0;box-sizing: border-box;}body{display: flex;align-items: center;justify-content: center;}canvas{border: 1px solid black;}
</style>
<body><canvas width="300" height="300"></canvas><script>const canvas = document.querySelector('canvas');// 获取canvas的上下文 相当于笔const ctx = canvas.getContext('2d');// 线段的起点 x,yctx.moveTo(100,100);// 其他点ctx.lineTo(100,200);ctx.lineTo(200,100);// 图形的填充颜色ctx.fillStyle = 'red';// 填充ctx.fill();// 线段的颜色,宽度ctx.strokeStyle = 'blue';ctx.lineWidth = '5';// 将起点和终点连接ctx.closePath();// stroke方法绘制线段ctx.stroke();</script>
</body>
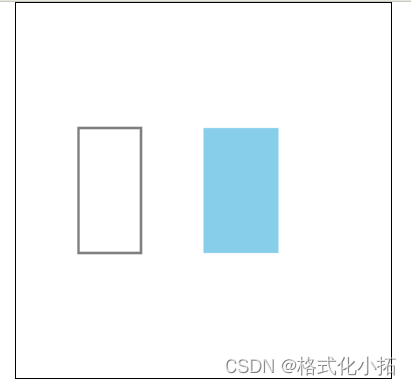
绘制矩形
第一种方式:strokeRect(),参数为x、y、w、h 缺点:没有办法设置填充颜色
ctx.strokeRect(50, 100, 50, 100)
第二种方式:fillRect() ,填充颜色可以替换 绘制图形之前设置填充颜色
ctx.fillStyle = "skyblue"; ctx.fill(); ctx.fillRect(150, 100, 60, 100);
<body><canvas width="300" height="300"></canvas><script>const canvas = document.querySelector('canvas');// 获取canvas的上下文 相当于笔const ctx = canvas.getContext('2d');//绘制矩形// 第一种方式:strokeRect()参数为x、y、w、h 缺点:没有办法设置填充颜色ctx.strokeRect(50, 100, 50, 100)// 第二种方式:fillRect() 填充颜色可以替换 绘制图形之前设置填充颜色ctx.fillStyle = "skyblue";ctx.fill();ctx.fillRect(150, 100, 60, 100);</script>
</body>
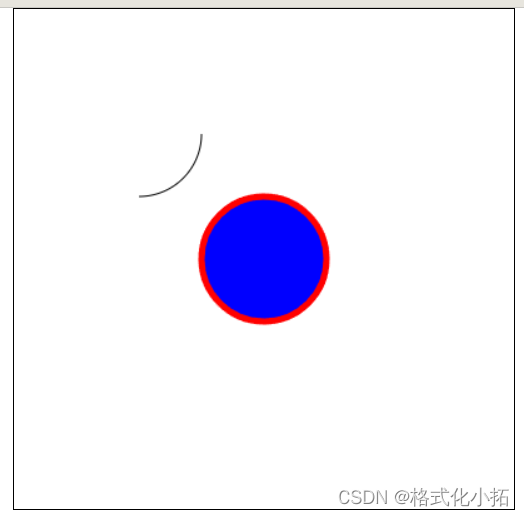
绘制圆形
arc(x, y, radius, starAngle, endAngle, anticlockwise)
- x : 圆心的 x 坐标
- y:圆心的 y 坐标
- radius : 半径
- starAngle :开始角度
- endAngle:结束角度
- anticlockwise :是否逆时针(true)为逆时针,(false)为顺时针
<body><canvas width="400" height="400"></canvas><script>const canvas = document.querySelector('canvas');const ctx = canvas.getContext('2d');// 开始ctx.beginPath();// x,y,r,起始弧度 ,结束弧度,是否逆时针绘制// 2 * PI * 弧度 = 360// 弧ctx.arc(100, 100, 50, 0.5 * Math.PI, 2 * Math.PI, true);// 结束ctx.stroke();// 圆ctx.beginPath();ctx.strokeStyle = 'red';ctx.lineWidth = '5';ctx.arc(200, 200, 50, 0, 2 * Math.PI, true);// 必须放置arc后面ctx.fillStyle = "blue";ctx.fill();ctx.stroke();</script>
</body>
清除路径
清除绘画的路径,多个图形就不会连接在一起
context.beginPath()
context.closePath()
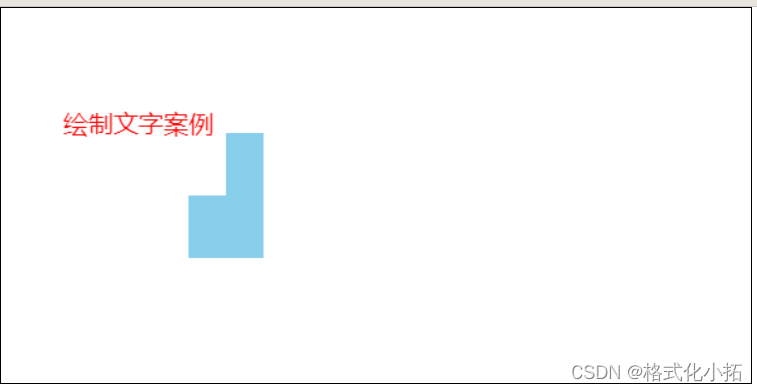
清除矩形区域
当在一个画布反复绘制图形,需要将上一次的图形清空
clearRect(x, y, width, height)
绘制文字
fillText(text, x, y, maxWidth)
<body><!-- 宽高必须通过属性设置,如果使用样式设置,会导致画布内的坐标出现问题 --><canvas width="600" height="300"></canvas><script>const canvas = document.querySelector('canvas');const ctx = canvas.getContext('2d');ctx.fillStyle = "skyblue";ctx.fill();ctx.fillRect(150, 100, 60, 100);// 清除画布-整个画布 起点x,y,width,height// ctx.clearRect(0,0,600,300);// 清除部分画布ctx.clearRect(150, 100, 30, 50);// 文字样式ctx.fillStyle = "red";ctx.font = '20px 微软雅黑';// 绘制文字 tex,x,yctx.fillText('绘制文字案例', 50, 100)</script>
</body>
案例:绘制一个柱状图

<!DOCTYPE html>
<html lang="en"><head><meta charset="UTF-8"><meta name="viewport" content="width=device-width, initial-scale=1.0"><title>案例绘制柱状图</title><style>* {margin: 0;padding: 0;}body {display: flex;justify-content: center;}canvas {border: 1px solid black;}</style>
</head><body><canvas width="800" height="520"></canvas><script>const canvas = document.querySelector('canvas');const ctx = canvas.getContext('2d');// 绘制标题文字ctx.font = '20px 微软雅黑';ctx.fillStyle = '#c23531';ctx.fillText('数据可视化-柱状图', 60, 20);// 绘制坐标轴ctx.moveTo(100, 100);ctx.lineTo(100, 400);ctx.lineTo(700, 400);// y轴ctx.moveTo(100, 100);ctx.lineTo(90, 100);ctx.moveTo(100, 160);ctx.lineTo(90, 160);ctx.moveTo(100, 220);ctx.lineTo(90, 220);ctx.moveTo(100, 280);ctx.lineTo(90, 280);ctx.moveTo(100, 340);ctx.lineTo(90, 340);ctx.moveTo(100, 400);ctx.lineTo(90, 400);// x轴ctx.moveTo(100, 400);ctx.lineTo(100, 410);ctx.moveTo(250, 400);ctx.lineTo(250, 410);ctx.moveTo(400, 400);ctx.lineTo(400, 410);ctx.moveTo(550, 400);ctx.lineTo(550, 410);ctx.moveTo(700, 400);ctx.lineTo(700, 410);ctx.stroke()// 横线ctx.strokeStyle = 'rgb(204, 204, 204)';ctx.moveTo(100, 100);ctx.lineTo(700, 100);ctx.moveTo(100, 160);ctx.lineTo(700, 160);ctx.moveTo(100, 220);ctx.lineTo(700, 220);ctx.moveTo(100, 280);ctx.lineTo(700, 280);ctx.moveTo(100, 340);ctx.lineTo(700, 340);ctx.stroke()// y轴文本ctx.font = '16px 微软雅黑';ctx.fillStyle = 'black';ctx.fillText('150', 60, 108);ctx.fillText('120', 60, 168);ctx.fillText('90', 70, 228);ctx.fillText('60', 70, 288);ctx.fillText('30', 70, 348);ctx.fillText('0', 80, 408);// x轴文本ctx.fillText('食品', 160, 420);ctx.fillText('数码', 310, 420);ctx.fillText('服饰', 460, 420);ctx.fillText('箱包', 610, 420);// 绘制矩形 x,y,width,height 注意高度是向下计算,左上角为起点ctx.fillStyle = '#c23531';ctx.fillRect(120, 340, 110, 60);ctx.fillRect(270, 180, 110, 220);ctx.fillRect(420, 220, 110, 180);ctx.fillRect(570, 100, 110, 300);</script>
</body></html>
![[外链图片转存失败,源站可能有防盗链机制,建议将图片保存下来直接上传(img-3lW85DCu-1692416369798)(../3.js笔记复习/JavaScript.assets/下载.png)]](https://img-blog.csdnimg.cn/ab3fc07cc7ec4c7b9b7f7dc4fee165bf.png)
svg
SVG是一种基于 XML 的图像文件格式,全称为Scalable Vector Graphics,可缩放的矢量图形。
<svg> 包裹并定义整个矢量图。<svg>
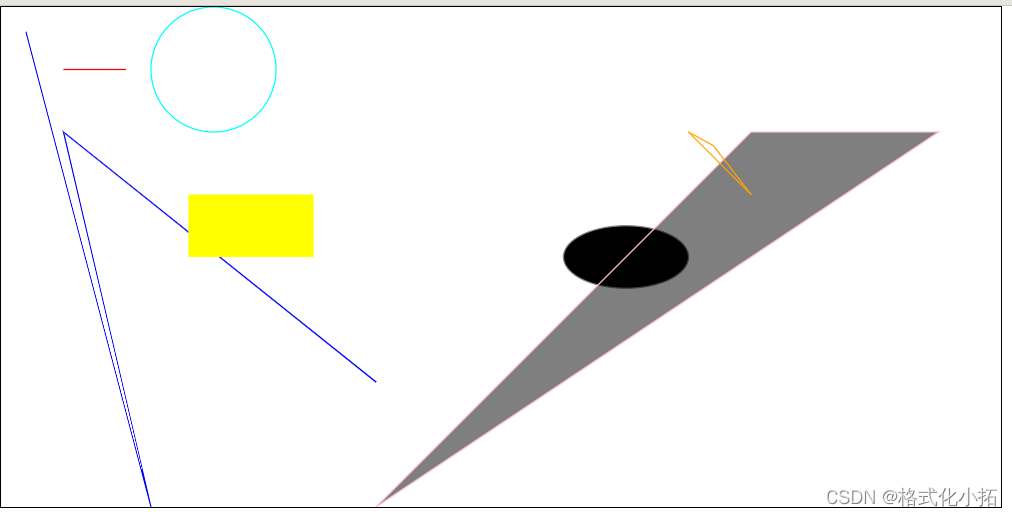
案例
<!DOCTYPE html>
<html lang="en"><head><meta charset="UTF-8"><meta name="viewport" content="width=device-width, initial-scale=1.0"><title>Document</title><style>* {margin: 0;padding: 0;}svg {width: 800px;height: 400px;border: 1px solid black;}</style>
</head><body><!-- 默认300 * 150,绘图必须在svg内部绘制 --><svg><!-- 绘制线段 --><line x1="50" y1="50" x2="100" y2="50" stroke="red"></line><!-- 绘制折线 --><polyline points="300 300,50,100,120 400,20 20" stroke="blue" fill-opacity="0"></polyline><!-- 绘制矩形 --><rect x="150" y="150" width="100" height="50" fill="yellow"></rect><!-- 绘制圆形 --><circle cx="170" cy="50" r="50" style="stroke: cyan;fill:none"></circle><!-- 绘制圆形和椭圆 --><ellipse cx="500" cy="200" rx="50" ry="25" style="stroke: gray;fill: black;"></ellipse><!-- 绘制多边形 --><polygon points="600 100,300,400,750 100" stroke="pink" fill-opacity="0.5"></polygon><!-- 绘制任意形状或路径 --><path stroke="orange" fill-opacity="0" d="M 550 100 ,L 570 111,L 600 150,Z"></path></svg>
</body></html>
使用方法
以下标签都要包裹在 <svg> 中使用
<line>
创建一条直线。
<!-- x1 y1 是第一个点坐标x2 y2 是第二个点坐标-->
<line x1="" y1="" x2="" y2=""></line>
<polyline>
创建折线。
<!-- 依次传入点坐标,即可绘制-->
<polyline points="x1 y1x2 y2x3 y3...
"></polyline>
<!-- 你也可以把上面的代码写成: -->
<polyline points="x1 y1, x2 y2, x3 y3"></polyline>
<!-- 或 -->
<polyline points="x1 y1 x2 y2 x3 y3"></polyline>
<rect>
创建矩形。
<!-- x y 左上角点坐标width 宽度height 高度-->
<rect x="" y="" width="" height=""></rect>
<circle>
创建圆。
<!--  cx cy 圆心点坐标r 半径style 样式
-->
<circle cx='70' cy='95' r='50' style='stroke:black; fill:none'></circle>
<ellipse>
创建圆和椭圆。
<!-- cx cy 圆心点坐标rx x轴半径ry y轴半径-->
<ellipse cx="" cy="" rx="" ry="" style="fill:black;"></ellipse>
<polygon>
创建多边形。
<polygon points="x1 y1, x2 y2, x3 y3" />
<path>
通过指定点以及点和点之间的线来创建任意形状。
<!--M 移动到初始位置L 画线Z 将结束和开始点闭合
-->
<path d="M x1 y1L x2 y2L x3 y3L x4 y4L x5 y5L x6 y6L x7 y7Z
"></path>
起始文件
<!DOCTYPE html>
<html lang="en"><head><meta charset="UTF-8"><meta name="viewport" content="width=device-width, initial-scale=1.0"><meta http-equiv="X-UA-Compatible" content="ie=edge"><title>Hand Coded SVG</title><style>html,body {height: 100%;width: 100%;background: #e9e9e9;}body {margin: 0;text-align: center;}.grid {width: 750px;height: 500px;margin: 0 auto;padding-top: 100px;padding-left: 100px;background-image: url('grid.png');position: relative;}.grid::before {content: "";border-left: 1px solid #7c7cea;position: absolute;top: 0;left: 100px;width: 750px;height: 600px;}.grid::after {content: "";border-top: 1px solid #7c7cea;position: absolute;top: 100px;left: 0;width: 850px;height: 500px;}svg {stroke: #000;stroke-width: 5;stroke-linecap: round;stroke-linejoin: round;fill: none;}</style>
</head><body><div class="grid"></div></body></html>
- SVG入门—如何手写SVG(opens new window)
- SVG 入门指南
Echarts
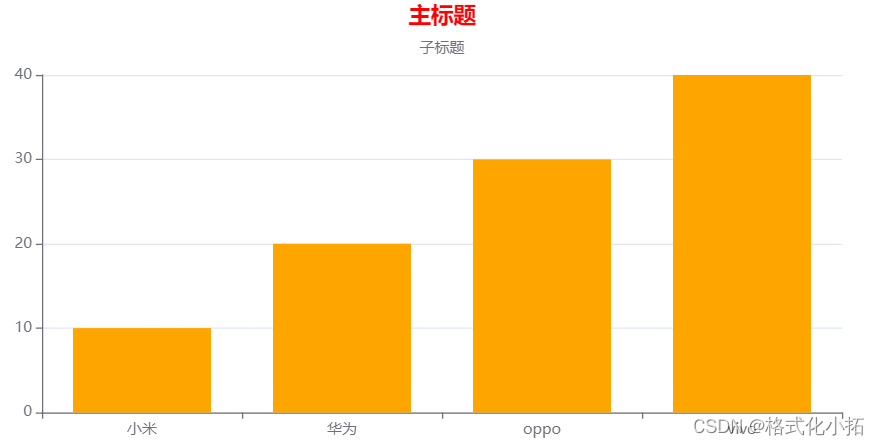
01-基本使用
<!DOCTYPE html>
<html lang="en"><head><meta charset="UTF-8"><meta name="viewport" content="width=device-width, initial-scale=1.0"><title>Document</title><!-- 从bootcdn获取echarts的在线链接 --><script src="https://cdn.bootcdn.net/ajax/libs/echarts/5.4.2/echarts.js"></script><style>* {margin: 0;padding: 0;}.ec {margin: 0 auto;width: 800px;height: 400px;}</style>
</head><body><!-- 图表容器 --><div class="ec"></div><script>// 初始化echarts容器const myEcharts = echarts.init(document.querySelector('.ec'));// 设定配置项、数据const option = {// 图表标题title: {// 主标题text: '主标题',// 主标题颜色textStyle: {color: 'red',},// 主标题位置left: 'center',// 子标题subtext: '子标题',},// x轴配置项xAxis: {// x轴数据data: ['小米', '华为', 'oppo', 'vivo'],},// y轴配置项yAxis: {// 显示y轴的线axisLine: {show: true,},// 显示y轴刻度axisTick: {show: true,}},// 系列设置:图标类型 数据展示series: [{// 图标类型 bar line pietype: 'bar',// 数据data: [10, 20, 30, 40],// 颜色color: 'orange',}]}// 设定配置项myEcharts.setOption(option);</script>
</body></html>
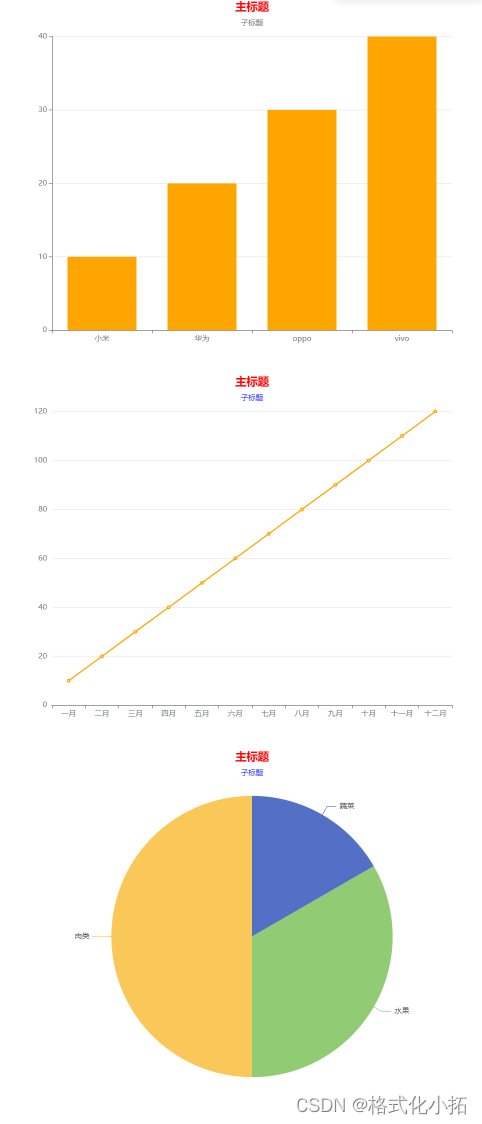
02-多个图表展示
<!DOCTYPE html>
<html lang="en"><head><meta charset="UTF-8"><meta name="viewport" content="width=device-width, initial-scale=1.0"><title>Document</title><!-- 从bootcdn获取echarts的在线链接 --><script src="https://cdn.bootcdn.net/ajax/libs/echarts/5.4.2/echarts.js"></script><style>* {margin: 0;padding: 0;}.ec,.ec2,.ec3 {margin: 0 auto;width: 800px;height: 600px;}</style>
</head><body><!-- 图表容器 --><div class="ec"></div><div class="ec2"></div><div class="ec3"></div><script>// 图表一// 初始化echarts容器const myEcharts = echarts.init(document.querySelector('.ec'));// 设定配置项、数据const option = {// 图表标题title: {// 主标题text: '主标题',// 主标题颜色textStyle: {color: 'red',},// 主标题位置left: 'center',// 子标题subtext: '子标题',},// x轴配置项xAxis: {// x轴数据data: ['小米', '华为', 'oppo', 'vivo'],},// y轴配置项yAxis: {// 显示y轴的线axisLine: {show: true,},// 显示y轴刻度axisTick: {show: true,}},// 系列设置:图标类型 数据展示series: [{// 图标类型 bar line pietype: 'bar',// 数据data: [10, 20, 30, 40],// 颜色color: 'orange',}]}// 设定配置项myEcharts.setOption(option);// 图表二// 初始化echarts容器const myEcharts2 = echarts.init(document.querySelector('.ec2'));// 设定配置项、数据const option2 = {// 图表标题title: {// 主标题text: '主标题',// 主标题颜色textStyle: {color: 'red',},// 主标题位置left: 'center',// 子标题subtext: '子标题',// 子标题颜色subtextStyle: {color: 'blue'}},// x轴配置项xAxis: {// x轴数据data: ['一月', '二月', '三月', '四月', '五月', '六月', '七月', '八月', '九月', '十月', '十一月', '十二月'],},// y轴配置项yAxis: {// // 显示y轴的线// axisLine: {//     show: true,// },// // 显示y轴刻度// axisTick: {//     show: true,// }},// 系列设置:图标类型 数据展示series: [{// 图标类型 bar line pietype: 'line',// 数据data: [10, 20, 30, 40, 50, 60, 70, 80, 90, 100, 110, 120],// 颜色color: 'orange',}]}// 设定配置项myEcharts2.setOption(option2);// 图表三// 初始化echarts容器const myEcharts3 = echarts.init(document.querySelector('.ec3'));// 设定配置项、数据const option3 = {// 图表标题title: {// 主标题text: '主标题',// 主标题颜色textStyle: {color: 'red',},// 主标题位置left: 'center',// 子标题subtext: '子标题',// 子标题颜色subtextStyle: {color: 'blue'}},// // x轴配置项// xAxis: {},// // y轴配置项// yAxis: {},// 系列设置:图标类型 数据展示series: [{// 图标类型 bar line pietype: 'pie',// 数据data: [{name: '蔬菜',value: 10},{name: '水果',value: 20},{name: '肉类',value: 30},],// 饼图 宽高width: 600,height: 600,// 饼图 位置left: 100,// top: 5,// 饼图 半径// radius: 400,}]}// 设定配置项myEcharts3.setOption(option3);</script>
</body></html>
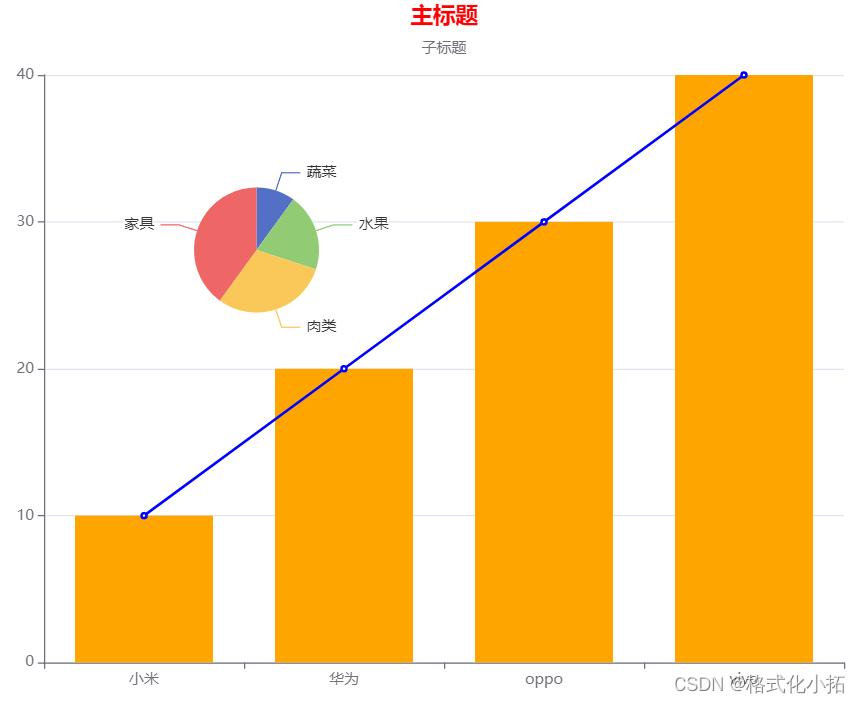
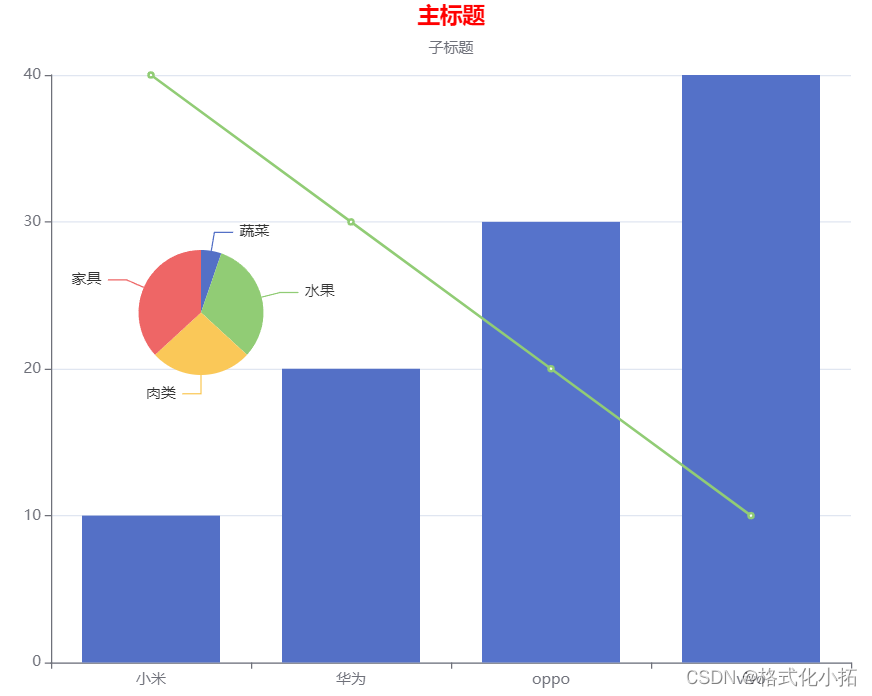
03-一个图标展示多个图标类型
<!DOCTYPE html>
<html lang="en"><head><meta charset="UTF-8"><meta name="viewport" content="width=device-width, initial-scale=1.0"><title>Document</title><!-- 从bootcdn获取echarts的在线链接 --><script src="https://cdn.bootcdn.net/ajax/libs/echarts/5.4.2/echarts.js"></script><style>* {margin: 0;padding: 0;}.ec{margin: 0 auto;width: 800px;height: 600px;}</style>
</head><body><!-- 图表容器 --><div class="ec"></div><script>// 图表一// 初始化echarts容器const myEcharts = echarts.init(document.querySelector('.ec'));// 设定配置项、数据const option = {// 图表标题title: {// 主标题text: '主标题',// 主标题颜色textStyle: {color: 'red',},// 主标题位置left: 'center',// 子标题subtext: '子标题',},// x轴配置项xAxis: {// x轴数据data: ['小米', '华为', 'oppo', 'vivo'],},// y轴配置项yAxis: {// 显示y轴的线axisLine: {show: true,},// 显示y轴刻度axisTick: {show: true,}},// 系列设置:图标类型 数据展示series: [{// 图标类型 bar line pietype: 'bar',// 数据data: [10, 20, 30, 40],// 颜色color: 'orange',},{// 图标类型 bar line pietype: 'line',// 数据data: [10, 20, 30, 40],// 颜色color: 'blue',},{// 图标类型 bar line pietype: 'pie',// 数据data: [{name: '蔬菜',value: 10},{name: '水果',value: 20},{name: '肉类',value: 30},{name: '家具',value: 40},],// 饼图 宽高width: 300,height: 300,// 饼图 位置left: 100,top: 50,// 饼图 半径radius: 50,}]}// 设定配置项myEcharts.setOption(option);</script>
</body></html>
04-dataset数据集使用
<!DOCTYPE html>
<html lang="en"><head><meta charset="UTF-8"><meta name="viewport" content="width=device-width, initial-scale=1.0"><title>Document</title><!-- 从bootcdn获取echarts的在线链接 --><script src="https://cdn.bootcdn.net/ajax/libs/echarts/5.4.2/echarts.js"></script><style>* {margin: 0;padding: 0;}.ec {margin: 0 auto;width: 800px;height: 600px;}</style>
</head><body><!-- 图表容器 --><div class="ec"></div><script>// 图表一// 初始化echarts容器const myEcharts = echarts.init(document.querySelector('.ec'));// 设定配置项、数据const option = {// 设置数据集dataset: {// 数据源source: [["小米", 10, 40, '蔬菜', 10],["华为", 20, 30, '水果', 60],["oppo", 30, 20, '肉类', 50],["vivo", 40, 10, '家具', 70],]},// 图表标题title: {// 主标题text: '主标题',// 主标题颜色textStyle: {color: 'red',},// 主标题位置left: 'center',// 子标题subtext: '子标题',},// x轴配置项// 声明一个 X 轴,类目轴(category)。默认情况下,类目轴对应到 dataset 第一列。xAxis: { type: 'category' },// y轴配置项yAxis: {// 显示y轴的线axisLine: {show: true,},// 显示y轴刻度axisTick: {show: true,}},// 系列设置:图标类型 数据展示series: [{// 图标类型 bar line pietype: 'bar',encode: {y: 1}},{// 图标类型 bar line pietype: 'line',encode: {y: 2}},{// 图标类型 bar line pietype: 'pie',// 数据encode: {//饼图旁边的文字itemName: 3,value: 4},// 饼图 宽高width: 300,height: 300,// 饼图 位置left: 50,top: 100,// 饼图 半径radius: 50,}]}// 设定配置项myEcharts.setOption(option);</script>
</body></html>
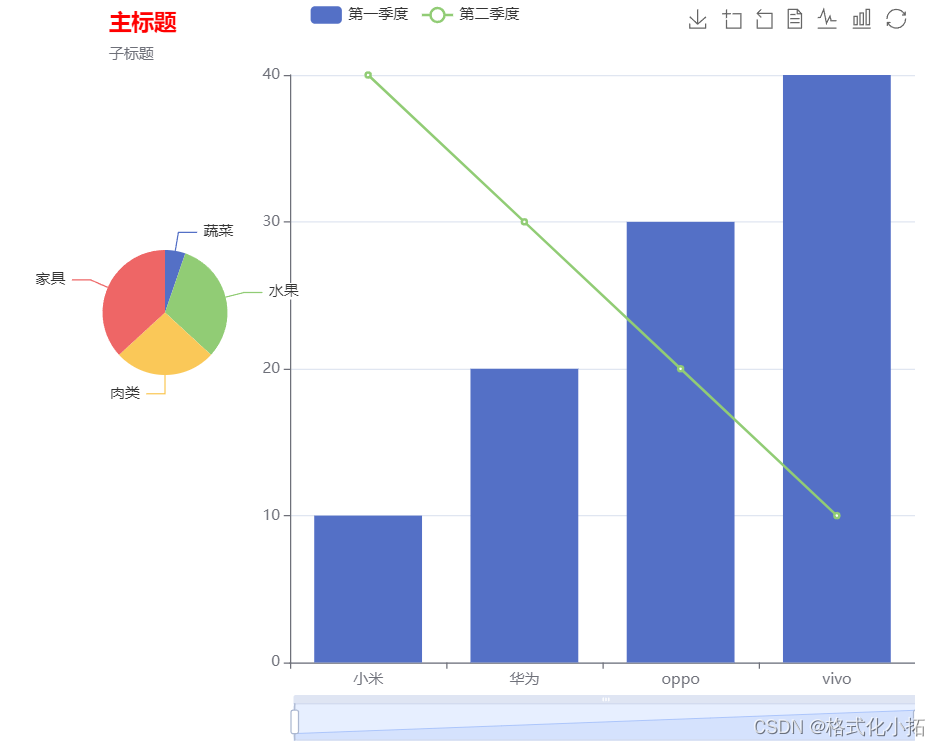
05-echarts组件
<!DOCTYPE html>
<html lang="en"><head><meta charset="UTF-8"><meta name="viewport" content="width=device-width, initial-scale=1.0"><title>Document</title><!-- 从bootcdn获取echarts的在线链接 --><script src="https://cdn.bootcdn.net/ajax/libs/echarts/5.4.2/echarts.js"></script><style>* {margin: 0;padding: 0;}.ec {margin: 0 auto;width: 800px;height: 600px;}</style>
</head><body><!-- 图表容器 --><div class="ec"></div><script>// 图表一// 初始化echarts容器const myEcharts = echarts.init(document.querySelector('.ec'));// 设定配置项、数据const option = {// 设置数据集dataset: {// 数据源source: [["小米", 10, 40, '蔬菜', 10],["华为", 20, 30, '水果', 60],["oppo", 30, 20, '肉类', 50],["vivo", 40, 10, '家具', 70],]},// 图表标题title: {// 主标题text: '主标题',// 主标题颜色textStyle: {color: 'red',},// 主标题位置left: 150,top: 5,// 子标题subtext: '子标题',},// x轴配置项// 声明一个 X 轴,类目轴(category)。默认情况下,类目轴对应到 dataset 第一列。xAxis: { type: 'category' },// y轴配置项yAxis: {// 显示y轴的线axisLine: {show: true,},// 显示y轴刻度axisTick: {show: true,}},// 系列设置:图标类型 数据展示series: [{// 图标类型 bar line pietype: 'bar',encode: {y: 1},name: '第一季度'},{// 图标类型 bar line pietype: 'line',encode: {y: 2},name: '第二季度'},{// 图标类型 bar line pietype: 'pie',// 数据encode: {//饼图旁边的文字itemName: 3,value: 4},// 饼图 宽高width: 300,height: 300,// 饼图 位置left: 50,top: 100,// 饼图 半径radius: 50,}],//提示组件tooltip: {//提示框文字的颜色textStyle: {color: 'orange'}},// x轴下的范围选择拖动框dataZoom: {},//系列切换组件legend: {data: ['第一季度', '第二季度']},//工具栏组件toolbox: {show: true,feature: {saveAsImage: {},dataZoom: {yAxisIndex: "none"},dataView: {readOnly: false},magicType: {type: ["line", "bar"]},restore: {},}},//调整图表布局grid: {left: 300,right: 0,}}// 设定配置项myEcharts.setOption(option);</script>
</body></html>
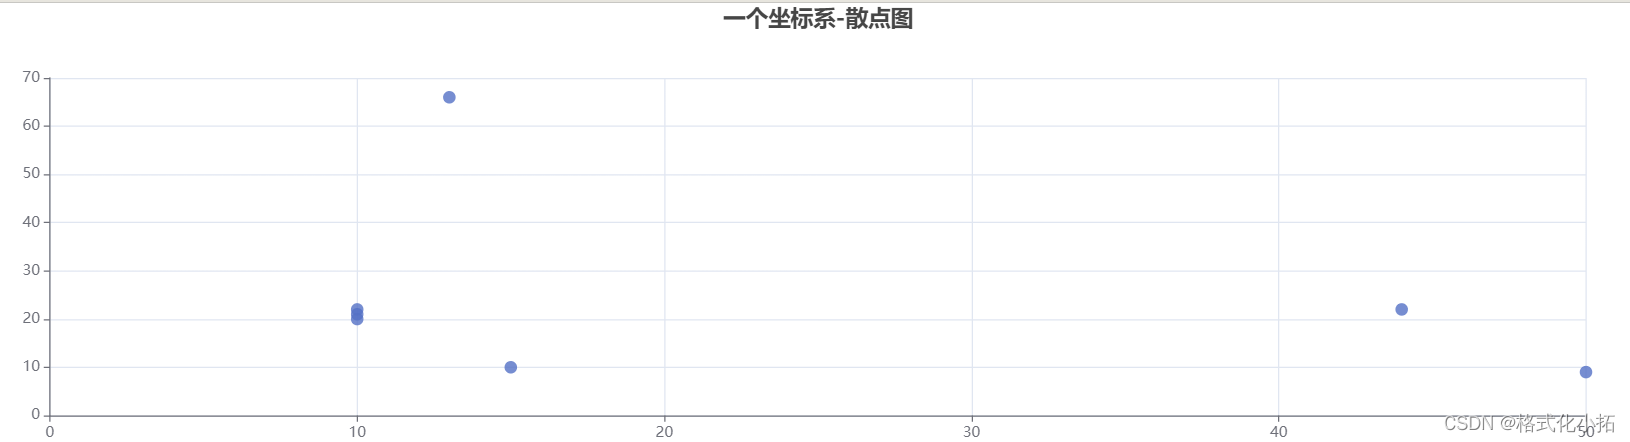
06-一个坐标系
<!DOCTYPE html>
<html lang="en"><head><meta charset="UTF-8"><meta http-equiv="X-UA-Compatible" content="IE=edge"><meta name="viewport" content="width=device-width, initial-scale=1.0"><title>Document</title><!-- 从bootcdn获取echarts的在线链接 --><script src="https://cdn.bootcdn.net/ajax/libs/echarts/5.4.2/echarts.js"></script><style>* {margin: 0;padding: 0;}div {width: 100%;height: 400px;}</style>
</head><body><div></div>
</body></html>
<script>let dom = document.querySelector('div');let mycharts = echarts.init(dom);//一个坐标系:散点图mycharts.setOption({//标题title: {text: "一个坐标系-散点图",left: 'center'},//x轴xAxis: {// type: 'category'},yAxis: {},//散点图series: [{type: "scatter",//散点图的数据data: [[10, 20],[10, 22],[10, 21],[13, 66],[50, 9],[44, 22],[15, 10]]}],});
</script>
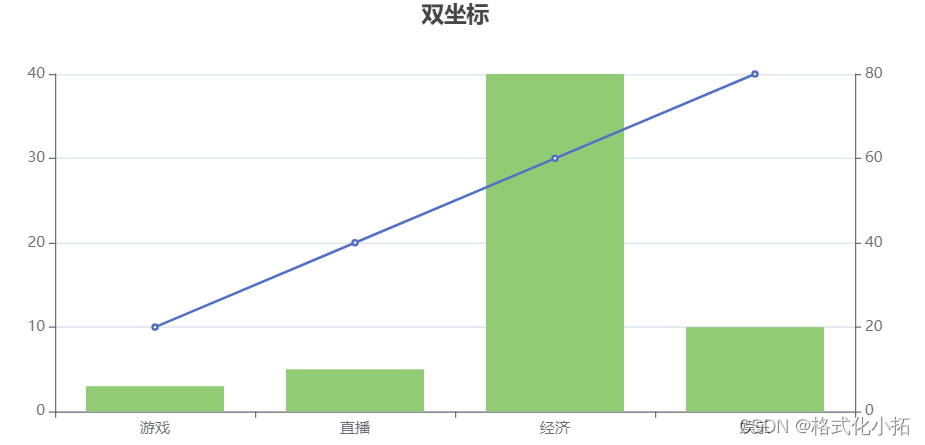
07-多个坐标轴
<!DOCTYPE html>
<html lang="en"><head><meta charset="UTF-8"><meta http-equiv="X-UA-Compatible" content="IE=edge"><meta name="viewport" content="width=device-width, initial-scale=1.0"><title>Document</title><!-- 引入echarts依赖包 --><script src="https://cdn.bootcdn.net/ajax/libs/echarts/5.1.2/echarts.js"></script><style>* {margin: 0;padding: 0;}div {width: 800px;height: 400px;}</style>
</head><body><!-- 准备一个容器:容器就是显示图标区域 --><div></div>
</body></html>
<script>//基于准备好的DOM初始化echarts实例let dom = document.querySelector('div');//创建echarts实例let mycharts = echarts.init(dom);//双做标题mycharts.setOption({title: {text: "双坐标",left: 'center',},xAxis: {data: ['游戏', '直播', '经济', '娱乐']},yAxis: [{  //显示Y轴的线axisLine: {show: true},//显示Y轴刻度axisTick: {show: true}},{//显示Y轴的线axisLine: {show: true},//显示Y轴刻度axisTick: {show: true}}],series: [{type: 'line',data: [10, 20, 30, 40],//用的是索引值为0的y轴yAxisIndex: 0},{type: 'bar',data: [6, 10, 80, 20],//用的是索引值为1的y轴yAxisIndex: 1}]})
</script>
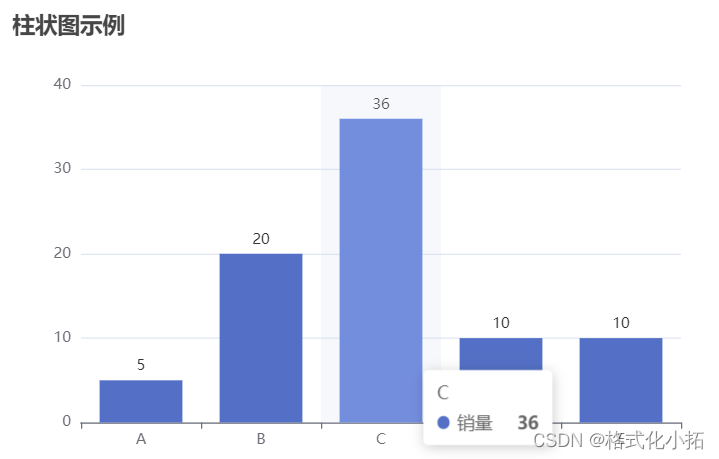
08-柱状图标签
<!DOCTYPE html>
<html><head><meta charset="utf-8"><title>ECharts Example</title><!-- 引入 ECharts 库 --><script src="https://cdn.jsdelivr.net/npm/echarts@5.1.2/dist/echarts.min.js"></script>
</head><body><!-- 创建一个用于放置图表的容器 --><div id="myChart" style="width: 600px; height: 400px;"></div><script>// 在 JavaScript 中配置和绘制图表// 创建 ECharts 实例,并将图表容器传递给它var myChart = echarts.init(document.getElementById('myChart'));// 定义图表的配置项和数据var option = {title: {text: '柱状图示例'},xAxis: {data: ['A', 'B', 'C', 'D', 'E']},yAxis: {},series: [{name: '销量',type: 'bar',data: [5, 20, 36, 10, 10],label: {  // 添加 label 配置show: true,  // 显示标签position: 'top'  // 标签位置}}],tooltip: {  // 配置悬浮提示框trigger: 'axis',  // 触发方式为坐标轴axisPointer: {  // 坐标轴指示器配置type: 'shadow'  // 显示阴影}}};// 使用配置项绘制图表myChart.setOption(option);</script>
</body></html>
关于更多,请去官网查看链接: echarts官网
相关文章:
数据可视化-canvas-svg-Echarts
数据可视化 技术栈 canvas <canvas width"300" height"300"></canvas>当没有设置宽度和高度的时候,canvas 会初始化宽度为 300 像素和高度为 150 像素。切记不能通过样式去设置画布的宽度与高度宽高必须通过属性设置,…...
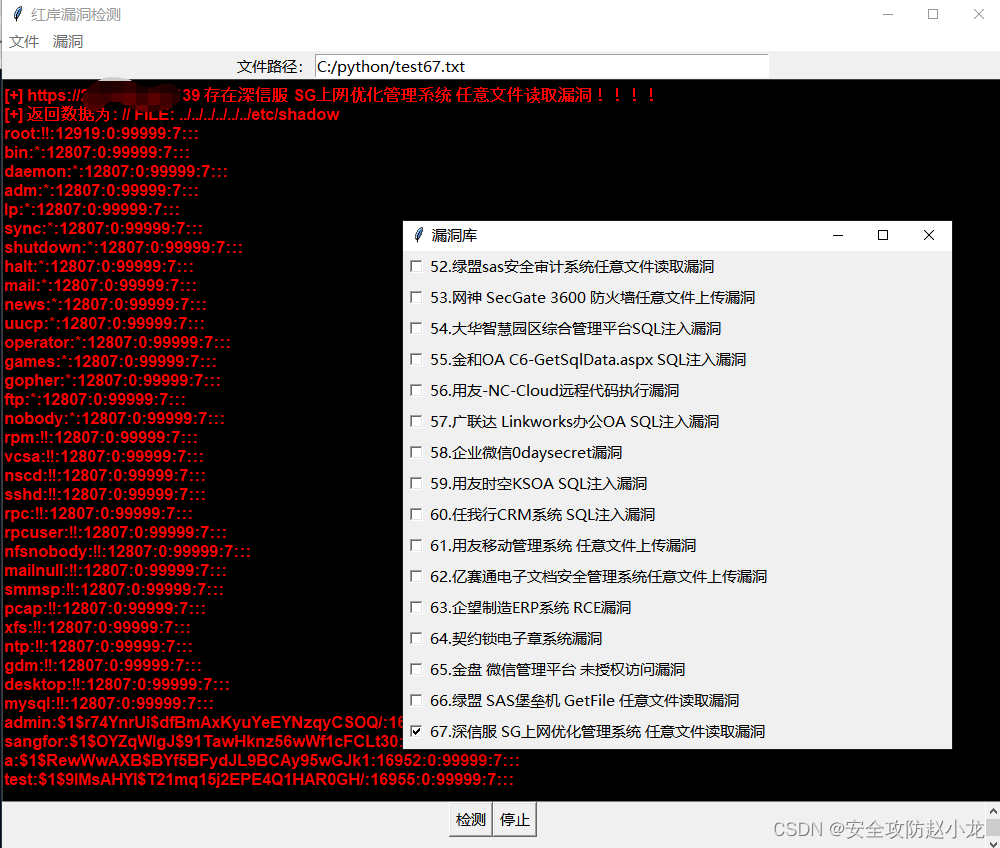
深信服 SG上网优化管理系统 catjs.php 任意文件读取漏洞[2023-HW]
深信服 SG上网优化管理系统 catjs.php 任意文件读取漏洞 一、漏洞描述二、漏洞影响三、网络测绘四、漏洞复现小龙POC检测: 五、 修复建议 免责声明:请勿利用文章内的相关技术从事非法测试,由于传播、利用此文所提供的信息或者工具而造成的任何直接或者间…...

java反序列化泛型中json对象
使用 jackson的objectMapper 来实现 import com.fasterxml.jackson.core.JsonProcessingException; import com.fasterxml.jackson.core.type.TypeReference; import com.fasterxml.jackson.databind.DeserializationFeature; import com.fasterxml.jackson.databind.ObjectMa…...

Docker Compose一键管理容器
可以一键批量管理docker的容器。将所有需要创建的容器定义在compose配置文件中,通过一个命令一键可以创建并运行这些容器,而不需要一个一个启动。可以批量启动停止服务。 安装 #安装Docker-Compose并安装到/usr/local/bin/docker-compose curl -L &quo…...
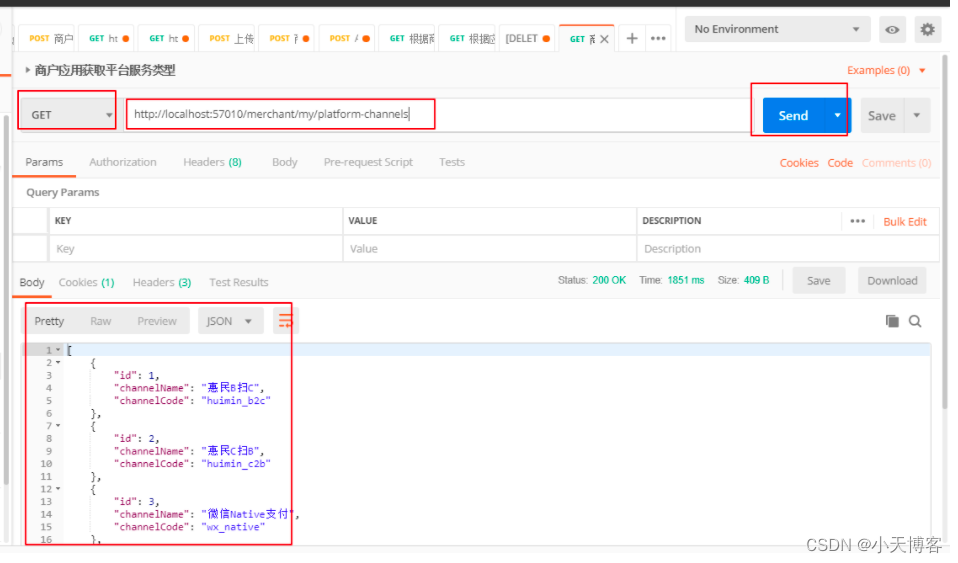
API接口文档利器:Swagger 和 接口调试利器:Postman
2.接口相关工具 2.1API接口文档利器:Swagger 2.1.1Swagger介绍 Swagger 是一个规范和完整的框架,用于生成、描述、调用和可视化 RESTful 风格的 Web 服务 (https://swagger.io/)。 它的主要作用是: 使得前后端分离开发更加方便࿰…...

Redis手动实现分布式锁-Demo
1、pom文件依赖 <!--引入Redis操作依赖--> <dependency><groupId>org.springframework.boot</groupId><artifactId>spring-boot-starter-data-redis</artifactId> </dependency> 2、具体实现 package com.xch;import org.spring…...
、评论分页之刷新评论页面)
BBS项目day04 文章详情页、点赞点菜、评论功能(根评论和子评论)、评论分页之刷新评论页面
一、路由 from django.contrib import admin from django.urls import path, re_path from app01 import views from django.views.static import serve from django.conf import settingsurlpatterns [path(admin/, admin.site.urls),# 注册path(register/, views.register)…...

【带着学Pytorch】1、pytorch的安装与入门
一、介绍与安装 1.1. pytorch优点: 上手简单:掌握语法和深度学习的概念,尤其是Numpy的使用与python的list切片有共同性。代码灵活:基本调用封装好的模块,动态图使编写更加灵活资源多: 硬件,软件,文档资料都很多。容易调试:动态运行在调试中可以观察数据的变化是否符…...
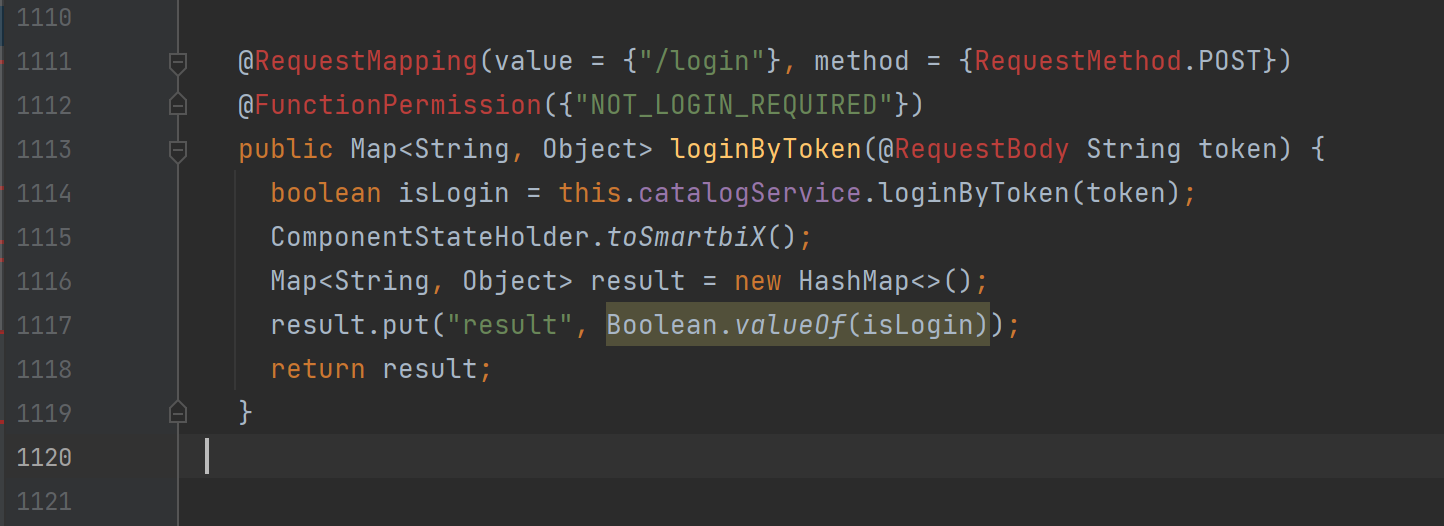
smartbi token回调获取登录凭证漏洞
2023年7月28日Smartbi官方修复了一处权限绕过漏洞。未经授权的攻击者可利用该漏洞,获取管理员token,完全接管管理员权限。 于是研究了下相关补丁并进行分析。 0x01分析结果 依据补丁分析,得到如下漏洞复现步骤 第一步,设置Engi…...

SQL注入之堆叠查询
文章目录 堆叠查询是什么?堆叠查询修改所有用户密码堆叠查询删除数据库恢复数据库 堆叠查询是什么? 在SQL中,分号;是用来表示一条sql语句的结束。试想一下我们在; 结束一个sql语句后继续构造下一条语句,会不会一起执行?…...
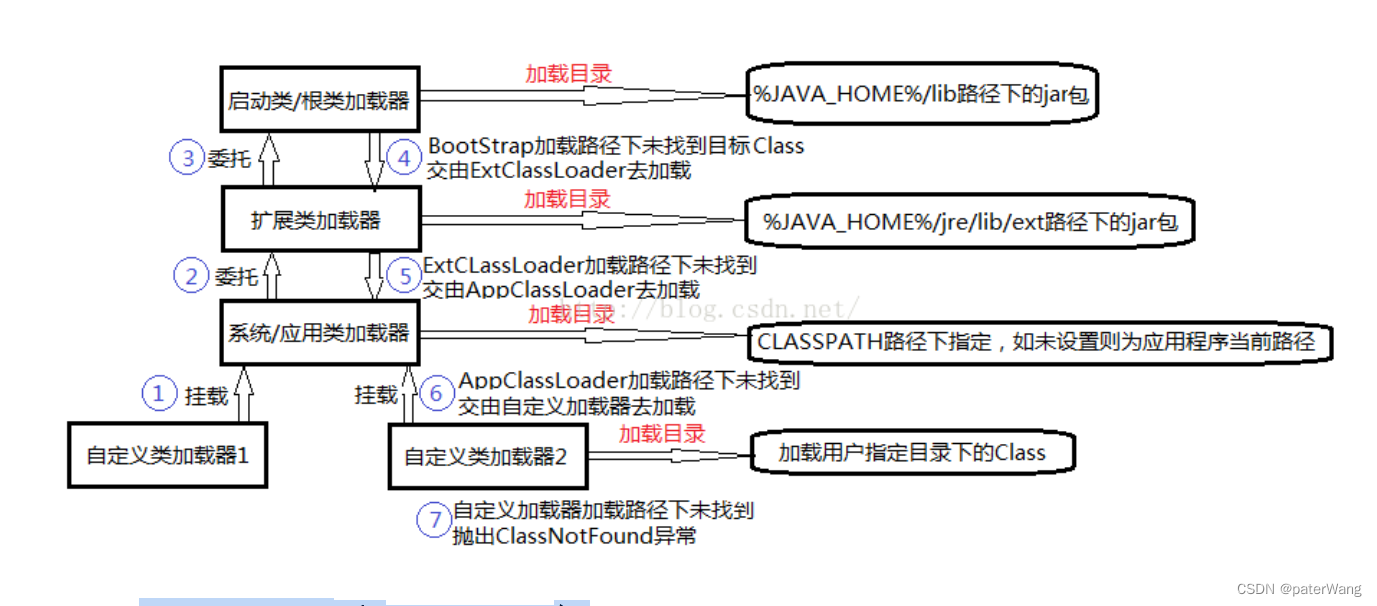
java-JVM 类加载机制
JVM 类加载机制 JVM 类加载机制分为五个部分:加载,验证,准备,解析,初始化,下面我们就分别来看一下这五个过程。 1.1. 加载 加载是类加载过程中的一个阶段,这个阶段会在内存中生成一个代表这…...

前端面试:【网络协议与性能优化】提升Web应用性能的策略
嗨,亲爱的Web开发者!构建高性能的Web应用是每个开发者的梦想。本文将介绍一些性能优化策略,包括资源加载、懒加载和CDN等,以帮助你提升Web应用的性能。 1. 性能优化策略: 压缩资源: 使用Gzip或Brotli等压缩…...

前端面试:【React】构建现代Web的利器
嘿,亲爱的React探险家!在前端开发的旅程中,有一个神奇的库,那就是React。React是一个用于构建现代Web应用的强大工具,它提供了组件化开发、状态管理、生命周期管理和虚拟DOM等特性,让你的应用开发变得更加高…...
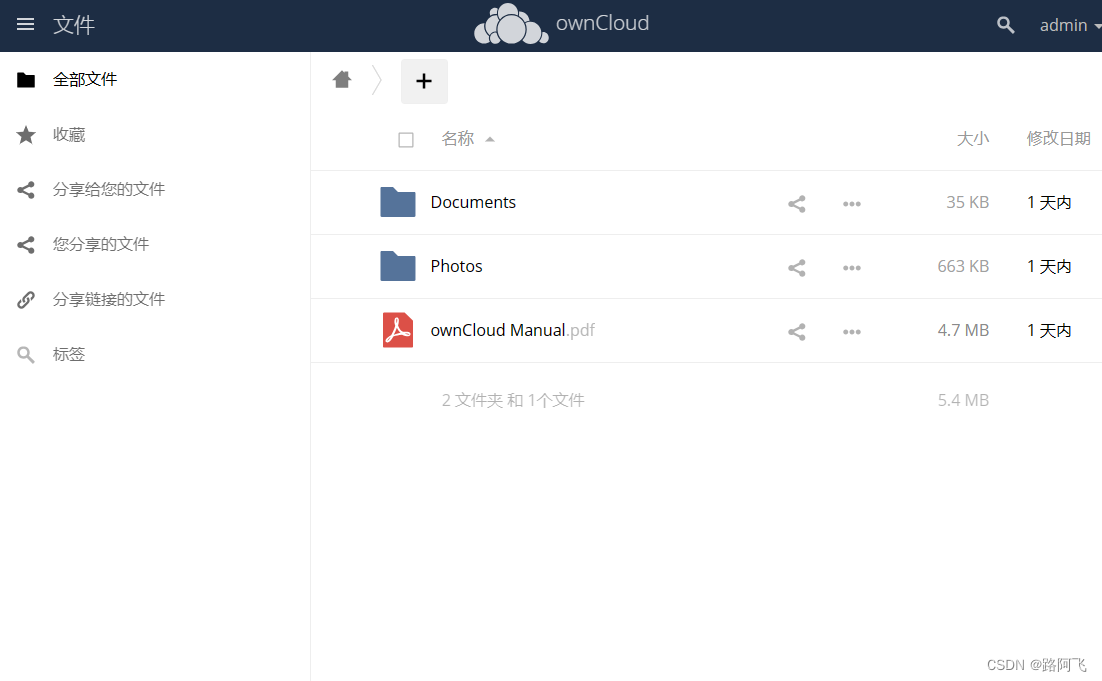
使用mysql:5.6和 owncloud 镜像,构建一个个人网盘。
1、使用mysql:5.6和 owncloud 镜像,构建一个个人网盘。 拉取mysql:5.6和owncloud的镜像和生成实例 [rootlocalhost ~]# docker pull mysql:5.6 [rootlocalhost ~]# docker pull ownclound [rootlocalhost ~]# docker run -d --name mydb1 --env MYSQL_ROOT_PASSWO…...

k8s发布应用
前言 首先以SpringBoot应用为例介绍一下k8s的发布步骤。 1.从代码仓库下载代码,比如GitLab; 2.接着是进行打包,比如使用Maven; 3.编写Dockerfile文件,把步骤2产生的包制作成镜像; 4.上传步骤3的镜像到…...
)
微信小程序教学系列(4)
微信小程序教学系列 第四章:小程序优化与调试 1. 性能优化技巧 在开发微信小程序时,我们可以采取一些性能优化技巧,以提升小程序的性能表现和用户体验。以下是一些常用的性能优化技巧: 减少网络请求:尽量合并网络请…...
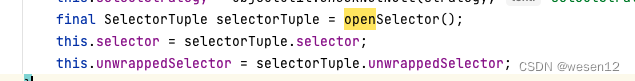
Netty核心源码解析(三)--NioEventLoop
NioEventLoop介绍 NioEventLoop继承SingleThreadEventLoop,核心是一个单例线程池,可以理解为单线程,这也是Netty解决线程并发问题的最根本思路--同一个channel连接上的IO事件只由一个线程来处理,NioEventLoop中的单例线程池轮询事件队列,有新的IO事件或者用户提交的task时便执…...

Vue2学习笔记のVue核心
目录 Vue核心初识VueVue模板语法数据绑定el与data的两种写法MVVM模型数据代理Object.defineProperty方法何为数据代理Vue中的数据代理 事件处理事件的基本使用事件修饰符键盘事件 计算属性姓名案例_插值语法实现姓名案例_methods实现姓名案例_计算属性实现姓名案例_计算属性简写…...
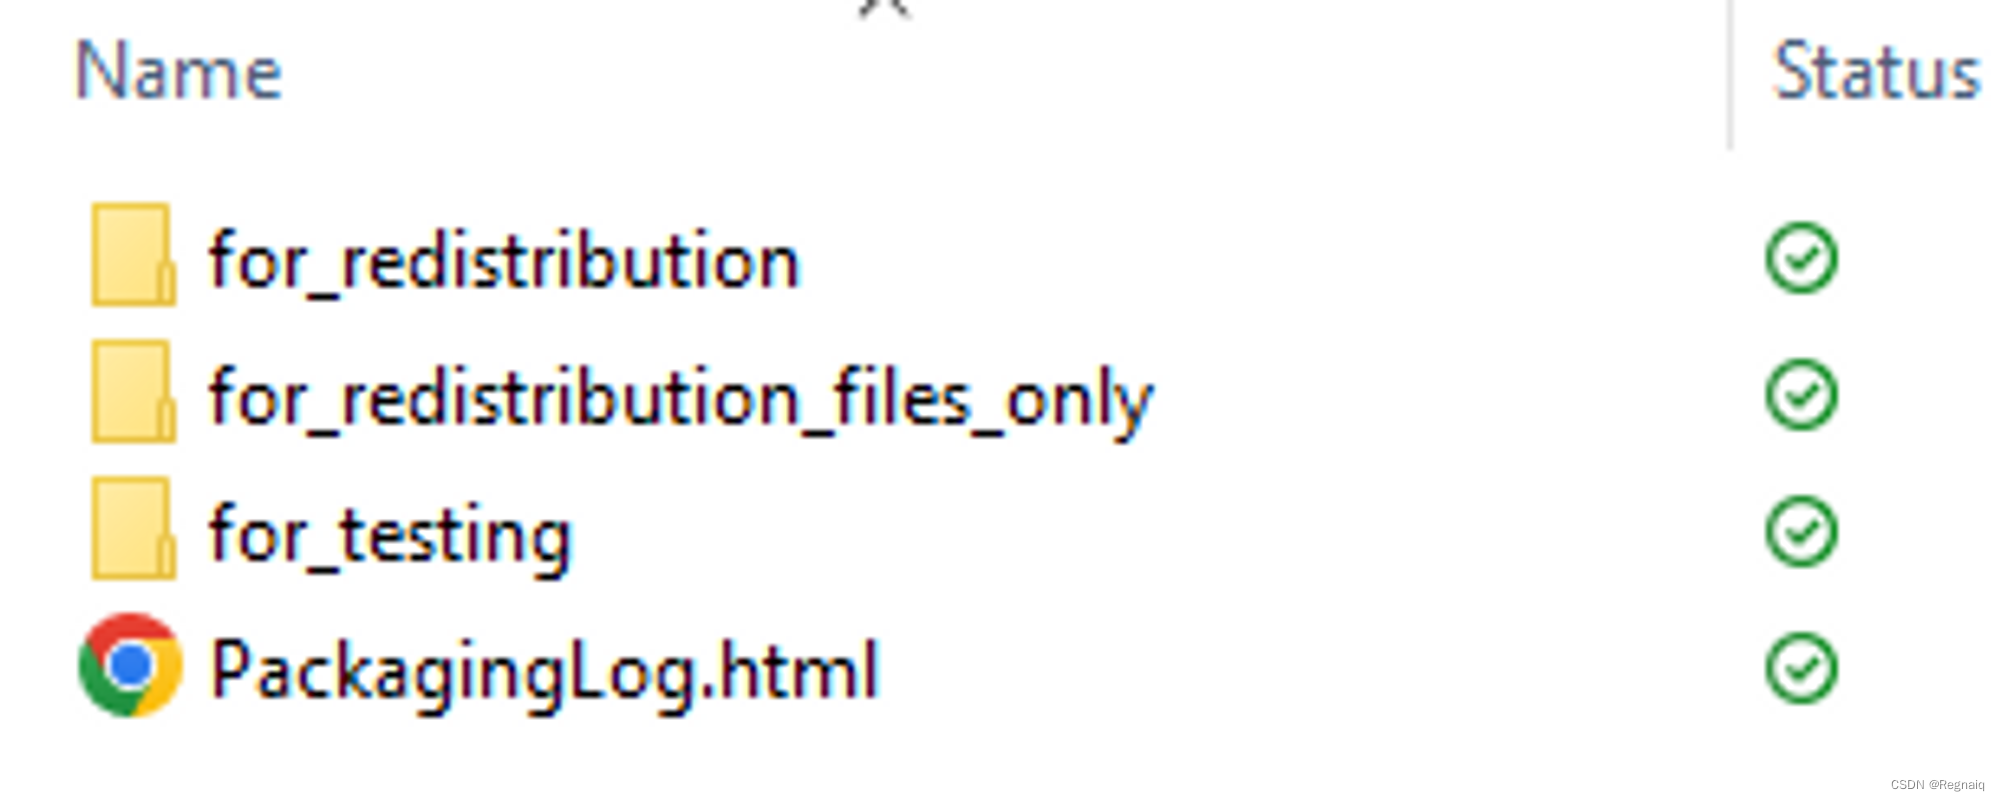
把matlab的m文件打包成单独的可执行文件
安装Matlab Compiler Adds-on在app里找到Application Compiler 选择要打包的文件matlab单独的运行程序的话需要把依赖的库做成runtime. 这里有两个选项. 上面那个是需要对方在联网的情况下安装, 安装包较小.下面那个是直接把runtime打包成安装程序, 大概由你的程序依赖的库的多…...
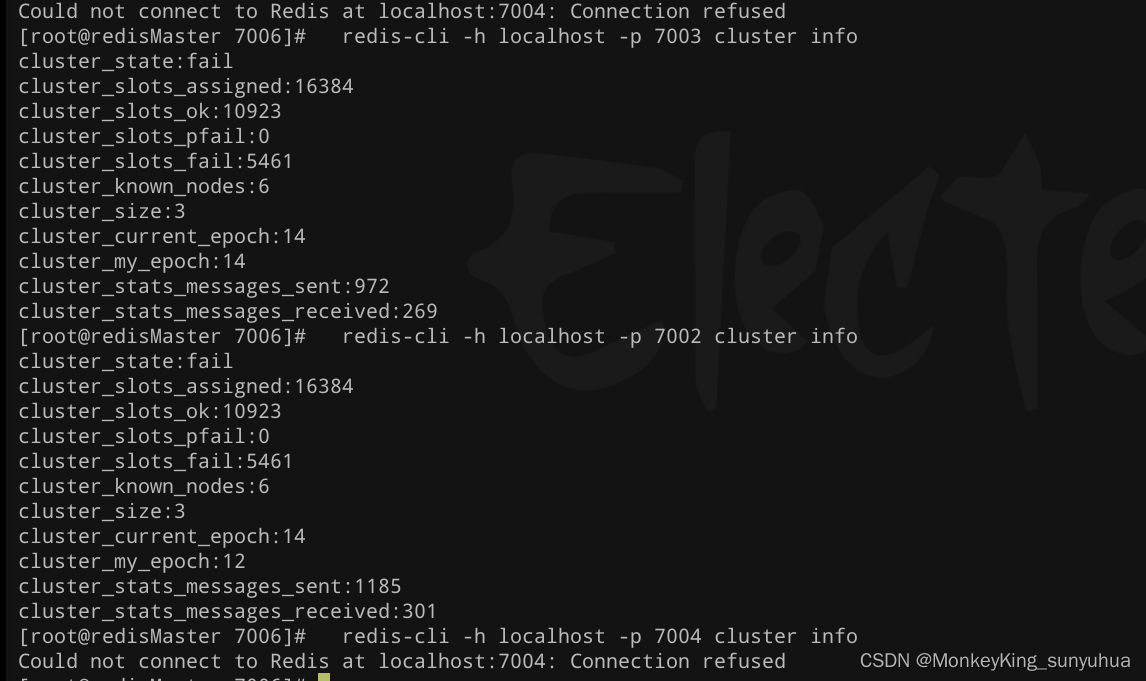
redis 6个节点(3主3从),始终一个节点不能启动
redis节点,始终有一个节点不能启动起来 1.修改了配置文件 protected-mode no,重启 修改了配置文件 protected-mode no,重启redis问题依然存在 2、查看/var/log/message的redis日志 Aug 21 07:40:33 redisMaster kernel: Out of memory: K…...

mRNA疫苗序列生物信息学分析:从密码子优化到免疫原性预测
1. 项目概述:解码两大mRNA疫苗的“核心蓝图”作为一名在生物信息学和基因组学领域摸爬滚打了十多年的“老码农”,我见过太多令人兴奋的数据集,但当我第一次在GitHub上看到这个名为“Assemblies-of-putative-SARS-CoV2-spike-encoding-mRNA-se…...

手把手教你用三菱FX3U PLC的RS指令和RS2指令与电脑串口调试助手‘对话’
三菱FX3U PLC串口通信实战:从零搭建RS485数据收发系统 第一次接触工业控制系统的串口通信时,我被那些密密麻麻的接线和晦涩的协议参数弄得晕头转向。直到在自动化生产线上亲眼看到PLC通过两根电线与十几台设备稳定通信,才意识到串口技术的精妙…...

Free-NTFS-for-Mac深度剖析:打破macOS与Windows文件系统壁垒的完整解决方案
Free-NTFS-for-Mac深度剖析:打破macOS与Windows文件系统壁垒的完整解决方案 【免费下载链接】Free-NTFS-for-Mac Nigate: An open-source NTFS utility for Mac. It supports all Mac models (Intel and Apple Silicon), providing full read-write access, mountin…...

Wand-Enhancer:免费解锁WeMod专业版功能的终极本地增强工具
Wand-Enhancer:免费解锁WeMod专业版功能的终极本地增强工具 【免费下载链接】Wand-Enhancer Advanced UX and interoperability extension for Wand (WeMod) app 项目地址: https://gitcode.com/gh_mirrors/we/Wand-Enhancer 还在为WeMod专业版的高昂订阅费用…...

CircuitPython Web Workflow实战:无线开发Yoto Mini与I2C硬件验证
1. 项目概述与核心价值如果你玩过像树莓派Pico或者ESP32这类微控制器,肯定对“插拔-编程-调试”这个循环不陌生。每次改几行代码,就得拔下USB线,重新上电,然后盯着串口监视器看输出。这个过程在项目初期调试硬件时,尤其…...

基于CircuitPython与MagTag的电子墨水屏俳句显示器项目实践
1. 项目概述与核心价值如果你对嵌入式开发感兴趣,但又觉得传统的C/C开发环境配置繁琐、学习曲线陡峭,那么CircuitPython绝对是一个值得尝试的入口。它本质上是一个运行在微控制器上的Python 3解释器,由Adafruit主导开发,目标就是让…...

长期使用后回顾,Taotoken账单明细对项目财务核算的实际帮助
🚀 告别海外账号与网络限制!稳定直连全球优质大模型,限时半价接入中。 👉 点击领取海量免费额度 长期使用后回顾,Taotoken账单明细对项目财务核算的实际帮助 对于一个持续数月、深度依赖大模型能力的项目组而言&#…...

3步轻松彻底卸载Microsoft Edge:专业级EdgeRemover工具使用指南
3步轻松彻底卸载Microsoft Edge:专业级EdgeRemover工具使用指南 【免费下载链接】EdgeRemover A PowerShell script that correctly uninstalls or reinstalls Microsoft Edge on Windows 10 & 11. 项目地址: https://gitcode.com/gh_mirrors/ed/EdgeRemover …...

【百度AI】从API调用到场景落地:车牌识别技术全解析
1. 车牌识别技术入门指南 第一次接触车牌识别技术时,我也被各种专业术语搞得一头雾水。简单来说,车牌识别就像给电脑装了一双"火眼金睛",让它能自动从照片或视频中找出车牌并读出上面的文字。这项技术现在已经深入到我们生活的方方…...

避坑指南:QGraphicsView自适应缩放时,为什么你的Item总对不齐或留白?
避坑指南:QGraphicsView自适应缩放时Item对齐与留白问题深度解析 在Qt图形界面开发中,QGraphicsView框架因其强大的2D显示能力被广泛应用。但当开发者尝试实现视图内容的自适应缩放时,经常会遇到一个令人头疼的问题——调用fitInView后&#…...