车道线分割检测
利用opencv,使用边缘检测、全局变化梯度阈值过滤、算子角度过滤、HLS阈值过滤的方法进行车道线分割检测,综合多种阈值过滤进行检测提高检测精度。
1.利用cv2.Sobel()计算图像梯度(边缘检测)
import cv2
import numpy as np
import matplotlib.pyplot as plt
import ossrc = np.float32([[200, 720], [1100, 720], [595, 450], [685, 450]]) #src 输入图像
dst = np.float32([[300, 720], [980, 720], [300, 0], [980, 0]]) #dst 输出图像
m_inv = cv2.getPerspectiveTransform(dst, src)
m = cv2.getPerspectiveTransform(src, dst)# 利用cv2.Sobel()计算图像梯度(边缘检测)
def abs_sobel_threshold(img, orient='x', thresh_min=40, thresh_max=255):###利用X,y方向上sobel,二值化图像######gray = cv2.cvtColor(img, cv2.COLOR_RGB2GRAY)if orient == 'x':abs_sobel = np.absolute(cv2.Sobel(gray, cv2.CV_64F, 1, 0))if orient == 'y':########参考求x方向的sobel算子,计算y方向上sobel算子####################填空1 (1行代码)########################abs_sobel = np.absolute(cv2.Sobel(gray, cv2.CV_64F, 0, 1))#############填空1 (1行代码)########################scaled_sobel = np.uint8(255 * abs_sobel / np.max(abs_sobel))binary_output = np.zeros_like(scaled_sobel)#############二值图像,大于最小阈值并且小于最大阈值的区间置为255, 其余为0,可通过修改最大最小值查看差异####################填空2(1行代码)########################binary_output[(scaled_sobel >= thresh_min) & (scaled_sobel <= thresh_max)] = 255#############填空2 (1行代码)########################return binary_output
使用检测纵向边缘(x方向的梯度)
path = r"d:\Users\WYN\Desktop\temp\week1HomeWork\testImage"
path_list = os.listdir(path)
plt.figure(figsize=(16, 9))
for i in range(len(path_list)):path_now = "\\".join([str(path), str(path_list[i])])img = cv2.imread(path_now)img = cv2.cvtColor(img, cv2.COLOR_BGR2RGB)plt.subplot(2, 3, i + 1)plt.imshow(abs_sobel_threshold(img, orient='x', thresh_min=40, thresh_max=255))plt.xticks([])plt.yticks([])plt.subplots_adjust(wspace=0, hspace=0)
plt.show()
使用检测纵向边缘(y方向的梯度)
# 检测纵向边缘(y方向的梯度)
plt.figure(figsize=(16, 9))
for i in range(len(path_list)):path_now = "\\".join([str(path), str(path_list[i])])img = cv2.imread(path_now)img = cv2.cvtColor(img, cv2.COLOR_BGR2RGB)plt.subplot(2, 3, i + 1)plt.imshow(abs_sobel_threshold(img, orient='y', thresh_min=40, thresh_max=255))plt.xticks([])plt.yticks([])plt.subplots_adjust(wspace=0, hspace=0)
plt.show()
2.使用全局的变化梯度来进行阈值过滤
def mag_threshold(img, sobel_kernel=3, mag_threshold=(50, 255)):gray = cv2.cvtColor(img, cv2.COLOR_RGB2GRAY)sobelx = cv2.Sobel(gray, cv2.CV_64F, 1, 0, ksize=sobel_kernel)sobely = cv2.Sobel(gray, cv2.CV_64F, 0, 1, ksize=sobel_kernel)########根据x方向的sobel算子和y方向上sobel算子,计算梯度,公式为sqrt(x^2 + y ^2)####################填空3 (1行代码)########################gradmag = np.sqrt(sobelx ** 2 + sobely ** 2)#############填空3 (1行代码)########################scale_factor = np.max(gradmag) / 255gradmag = (gradmag / scale_factor).astype(np.uint8)binary_out = np.zeros_like(gradmag)########转换为二值图,最大最小值可调,kernel_size也可以调整看看差异####################填空4 (1行代码)########################binary_out[(gradmag >= mag_threshold[0]) & (gradmag <= mag_threshold[1])] = 255#############填空4 (1行代码)########################return binary_out
通过全局阈值过滤来检测车道线
path = r"d:\Users\WYN\Desktop\temp\week1HomeWork\testImage"
path_list = os.listdir(path)
plt.figure(figsize=(16, 9))
plt.figure(1)
for i in range(len(path_list)):path_now = "\\".join([str(path), str(path_list[i])])img = cv2.imread(path_now)img = cv2.cvtColor(img, cv2.COLOR_BGR2RGB)plt.subplot(2, 3, i + 1)plt.imshow(mag_threshold(img, sobel_kernel=3, mag_threshold=(50, 255)))plt.xticks([])plt.yticks([])plt.subplots_adjust(wspace=0, hspace=0)
plt.show()
3.通过算子角度来进行阈值过滤
def dir_threshold(img, sobel_kernel=5, thresh=(0.7, 1.3)):gray = cv2.cvtColor(img, cv2.COLOR_RGB2GRAY)sobelx = cv2.Sobel(gray, cv2.CV_64F, 1, 0, ksize=sobel_kernel)sobely = cv2.Sobel(gray, cv2.CV_64F, 0, 1, ksize=sobel_kernel)########根据x方向的sobel算子和y方向上sobel算子,计算角度,公式为arctan(y/x),将倾斜角度过大的过滤掉####################填空5 (1行代码)########################absgraddir = np.arctan(sobely / sobelx)#############填空5 (1行代码)########################binary_output = np.zeros_like(absgraddir)########转换为二值图,最大最小值可调,kernel_size也可以调整看看差异####################填空6 (1行代码)########################binary_output[((absgraddir >= thresh[0]) & (absgraddir <= thresh[1]))] = 255#############填空6 (1行代码)########################return binary_output
通过全局阈值过滤来检测车道线
path = r"d:\Users\WYN\Desktop\temp\week1HomeWork\testImage"
path_list = os.listdir(path)
plt.figure(figsize=(16, 9))
plt.figure(1)
for i in range(len(path_list)):path_now = "\\".join([str(path), str(path_list[i])])img = cv2.imread(path_now)img = cv2.cvtColor(img, cv2.COLOR_BGR2RGB)plt.subplot(2, 3, i + 1)plt.imshow(dir_threshold(img, sobel_kernel=5, thresh=(np.pi/4, np.pi/3)))plt.xticks([])plt.yticks([])plt.subplots_adjust(wspace=0, hspace=0)
plt.show()
4.使用HLS进行阈值过滤
def hls_thresh(img, thresh=(100, 255)):hls = cv2.cvtColor(img, cv2.COLOR_RGB2HLS)########分离出s通道s_channel####################填空7 (1行代码)########################_, _, s_channel = cv2.split(hls)#############填空7 (1行代码)########################binary_output = np.zeros_like(s_channel)########转换为二值图,最大最小值可调##################################填空8 (1行代码)########################binary_output[(s_channel > thresh[0]) & (s_channel < thresh[1])] = 255#############填空8 (1行代码)########################return binary_output
5.综合多种阈值过滤方法
def combined_threshold(img):abs_bin = abs_sobel_threshold(img, orient='x', thresh_min=50, thresh_max=255)mag_bin = mag_threshold(img, sobel_kernel=3, mag_threshold=(50, 255))dir_bin = dir_threshold(img, sobel_kernel=15, thresh=(0.7, 1.3))hls_bin = hls_thresh(img, thresh=(170, 255))combined = np.zeros_like(dir_bin)#############组合四个阈值结果,判定车道线,###################例如(abs_bin == 255 | ((mag_bin == 255) & (dir_bin == 255))) | hls_bin == 25)###########可以尝试不同的组合###################################填空9(1行代码)######################### combined[(abs_bin == 255 | ((mag_bin == 255) & (dir_bin == 255))) | hls_bin == 255] = 255combined[(abs_bin == 255) & (mag_bin == 255) & (dir_bin == 255) | (hls_bin == 255)] = 255#############填空9 (1行代码)########################return combined, abs_bin, mag_bin, dir_bin, hls_bin
6.滑动窗口扫描
def line_fit_and_draw_line(binary_warped):# "查找拟合直线"# 对图像对下半部分查找直方图#############填空10(1行代码)截取图像高度的下方1/2处########################histogram = np.sum(binary_warped[int(binary_warped.shape[0]//2):, :], axis=0)#############填空10(1行代码)截取图像高度的下方1/2处########################out_img = (np.dstack((binary_warped, binary_warped, binary_warped)) * 255).astype('uint8')#查找直方图中左右两侧对峰值midpoint = np.int(histogram.shape[0] / 2)#左侧从100到 midpoint的最大值,转换成图像坐标还要加上100哦~#############右侧从midpoint到图像宽度减100的最大值,转换成图像坐标还要加上midpoint哦~################也就是图像左右边缘100像素内不查找车道线###############################填空11(2行代码)查找左侧右侧最大值基本点########################leftx_base = np.argmax(histogram[100:midpoint])+100rightx_base = np.argmax(histogram[midpoint:binary_warped.shape[1]-100])+midpoint#############填空11(2行代码)查找左侧右侧最大值基本点##################################以下是关于滑动窗口查找车道线的代码#####################nwindows = 9 # 将窗口划分为9行window_height = np.int(binary_warped.shape[0] / nwindows)nonzero = binary_warped.nonzero()nonzeroy = np.array(nonzero[0]) # 非零元素所在行nonzerox = np.array(nonzero[1]) # 非零元素所在列leftx_current = leftx_baserightx_current = rightx_basemargin = 100minpix = 10left_lane_inds = []right_lane_inds = []for window in range(nwindows):win_y_low = binary_warped.shape[0] - (window + 1) * window_heightwin_y_high = binary_warped.shape[0] - window * window_heightwin_xleft_low = leftx_current - marginwin_xleft_high = leftx_current + marginwin_xright_low = rightx_current - marginwin_xright_high = rightx_current + margingood_left_inds = ((nonzeroy >= win_y_low) & (nonzeroy < win_y_high) & (nonzerox > win_xleft_low) & (nonzerox < win_xleft_high)).nonzero()[0]good_right_inds = ((nonzeroy >= win_y_low) & (nonzeroy < win_y_high) & (nonzerox >= win_xright_low) & (nonzerox < win_xright_high)).nonzero()[0]left_lane_inds.append(good_left_inds)right_lane_inds.append(good_right_inds)if len(good_left_inds) > minpix:leftx_current = np.int(np.mean(nonzerox[good_left_inds]))if len(good_right_inds) > minpix:rightx_current = np.int(np.mean(nonzerox[good_right_inds]))left_lane_inds = np.concatenate(left_lane_inds)right_lane_inds = np.concatenate(right_lane_inds)leftx = nonzerox[left_lane_inds]lefty = nonzeroy[left_lane_inds]rightx = nonzerox[right_lane_inds]righty = nonzeroy[right_lane_inds]##########以上是关于滑动窗口查找车道线的代码######################将左侧,右侧车道线3次拟合,用函数np.polyfit#######################填空12(2行代码)左侧、右侧车道线拟合#######################para_l = np.polyfit(lefty, leftx, 3) #得到曲线参数para_r = np.polyfit(righty, rightx, 3)#############填空12(2行代码)左侧、右侧车道线拟合#######################################在图上画出拟合的线########################ploty = np.linspace(0, undist.shape[0]-1, undist.shape[0])#########对y进行拟合,x = a * y ^ 2 + b * y + C#############填空13(2行代码)左侧、右侧车道线方程坐标#######################left_fitx = para_l[0] * ploty**3 + para_l[1] * ploty**2 + para_l[2] * ploty + para_l[3]right_fitx = para_r[0] * ploty**3 + para_r[1] * ploty**2 + para_r[2] * ploty + para_r[3]#############填空13(2行代码)左侧、右侧车道线方程坐标#############################生成一张黑图,做mask,将车道线区域标注出来##########color_warp = np.zeros((720, 1280, 3), dtype='uint8')pts_left = np.array([np.transpose(np.vstack([left_fitx, ploty]))])pts_right = np.array([np.flipud(np.transpose(np.vstack([right_fitx, ploty])))])pts = np.hstack((pts_left, pts_right))# 在透射变换后的图上画出车道线cv2.fillPoly(color_warp, np.int_([pts]), (0, 255, 0))# 将画出的车道线的图,逆变换到原来的图上,将color_warp逆变换为newwarp#############填空14(1行代码)#######################newwarp = cv2.warpPerspective(color_warp, m_inv, imgOut_size, flags=cv2.INTER_LINEAR)#############填空14(1行代码)######################## 将原来的图和标注好车道线的图叠加,用cv2.addWeighted,可画成半透明,最终图为result#############填空15(1行代码)#######################result = cv2.addWeighted(img, 0.5, newwarp, 0.5, 0)#############填空15(1行代码)#######################plt.figure(figsize = (30, 30))plt.title('lane')plt.subplot(1, 1, 1)plt.imshow(result)plt.axis('off')
7.图像显示
img = cv2.imread("./testImage/test6.jpg")
out1 = mag_threshold(img)
out2 = abs_sobel_threshold(img)
out3 = dir_threshold(img)
out4 = hls_thresh(img)
imgOut, abs_bin, mab_bin, dir_bin, hls_bin = combined_threshold(img)
plt.figure(figsize = (30, 30))
plt.title('calibration')
plt.subplot(1, 5, 1)
plt.imshow(out1)
plt.title("mag_threshold")
plt.subplot(1, 5, 2)
plt.imshow(out2)
plt.title("abs_sobel_threshold")
plt.subplot(1, 5, 3)
plt.imshow(out3)
plt.title("dir_threshold")
plt.subplot(1, 5, 4)
plt.imshow(out4)
plt.title("hls_thresh")
plt.subplot(1, 5, 5)
plt.imshow(imgOut)
plt.title("combined_threshold")
plt.axis('off')
imgOut_size = (imgOut.shape[1], imgOut.shape[0])
binary_warped = cv2.warpPerspective(imgOut, m, imgOut_size, flags=cv2.INTER_LINEAR)
undist = cv2.imread("./testImage/test6.jpg")
line_fit_and_draw_line(binary_warped)
plt.show()
8.创建空白画布,并绘制指定点
import numpy as np
import cv2
import matplotlib.pyplot as plt
###在图中把点标记出来
plt.figure(figsize=(30, 30))
img = np.zeros((1000,1000,3),dtype=np.uint8)
point_list = [(200, 720), (1100, 720), (595, 450), (685, 450)]  # src
point_list2 =[(300, 720), (980, 720), (300, 0), (980, 0)]  # dst
for point in point_list:cv2.circle(img, point, 10, (255, 0, 0), 3)
for point in point_list2:cv2.circle(img, point, 10, (0, 0, 255), 3)
plt.imshow(img)
plt.show()
相关文章:

车道线分割检测
利用opencv,使用边缘检测、全局变化梯度阈值过滤、算子角度过滤、HLS阈值过滤的方法进行车道线分割检测,综合多种阈值过滤进行检测提高检测精度。 1.利用cv2.Sobel()计算图像梯度(边缘检测) import cv2 import numpy as np import matplotlib.pyplot a…...
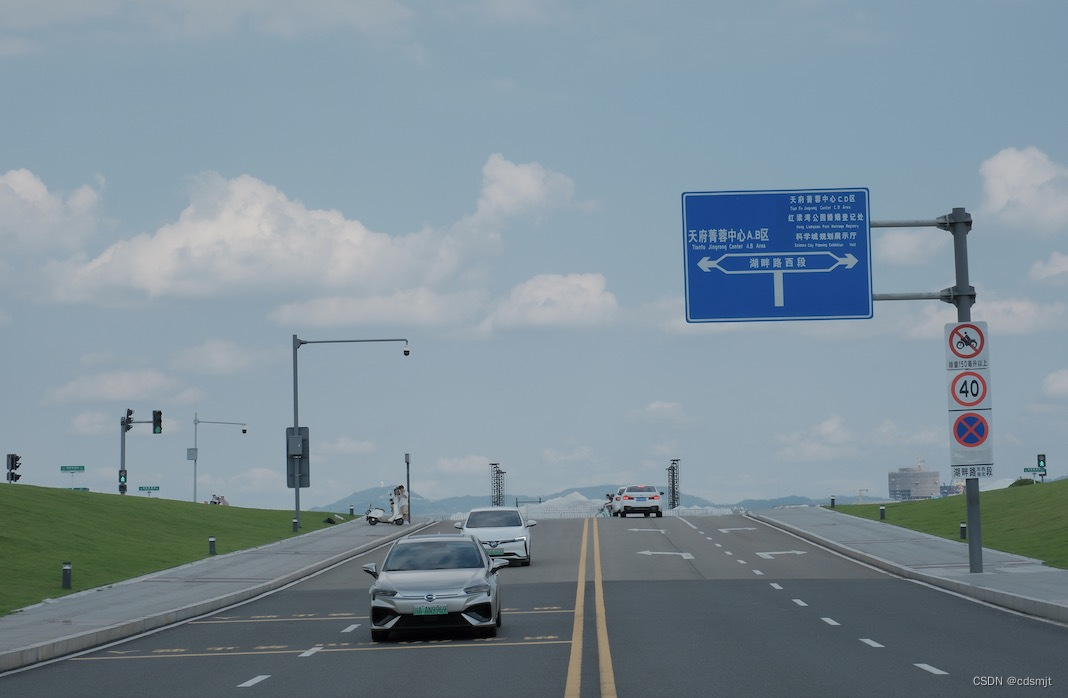
树莓集团又一力作,打造天府蜂巢成都直播产业园样板工程
树莓集团再次推出惊艳之作,以打造成都天府蜂巢直播产业园为目标。该基地将充分展现成都直播产业园的巨大潜力与无限魅力,成为一个真正的产业园样板工程。 强强联手 打造未来 成都天府蜂巢直播产业园位于成都科学城兴隆湖高新技术服务产业园内࿰…...

ubuntu 软件包管理之二制作升级包
Deb 包(Debian 软件包)是一种用于在 Debian 及其衍生发行版(例如 Ubuntu)中分发和安装软件的标准包装格式。它们构成了 Debian Linux 发行版中的软件包管理系统的核心组成部分,旨在简化软件的分发、安装、更新和卸载流程。在本篇文章中,我们将深入探讨以下内容: Deb 包基…...
)
TCP/IP网络江湖——数据链路层的防御招式(数据链路层下篇:数据链路层的安全问题)
目录 引言 一、 数据链路层的隐私与保密 二、数据链路层的安全协议与加密...

ios项目安装hermes-engine太慢问题
问题说明 ios工程,在使用"pod install"安装依赖的时候,由于超时总是报错 $ pod install ... Installing hermes-engine (0.71.11)[!] Error installing hermes-engine [!] /usr/bin/curl -f -L -o /var/folders/4c/slcchpy55s53ysmz_1_q_gzw…...
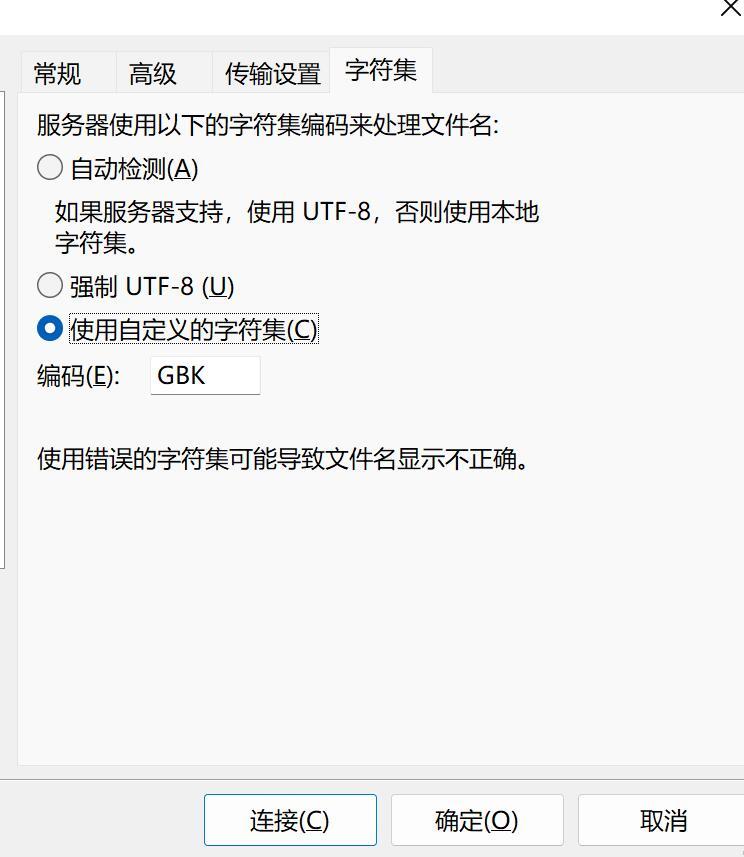
构建个人云存储:本地电脑搭建SFTP服务器,开启公网访问,轻松共享与管理个人文件!
本地电脑搭建SFTP服务器,并实现公网访问 文章目录 本地电脑搭建SFTP服务器,并实现公网访问1. 搭建SFTP服务器1.1 下载 freesshd 服务器软件1.3 启动SFTP服务1.4 添加用户1.5 保存所有配置 2. 安装SFTP客户端FileZilla测试2.1 配置一个本地SFTP站点2.2 内…...

springboot 下载文件为excel数据,中文自定义单元格宽度
/**2 * Description:表格自适应宽度(中文支持)3 * Author: 4 * param sheet sheet5 * param columnLength 列数6 */7 private static void setSizeColumn(HSSFSheet sheet, int columnLength) {8 for (int columnNum 0; columnNum < …...

机器学习 面试/笔试题
1. 生成模型 VS 判别模型 生成模型: 由数据学得联合概率分布函数 P ( X , Y ) P(X,Y) P(X,Y),求出条件概率分布 P ( Y ∣ X ) P(Y|X) P(Y∣X)的预测模型。 朴素贝叶斯、隐马尔可夫模型、高斯混合模型、文档主题生成模型(LDA)、限制玻尔兹曼机…...

某企查ymg_ssr列表详情
js篇— 今天来看下某企查的列表详情–侵删 header发现这个参数 先断点一下 然后上一步 就到了这个地方 就开始扣一下这个js 三大段,先不解混淆了, 给a粘贴出来 ,去掉自执行 给结果稍微改一下 缺windows,开始补环境 直接上…...
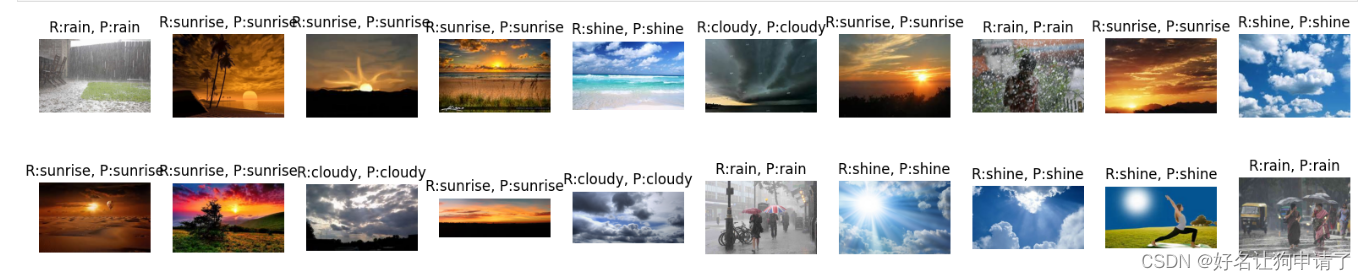
使用YOLOv5的backbone网络识别图像天气 - P9
目录 环境步骤环境设置包引用声明一个全局的设备 数据准备收集数据集信息构建数据集在数据集中读取分类名称划分训练、测试数据集数据集划分批次 模型设计编写维持卷积前后图像大小不变的padding计算函数编写YOLOv5中使用的卷积模块编写YOLOv5中使用的Bottleneck模块编写YOLOv5…...

TikTok海外扩张:亚马逊的新对手崛起
随着社交媒体和电子商务的融合,TikTok正迅速崭露头角,成为亚马逊等传统电商巨头的潜在竞争对手。这一新兴平台的快速发展引发了广泛的关注,特别是在全球范围内。 在这篇文章中,我们将探讨TikTok海外扩张的战略,以及它…...
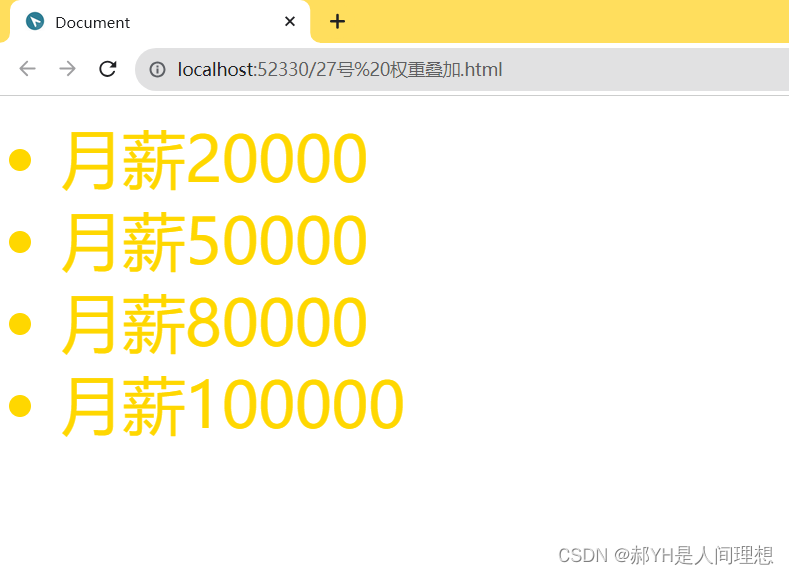
CSS详细基础(五)选择器的优先级
本节介绍选择器优先级,优先级决定了元素最终展示的样式~ 浏览器是通过判断CSS优先级,来决定到底哪些属性值是与元素最为相关的,从而作用到该元素上。CSS选择器的合理组成规则决定了优先级,我们也常常用选择器优先级来合理控制元素…...

LLM-TAP随笔——有监督微调【深度学习】【PyTorch】【LLM】
文章目录 5、 有监督微调5.1、提示学习&语境学习5.2、高效微调5.3、模型上下文窗口扩展5.4、指令数据构建5.5、开源指令数据集 5、 有监督微调 5.1、提示学习&语境学习 提示学习 完成预测的三个阶段:提示添加、答案搜索、答案映射 提示添加 “[X] 我感到…...
kafka伪集群部署,使用docker环境拷贝模式
线上启动容器的方式是复制容器的运行环境出来,然后进行运行脚本的形式 1:在home/kafka目录下创建如下目录 2:复制kafka1容器内的数据/bitnami/kafka/data,直接放在1992_data里面,同理,复制kafka2容器内的数据/bitnami/…...
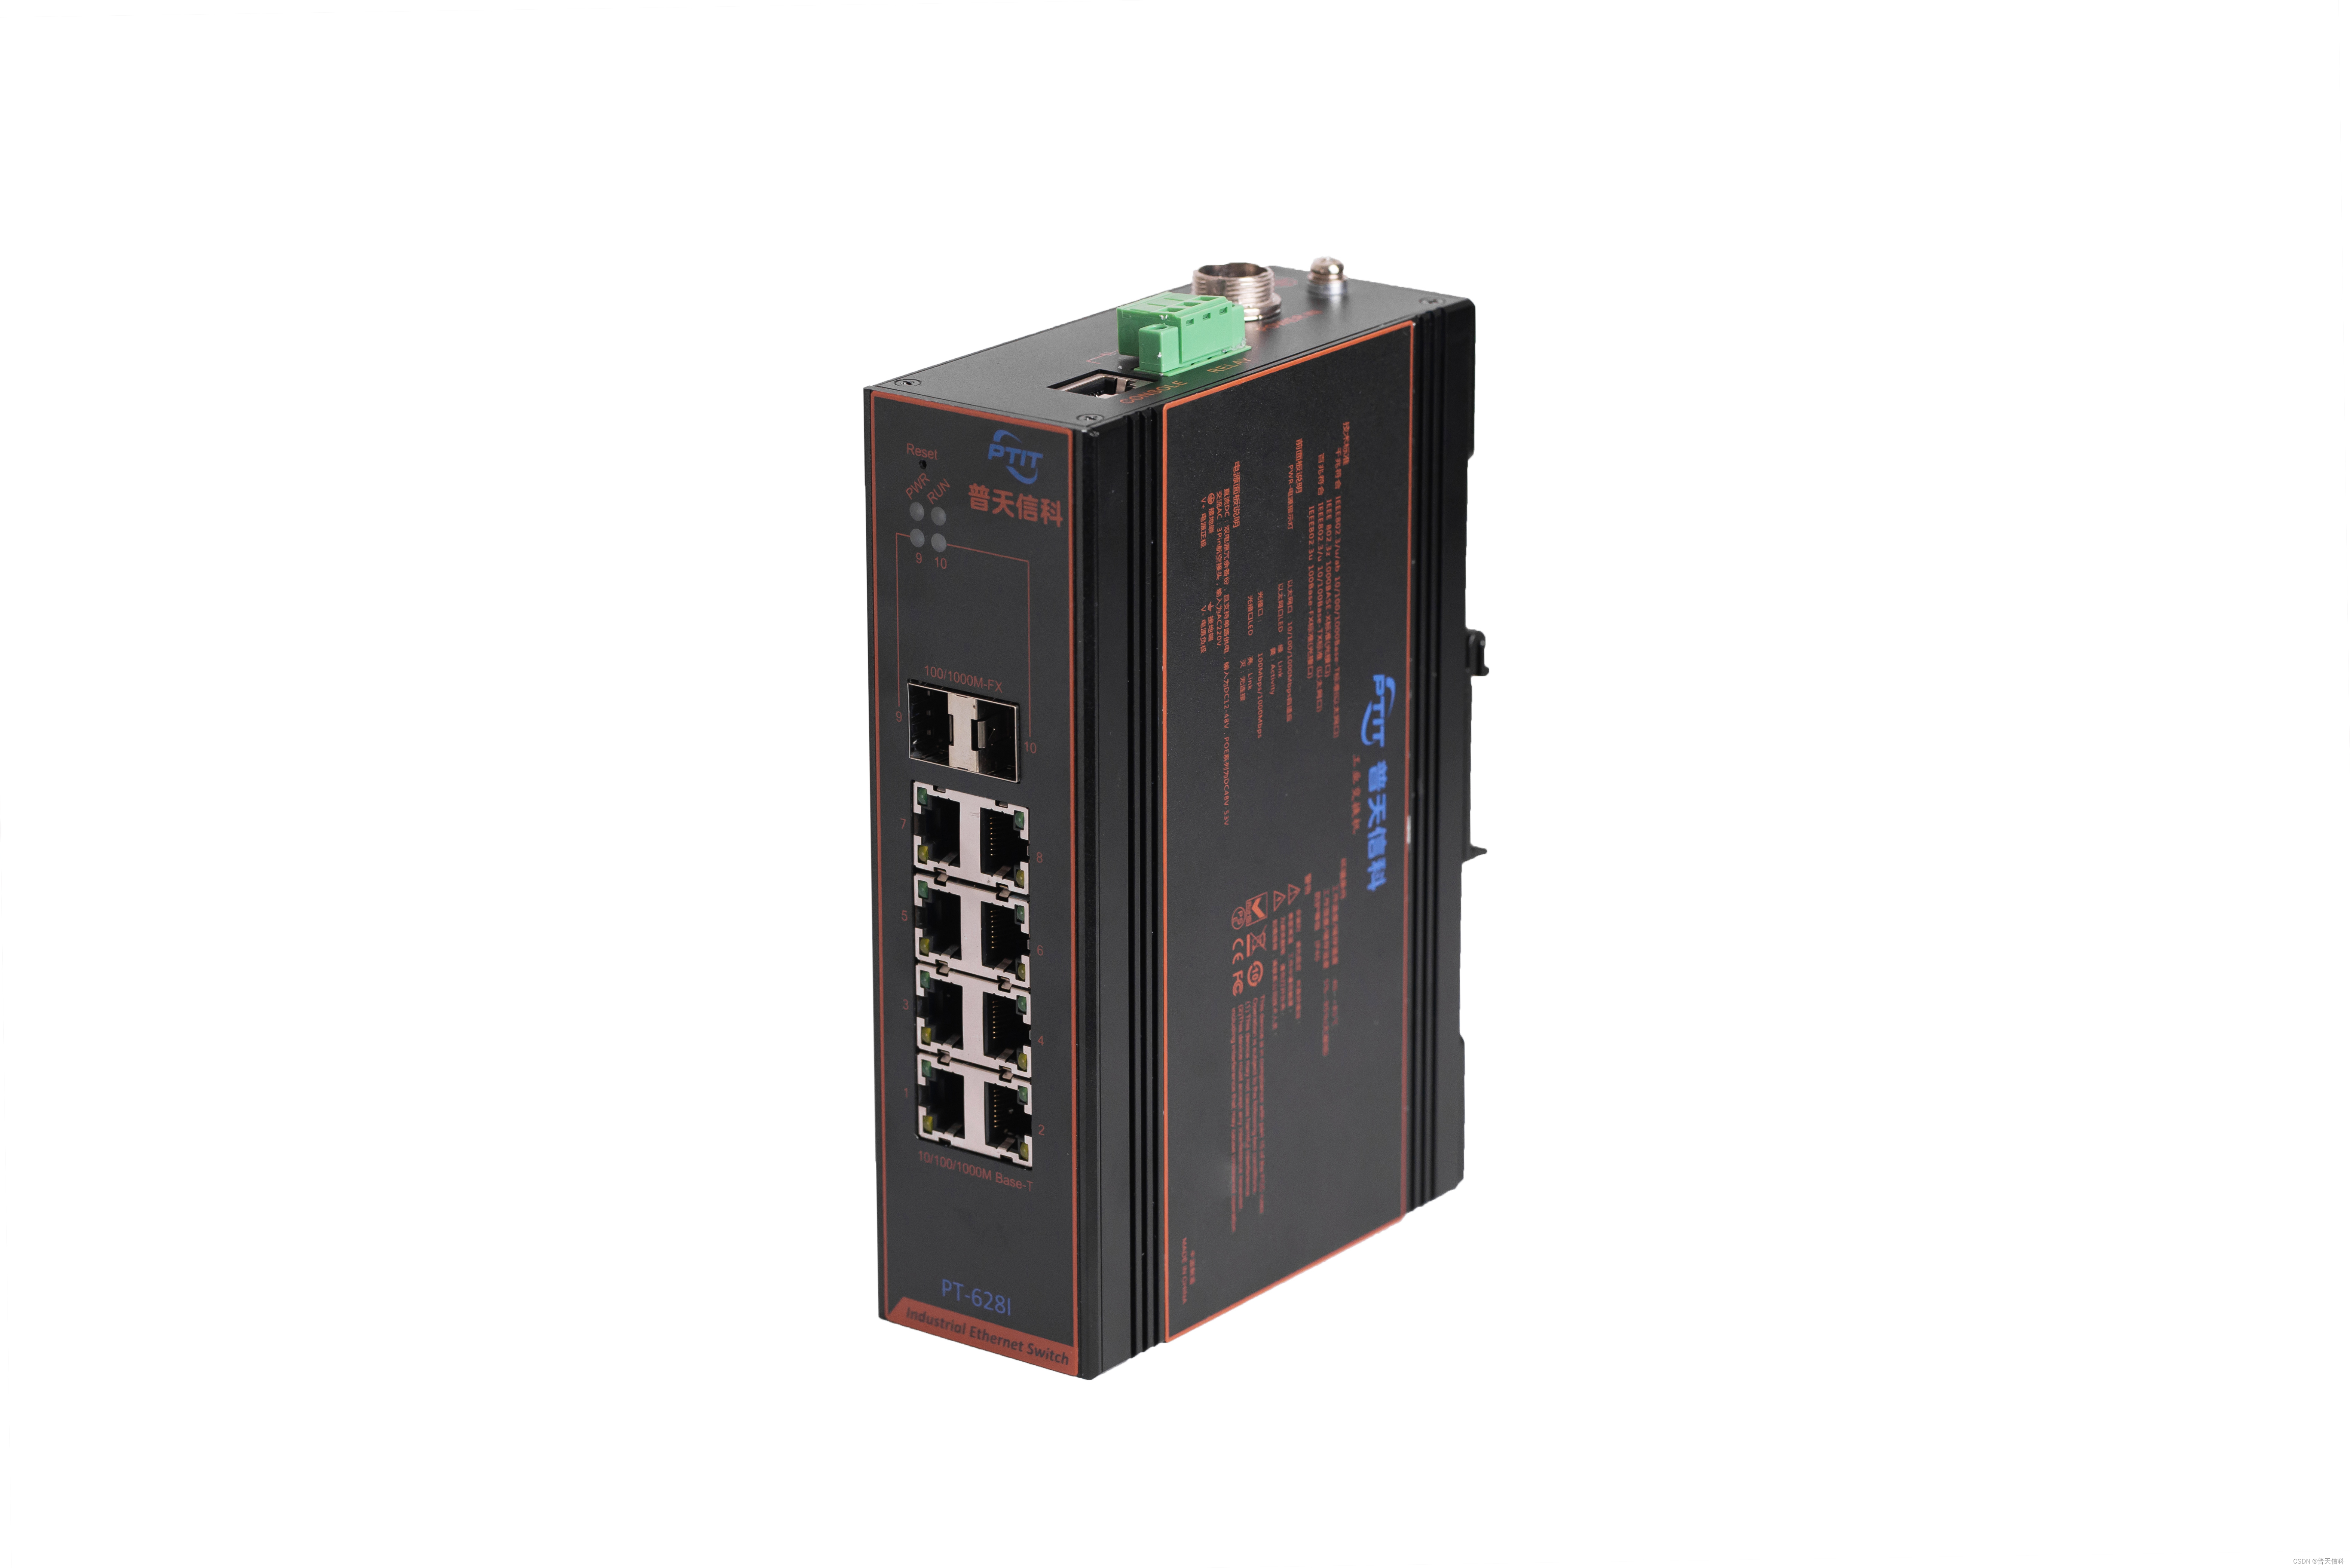
工业交换机一般的价格是多少呢?
工业交换机是一种应用于工业领域的网络设备。它的性能和所有安全指标都比一般商业交换机更加稳定。所以,工业级交换机的价格相对于普通的交换机要稍稍昂贵一些。工业交换机一般的价格是多少呢?每个厂家的交换机价格是不是都一样呢? 首先&…...
QT使用前的知识
QT使用前的知识 常用的快捷键 源文件的内容解释 .pro文件的解释 头文件的解释 构建新的对象—组成对象树 槽函数 自定的信号和槽 槽函数的信号是一个重载函数时 电机按钮触发信号 调用无参数的信号 断开信号...

Unity制作旋转光束
Unity制作旋转光束 大家好,我是阿赵。 这是一个在很多游戏里面可能都看到过的效果,在传送门、魔法阵、角色等脚底下往上散发出一束拉丝形状的光,然后在不停的旋转。 这次来在Unity引擎里面做一下这种效果。 一、准备材料 需要准备的素材很简…...

考研王道强化阶段(二轮复习)“算法题”备考打卡表 记录
问题:做408真题_2010_42题,即王道书 2.2.3_大题_10 思路: 回头补 代码: int moveL(SqlList &L,SqlList &S,int p) {// 健壮性表达if( L.len 0 ){return 0;}// 调用另外一个顺序表存储pos前面的元素for( int i0;i<p;…...
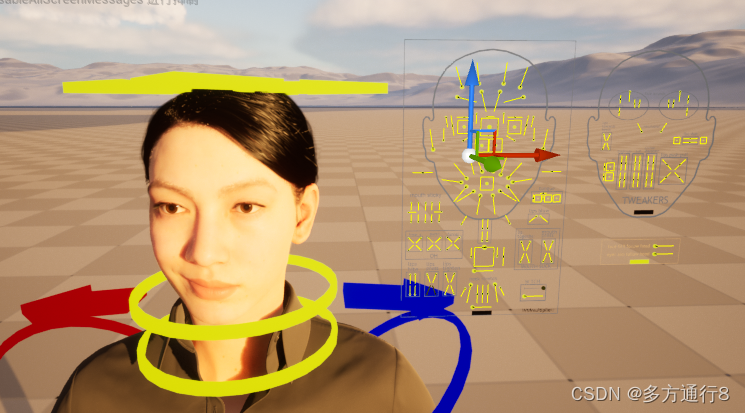
UE4/5数字人MetaHuman通过已有动画进行修改
目录 通过已有动画修改动画 开始制作 创建一个关卡序列 将动画序列烘焙到控制绑定 打开我们自己创建的动画序列 之后便是烘焙出来 通过已有动画修改动画 首先架设我们已经有相关的MetaHuman的动画,但是这个动画因为是外部导入进来的,所以可能会出…...

在Mac M2本地注册GitLab runner
最近在搞公司的CI/CD,简单记录下部分过程 安装runner sudo curl --output /usr/local/bin/gitlab-runner "https://gitlab-runner-downloads.s3.amazonaws.com/latest/binaries/gitlab-runner-darwin-arm64" 创建runner 这个步骤需要在gitlab中进行&am…...

开放标准如何重塑多媒体设备开发:从碎片化到模块化
1. 项目概述:为什么我们需要一个“开放标准”?如果你在消费电子、汽车座舱或者智能家居领域待过几年,一定会对“多媒体设备”这个词又爱又恨。爱的是,它代表了用户体验的核心——那块屏幕、那套音响、那个能看视频能听歌的交互界面…...


多智能体编排实战:从架构设计到生产部署的12周训练指南
1. 项目概述与核心价值最近在探索如何系统性地掌握多智能体编排技术时,我遇到了一个名为“Shadow Dojo”的开源项目。这个名字很有意思,“道场”一词本身就意味着一个需要持续练习、精进技艺的地方。这个项目将自己定位为“训练场”,目标非常…...

第三方令牌泄露引发的供应链数据泄露治理研究 —— 以 Zara 事件为例
摘要 2026 年 4 月,黑客组织 ShinyHunters 通过入侵云分析服务商 Anodot 并窃取其身份认证令牌,非法访问下游多家企业云数据平台,导致快时尚品牌 Zara 近 19.7 万名用户信息泄露,泄露字段含电子邮箱、订单 ID、商品 SKU 及客服工单…...

boardgame.io混沌测试终极指南:如何构建稳定的多人游戏系统
boardgame.io混沌测试终极指南:如何构建稳定的多人游戏系统 【免费下载链接】boardgame.io State Management and Multiplayer Networking for Turn-Based Games 项目地址: https://gitcode.com/gh_mirrors/bo/boardgame.io boardgame.io是一个专注于回合制游…...

LLMFarm性能优化技巧:提升模型推理速度和内存效率的10个方法
LLMFarm性能优化技巧:提升模型推理速度和内存效率的10个方法 【免费下载链接】LLMFarm llama and other large language models on iOS and MacOS offline using GGML library. 项目地址: https://gitcode.com/gh_mirrors/ll/LLMFarm LLMFarm是一款在iOS和ma…...
)
Spring Boot项目对接公司AD域,手把手搞定用户登录和密码重置(附SSL证书避坑指南)
Spring Boot企业级AD域集成实战:从登录到密码重置的全链路解决方案 当企业IT系统发展到一定规模,统一身份认证就成了刚需。上周我接手了一个内部ERP系统的改造项目,要求对接公司Active Directory实现员工单点登录——听起来简单,但…...

AK7739 TDM调试避坑指南:从tinymix命令到SA6125平台时钟极性BUG排查
AK7739 TDM音频接口深度调试:从寄存器配置到时钟极性异常实战解析 当我们在嵌入式音频系统中集成AK7739编解码器时,TDM(时分复用)接口的调试往往是工程师面临的最大挑战之一。不同于标准的I2S协议,TDM接口的高度可配置…...

designmodel可以输出各种类型的几何模型文件格式,兼容各种主流的CAD绘制软件。
designmodel可以输出各种类型的几何模型文件格式,兼容各种主流的CAD绘制软件。 这是Geom软件的文件格式选择界面,各格式的用途和适用场景如下: DesignModeler Database (*.agdb):ANSYS DesignModeler的原生数据库格式,用于保存几何模型的完整设计数据,支持后续在ANSYS…...

Python自动化脚本:模拟鼠标键盘输入保持系统活跃状态
1. 项目概述:当你的电脑需要“假装在线”你有没有遇到过这样的场景:公司要求电脑必须保持在线状态,否则会被判定为“离开”或“闲置”,影响考勤或系统状态;或者,你在运行一个需要持续交互的软件,…...