pandas教程:时区计数 USA.gov Data from Bitly USA.gov数据集
文章目录
- Chapter 14 Data Analysis Examples(数据分析实例)
- 14.1 USA.gov Data from Bitly(USA.gov数据集)
- 1 Counting Time Zones in Pure Python(用纯python代码对时区进行计数)
- 2 Counting Time Zones with pandas(用pandas对时区进行计数)
Chapter 14 Data Analysis Examples(数据分析实例)
14.1 USA.gov Data from Bitly(USA.gov数据集)
2011年,短链接服务(URL shortening service)商Bitly和美国政府网站USA.gov合作,提供了一份从用户中收集来的匿名数据,这些用户使用了结尾为.gov或.mail的短链接。在2011年,这些数据的动态信息每小时都会保存一次,并可供下载。不过在2017年,这项服务被停掉了。
数据是每小时更新一次,文件中的每一行都用JOSN(JavaScript Object Notation)格式保存。我们先读取几行看一下数据是什么样的:
path = '../datasets/bitly_usagov/example.txt'
open(path).readline()
'{ "a": "Mozilla\\/5.0 (Windows NT 6.1; WOW64) AppleWebKit\\/535.11 (KHTML, like Gecko) Chrome\\/17.0.963.78 Safari\\/535.11", "c": "US", "nk": 1, "tz": "America\\/New_York", "gr": "MA", "g": "A6qOVH", "h": "wfLQtf", "l": "orofrog", "al": "en-US,en;q=0.8", "hh": "1.usa.gov", "r": "http:\\/\\/www.facebook.com\\/l\\/7AQEFzjSi\\/1.usa.gov\\/wfLQtf", "u": "http:\\/\\/www.ncbi.nlm.nih.gov\\/pubmed\\/22415991", "t": 1331923247, "hc": 1331822918, "cy": "Danvers", "ll": [ 42.576698, -70.954903 ] }\n'
python有很多内置的模块能把JSON字符串转换成Python字典对象。这里我们用JSON模块:
import json
path = '../datasets/bitly_usagov/example.txt'
records = [json.loads(line) for line in open(path)]
上面这种方法叫做列表推导式, list comprehension, 在一组字符串上执行一条相同操作(比如这里的json.loads)。结果对象records现在是一个由dict组成的list:
records[0]
{'a': 'Mozilla/5.0 (Windows NT 6.1; WOW64) AppleWebKit/535.11 (KHTML, like Gecko) Chrome/17.0.963.78 Safari/535.11','al': 'en-US,en;q=0.8','c': 'US','cy': 'Danvers','g': 'A6qOVH','gr': 'MA','h': 'wfLQtf','hc': 1331822918,'hh': '1.usa.gov','l': 'orofrog','ll': [42.576698, -70.954903],'nk': 1,'r': 'http://www.facebook.com/l/7AQEFzjSi/1.usa.gov/wfLQtf','t': 1331923247,'tz': 'America/New_York','u': 'http://www.ncbi.nlm.nih.gov/pubmed/22415991'}
records[0]['tz']
'America/New_York'
1 Counting Time Zones in Pure Python(用纯python代码对时区进行计数)
我们想知道数据集中出现在哪个时区(即tz字段)
time_zones = [rec['tz'] for rec in records]
---------------------------------------------------------------------------KeyError                                  Traceback (most recent call last)<ipython-input-10-db4fbd348da9> in <module>()
----> 1 time_zones = [rec['tz'] for rec in records]<ipython-input-10-db4fbd348da9> in <listcomp>(.0)
----> 1 time_zones = [rec['tz'] for rec in records]KeyError: 'tz'
看来并不是所有的记录都有时区字段。那么只需要在推导式的末尾加一个if 'tz' in rec判断即可
time_zones = [rec['tz'] for rec in records if 'tz' in rec]
time_zones[:10]
['America/New_York','America/Denver','America/New_York','America/Sao_Paulo','America/New_York','America/New_York','Europe/Warsaw','','','']
在这10条时区信息中,可以看到有些是空字符串,现在先留着。
为了对时区进行计数,我们用两种方法:一个用纯python代码,比较麻烦。另一个用pandas,比较简单。 这里我们先介绍使用纯python代码的方法:
遍历时区的过程中将计数值保存在字典中:
def get_counts(sequence):counts = {}for x in sequence:if x in counts:counts[x] += 1else:counts[x] = 1return counts
使用python标准库的话,能把代码写得更简洁一些:
from collections import defaultdictdef get_counts2(sequence):counts = defaultdict(int) # 所有的值均会被初始化为0for x in sequence:counts[x] += 1return counts
(译者:下面关于defaultdict的用法是我从Stack Overflow上找到的,英文比较多,简单的说就是通常如果一个字典里不存在一个key,调用的时候会报错,但是如果我们设置了了default,就不会被报错,而是会新建一个key,对应的value就是我们设置的int,这里int代表0)
defaultdict means that if a key is not found in the dictionary, then instead of a KeyError being thrown, a new entry is created. The type of this new entry is given by the argument of defaultdict.
somedict = {}
print(somedict[3]) # KeyErrorsomeddict = defaultdict(int)
print(someddict[3]) # print int(), thus 0
Usually, a Python dictionary throws a KeyError if you try to get an item with a key that is not currently in the dictionary. The defaultdict in contrast will simply create any items that you try to access (provided of course they do not exist yet). To create such a “default” item, it calls the function object that you pass in the constructor (more precisely, it’s an arbitrary “callable” object, which includes function and type objects). For the first example, default items are created using
int(), which will return the integer object 0. For the second example, default items are created usinglist(), which returns a new empty list object.
someddict = defaultdict(int)
print(someddict[3])
0
someddict[3]
0
上面用函数的方式写出来是为了有更高的可用性。要对它进行时区处理,只需要将time_zones传入即可:
counts = get_counts(time_zones)
counts['America/New_York']
1251
len(time_zones)
3440
如何想要得到前10位的时区及其计数值,我们需要一些有关字典的处理技巧:
def top_counts(count_dict, n=10):value_key_pairs = [(count, tz) for tz, count in count_dict.items()]value_key_pairs.sort()return value_key_pairs[-n:]
top_counts(counts)
[(33, 'America/Sao_Paulo'),(35, 'Europe/Madrid'),(36, 'Pacific/Honolulu'),(37, 'Asia/Tokyo'),(74, 'Europe/London'),(191, 'America/Denver'),(382, 'America/Los_Angeles'),(400, 'America/Chicago'),(521, ''),(1251, 'America/New_York')]
如果用python标准库里的collections.Counter类,能让这个任务变得更简单
from collections import Counter
counts = Counter(time_zones)
counts.most_common(10)
[('America/New_York', 1251),('', 521),('America/Chicago', 400),('America/Los_Angeles', 382),('America/Denver', 191),('Europe/London', 74),('Asia/Tokyo', 37),('Pacific/Honolulu', 36),('Europe/Madrid', 35),('America/Sao_Paulo', 33)]
2 Counting Time Zones with pandas(用pandas对时区进行计数)
从一组原始记录中创建DataFrame是很简单的,直接把records传递给pandas.DataFrame即可:
import pandas as pd
import numpy as np
frame = pd.DataFrame(records)
frame.info()
<class 'pandas.core.frame.DataFrame'>
RangeIndex: 3560 entries, 0 to 3559
Data columns (total 18 columns):
_heartbeat_    120 non-null float64
a              3440 non-null object
al             3094 non-null object
c              2919 non-null object
cy             2919 non-null object
g              3440 non-null object
gr             2919 non-null object
h              3440 non-null object
hc             3440 non-null float64
hh             3440 non-null object
kw             93 non-null object
l              3440 non-null object
ll             2919 non-null object
nk             3440 non-null float64
r              3440 non-null object
t              3440 non-null float64
tz             3440 non-null object
u              3440 non-null object
dtypes: float64(4), object(14)
memory usage: 500.7+ KB
frame['tz'][:10]
0     America/New_York
1       America/Denver
2     America/New_York
3    America/Sao_Paulo
4     America/New_York
5     America/New_York
6        Europe/Warsaw
7
8
9
Name: tz, dtype: object
这里frame的输出形式是summary view, 主要用于较大的dataframe对象。frame['tz']所返回的Series对象有一个value_counts方法,该方法可以让我们得到想要的信息:
tz_counts = frame['tz'].value_counts()
tz_counts[:10]
America/New_York       1251521
America/Chicago         400
America/Los_Angeles     382
America/Denver          191
Europe/London            74
Asia/Tokyo               37
Pacific/Honolulu         36
Europe/Madrid            35
America/Sao_Paulo        33
Name: tz, dtype: int64
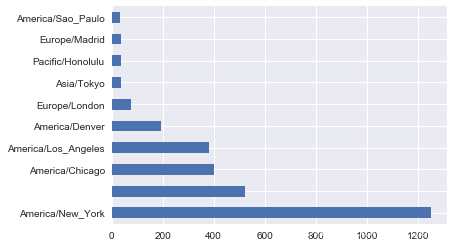
我们能利用matplotlib为这段数据生成一张图片。这里我们先给记录中未知或缺失的时区填上一个替代值。fillna函数可以替代缺失值(NA),而未知值(空字符串)则可以通过布尔型数组索引,加以替换:
clean_tz = frame['tz'].fillna('Missing')
clean_tz[clean_tz == ''] = 'Unknown'
tz_counts = clean_tz.value_counts()
tz_counts[:10]
America/New_York       1251
Unknown                 521
America/Chicago         400
America/Los_Angeles     382
America/Denver          191
Missing                 120
Europe/London            74
Asia/Tokyo               37
Pacific/Honolulu         36
Europe/Madrid            35
Name: tz, dtype: int64
利用counts对象的plot方法即可得到一张水平条形图:
%matplotlib inline
tz_counts[:10].plot(kind='barh', rot=0)
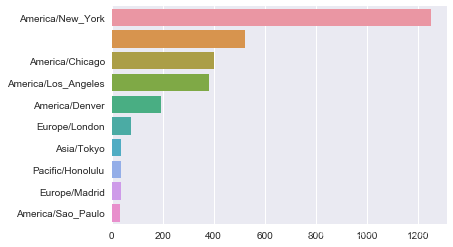
当然,我们也可以使用之前介绍的seaborn来画一个水平条形图(horizontal bar plot):
import seaborn as sns
subset = tz_counts[:10]
sns.barplot(y=subset.index, x=subset.values)
我们还可以对这种数据进行更多的处理。比如a字段含有执行URL操作的浏览器、设备、应用程序的相关信息:
frame['a'][1]
'GoogleMaps/RochesterNY'
frame['a'][50]
'Mozilla/5.0 (Windows NT 5.1; rv:10.0.2) Gecko/20100101 Firefox/10.0.2'
frame['a'][51]
'Mozilla/5.0 (Linux; U; Android 2.2.2; en-us; LG-P925/V10e Build/FRG83G) AppleWebKit/533.1 (KHTML, like Gecko) Version/4.0 Mobile Safari/533.1'
frame['a'][:5]
0    Mozilla/5.0 (Windows NT 6.1; WOW64) AppleWebKi...
1                               GoogleMaps/RochesterNY
2    Mozilla/4.0 (compatible; MSIE 8.0; Windows NT ...
3    Mozilla/5.0 (Macintosh; Intel Mac OS X 10_6_8)...
4    Mozilla/5.0 (Windows NT 6.1; WOW64) AppleWebKi...
Name: a, dtype: object
将这些USER_AGENT字符串中的所有信息都解析出来是一件挺郁闷的工作。不过只要掌握了Python内置的字符串函数和正则表达式,就方便了。比如,我们可以把字符串的第一节(与浏览器大致对应)分离出来得到另一份用户行为摘要:
results = Series([x.split()[0] for x in frame.a.dropna()])
results[:5]
0               Mozilla/5.0
1    GoogleMaps/RochesterNY
2               Mozilla/4.0
3               Mozilla/5.0
4               Mozilla/5.0
dtype: object
results.value_counts()[:8]
Mozilla/5.0                 2594
Mozilla/4.0                  601
GoogleMaps/RochesterNY       121
Opera/9.80                    34
TEST_INTERNET_AGENT           24
GoogleProducer                21
Mozilla/6.0                    5
BlackBerry8520/5.0.0.681       4
dtype: int64
现在,假设我们想按Windows和非Windows用户对时区统计信息进行分解。为了简单期间,我们假定只要agent字符串中含有“windows”就认为该用户是windows用户。由于有的agent缺失,所以先将他们从数据中移除:
cframe = frame[frame.a.notnull()]
cframe.head()
| _heartbeat_ | a | al | c | cy | g | gr | h | hc | hh | kw | l | ll | nk | r | t | tz | u | |
|---|---|---|---|---|---|---|---|---|---|---|---|---|---|---|---|---|---|---|
| 0 | NaN | Mozilla/5.0 (Windows NT 6.1; WOW64) AppleWebKi... | en-US,en;q=0.8 | US | Danvers | A6qOVH | MA | wfLQtf | 1.331823e+09 | 1.usa.gov | NaN | orofrog | [42.576698, -70.954903] | 1.0 | http://www.facebook.com/l/7AQEFzjSi/1.usa.gov/... | 1.331923e+09 | America/New_York | http://www.ncbi.nlm.nih.gov/pubmed/22415991 |
| 1 | NaN | GoogleMaps/RochesterNY | NaN | US | Provo | mwszkS | UT | mwszkS | 1.308262e+09 | j.mp | NaN | bitly | [40.218102, -111.613297] | 0.0 | http://www.AwareMap.com/ | 1.331923e+09 | America/Denver | http://www.monroecounty.gov/etc/911/rss.php |
| 2 | NaN | Mozilla/4.0 (compatible; MSIE 8.0; Windows NT ... | en-US | US | Washington | xxr3Qb | DC | xxr3Qb | 1.331920e+09 | 1.usa.gov | NaN | bitly | [38.9007, -77.043098] | 1.0 | http://t.co/03elZC4Q | 1.331923e+09 | America/New_York | http://boxer.senate.gov/en/press/releases/0316... |
| 3 | NaN | Mozilla/5.0 (Macintosh; Intel Mac OS X 10_6_8)... | pt-br | BR | Braz | zCaLwp | 27 | zUtuOu | 1.331923e+09 | 1.usa.gov | NaN | alelex88 | [-23.549999, -46.616699] | 0.0 | direct | 1.331923e+09 | America/Sao_Paulo | http://apod.nasa.gov/apod/ap120312.html |
| 4 | NaN | Mozilla/5.0 (Windows NT 6.1; WOW64) AppleWebKi... | en-US,en;q=0.8 | US | Shrewsbury | 9b6kNl | MA | 9b6kNl | 1.273672e+09 | bit.ly | NaN | bitly | [42.286499, -71.714699] | 0.0 | http://www.shrewsbury-ma.gov/selco/ | 1.331923e+09 | America/New_York | http://www.shrewsbury-ma.gov/egov/gallery/1341... |
其次根据a值计算出各行是否是windows:
cframe['os'] = np.where(cframe['a'].str.contains('Windows'), 'Windows', 'Not Windows')
/Users/xu/anaconda/envs/py35/lib/python3.5/site-packages/ipykernel/__main__.py:2: SettingWithCopyWarning:
A value is trying to be set on a copy of a slice from a DataFrame.
Try using .loc[row_indexer,col_indexer] = value insteadSee the caveats in the documentation: http://pandas.pydata.org/pandas-docs/stable/indexing.html#indexing-view-versus-copyfrom ipykernel import kernelapp as app
cframe['os'][:5]
0        Windows
1    Not Windows
2        Windows
3    Not Windows
4        Windows
Name: os, dtype: object
接下来就可以根据时区和新得到的操作系统列表对数据进行分组了:
by_tz_os = cframe.groupby(['tz', 'os'])
by_tz_os.size()
tz                              os         Not Windows    245Windows        276
Africa/Cairo                    Windows          3
Africa/Casablanca               Windows          1
Africa/Ceuta                    Windows          2
Africa/Johannesburg             Windows          1
Africa/Lusaka                   Windows          1
America/Anchorage               Not Windows      4Windows          1
America/Argentina/Buenos_Aires  Not Windows      1
America/Argentina/Cordoba       Windows          1
America/Argentina/Mendoza       Windows          1
America/Bogota                  Not Windows      1Windows          2
America/Caracas                 Windows          1
America/Chicago                 Not Windows    115Windows        285
America/Chihuahua               Not Windows      1Windows          1
America/Costa_Rica              Windows          1
America/Denver                  Not Windows    132Windows         59
America/Edmonton                Not Windows      2Windows          4
America/Guayaquil               Not Windows      2
America/Halifax                 Not Windows      1Windows          3
America/Indianapolis            Not Windows      8Windows         12
America/La_Paz                  Windows          1...
Europe/Madrid                   Not Windows     16Windows         19
Europe/Malta                    Windows          2
Europe/Moscow                   Not Windows      1Windows          9
Europe/Oslo                     Not Windows      2Windows          8
Europe/Paris                    Not Windows      4Windows         10
Europe/Prague                   Not Windows      3Windows          7
Europe/Riga                     Not Windows      1Windows          1
Europe/Rome                     Not Windows      8Windows         19
Europe/Skopje                   Windows          1
Europe/Sofia                    Windows          1
Europe/Stockholm                Not Windows      2Windows         12
Europe/Uzhgorod                 Windows          1
Europe/Vienna                   Not Windows      3Windows          3
Europe/Vilnius                  Windows          2
Europe/Volgograd                Windows          1
Europe/Warsaw                   Not Windows      1Windows         15
Europe/Zurich                   Not Windows      4
Pacific/Auckland                Not Windows      3Windows          8
Pacific/Honolulu                Windows         36
Length: 149, dtype: int64
上面通过size对分组结果进行计数,类似于value_counts函数,并利用unstack对计数结果进行重塑为一个表格:
agg_counts = by_tz_os.size().unstack().fillna(0)
agg_counts[:10]
| os | Not Windows | Windows |
|---|---|---|
| tz | ||
| 245.0 | 276.0 | |
| Africa/Cairo | 0.0 | 3.0 |
| Africa/Casablanca | 0.0 | 1.0 |
| Africa/Ceuta | 0.0 | 2.0 |
| Africa/Johannesburg | 0.0 | 1.0 |
| Africa/Lusaka | 0.0 | 1.0 |
| America/Anchorage | 4.0 | 1.0 |
| America/Argentina/Buenos_Aires | 1.0 | 0.0 |
| America/Argentina/Cordoba | 0.0 | 1.0 |
| America/Argentina/Mendoza | 0.0 | 1.0 |
最后,我们来选取最常出现的时区。为了达到这个目的,根据agg_counts中的行数构造了一个简洁索引数组:
indexer = agg_counts.sum(1).argsort()
indexer[:10]
tz24
Africa/Cairo                      20
Africa/Casablanca                 21
Africa/Ceuta                      92
Africa/Johannesburg               87
Africa/Lusaka                     53
America/Anchorage                 54
America/Argentina/Buenos_Aires    57
America/Argentina/Cordoba         26
America/Argentina/Mendoza         55
dtype: int64
然后通过take按照这个顺序截取了最后10行:
count_subset = agg_counts.take(indexer)[-10:]
count_subset
| os | Not Windows | Windows |
|---|---|---|
| tz | ||
| America/Sao_Paulo | 13.0 | 20.0 |
| Europe/Madrid | 16.0 | 19.0 |
| Pacific/Honolulu | 0.0 | 36.0 |
| Asia/Tokyo | 2.0 | 35.0 |
| Europe/London | 43.0 | 31.0 |
| America/Denver | 132.0 | 59.0 |
| America/Los_Angeles | 130.0 | 252.0 |
| America/Chicago | 115.0 | 285.0 |
| 245.0 | 276.0 | |
| America/New_York | 339.0 | 912.0 |
pandas有一个很方便的方法叫nlargest,可以实现相同效果:
agg_counts.sum(1).nlargest(10)
tz
America/New_York       1251.0521.0
America/Chicago         400.0
America/Los_Angeles     382.0
America/Denver          191.0
Europe/London            74.0
Asia/Tokyo               37.0
Pacific/Honolulu         36.0
Europe/Madrid            35.0
America/Sao_Paulo        33.0
dtype: float64
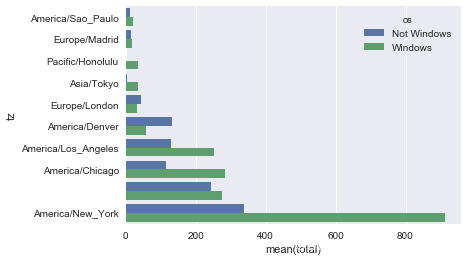
上面的输出结果可以画成条形图;通过给seaborn的barplot函数传递一个参数,来画出堆积条形图(stacked bar plot):
# Rearrange the data for plotting
count_subset = count_subset.stack()
count_subset.head()
tz                 os
America/Sao_Paulo  Not Windows    13.0Windows        20.0
Europe/Madrid      Not Windows    16.0Windows        19.0
Pacific/Honolulu   Not Windows     0.0
dtype: float64
count_subset.name = 'total'
count_subset = count_subset.reset_index()
count_subset[:10]
| tz | os | total | |
|---|---|---|---|
| 0 | America/Sao_Paulo | Not Windows | 13.0 |
| 1 | America/Sao_Paulo | Windows | 20.0 |
| 2 | Europe/Madrid | Not Windows | 16.0 |
| 3 | Europe/Madrid | Windows | 19.0 |
| 4 | Pacific/Honolulu | Not Windows | 0.0 |
| 5 | Pacific/Honolulu | Windows | 36.0 |
| 6 | Asia/Tokyo | Not Windows | 2.0 |
| 7 | Asia/Tokyo | Windows | 35.0 |
| 8 | Europe/London | Not Windows | 43.0 |
| 9 | Europe/London | Windows | 31.0 |
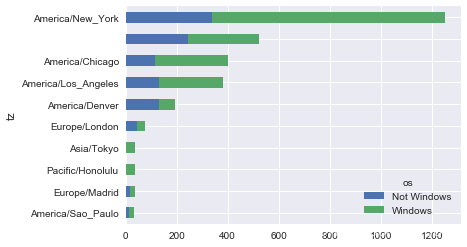
sns.barplot(x='total', y='tz', hue='os', data=count_subset)
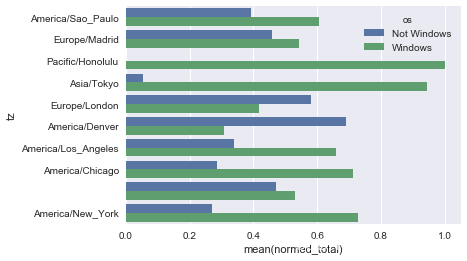
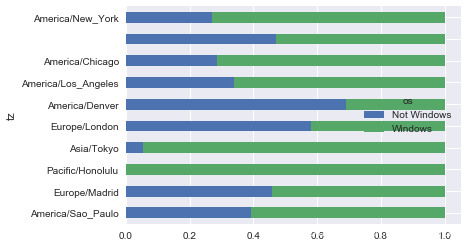
由于这张图中不太容易看清楚较小分组中windows用户的相对比例,因此我们可以将各行规范化为“总计为1”并重新绘图:
def norm_total(group):group['normed_total'] = group.total / group.total.sum()return groupresults = count_subset.groupby('tz').apply(norm_total)
sns.barplot(x='normed_total', y='tz', hue='os', data=results)
我们还可以使用transform和groupby,来更有效率地计算规范化的和:
g = count_subset.groupby('tz')
results2 = count_subset.total / g.total.transform('sum')
译者:下面的内容是不适用seaborn的画图方法,这种画法是2013年第一版中的内容:
count_subset = agg_counts.take(indexer)[-10:]
count_subset
| os | Not Windows | Windows |
|---|---|---|
| tz | ||
| America/Sao_Paulo | 13.0 | 20.0 |
| Europe/Madrid | 16.0 | 19.0 |
| Pacific/Honolulu | 0.0 | 36.0 |
| Asia/Tokyo | 2.0 | 35.0 |
| Europe/London | 43.0 | 31.0 |
| America/Denver | 132.0 | 59.0 |
| America/Los_Angeles | 130.0 | 252.0 |
| America/Chicago | 115.0 | 285.0 |
| 245.0 | 276.0 | |
| America/New_York | 339.0 | 912.0 |
这里也可以生成一张条形图。我们使用stacked=True来生成一张堆积条形图:
count_subset.plot(kind='barh', stacked=True)
由于这张图中不太容易看清楚较小分组中windows用户的相对比例,因此我们可以将各行规范化为“总计为1”并重新绘图:
normed_subset = count_subset.div(count_subset.sum(1), axis=0)
normed_subset.plot(kind='barh', stacked=True)
相关文章:
pandas教程:时区计数 USA.gov Data from Bitly USA.gov数据集
文章目录 Chapter 14 Data Analysis Examples(数据分析实例)14.1 USA.gov Data from Bitly(USA.gov数据集)1 Counting Time Zones in Pure Python(用纯python代码对时区进行计数)2 Counting Time Zones wit…...

野火霸天虎 STM32F407 学习笔记(六)系统时钟详解
STM32 中级 前言 仍然是学习自野火F407网课。 启动文件详解 作用: 初始化堆栈指针 SP_initial_sp初始化 PC 指针 Reset_Handler初始化中断向量表配置系统时钟调用 C 库函数 _main 初始化用户堆栈,从而最终调用 main 函数去到 C 的世界 栈ÿ…...
)
uni-app+vue3 封装全局函数(详细完整的方法)
在uni-app和vue3中,我们可以封装全局函数来复用代码。以下是详细的步骤: 首先,我们需要在main.js文件中引入我们封装的全局函数。这样我们就可以在整个项目中使用这些函数。 import globalFunctions from ./globalFunctionsVue.prototype.$g…...

游戏开发原画的设计方法
游戏原画设计是游戏开发中至关重要的一环,因为它直接影响到游戏的视觉吸引力和用户体验。以下是一些常见的游戏原画设计方法,希望对大家有所帮助。北京木奇移动技术有限公司,专业的软件外包开发公司,欢迎交流合作。 理解游戏概念&…...

力扣labuladong一刷day19天花式遍历
力扣labuladong一刷day19天花式遍历 文章目录 力扣labuladong一刷day19天花式遍历一、48. 旋转图像二、54. 螺旋矩阵三、59. 螺旋矩阵 II 一、48. 旋转图像 题目链接:https://leetcode.cn/problems/rotate-image/ 思路:把矩阵向右旋转90度,要…...
自动化部署 扩容openGauss —— Ansible for openGauss
前言 大家好,今天我们为大家推荐一套基于Ansible开发的,自动化部署及扩容openGauss的脚本工具:Ansible for openGauss(以下简称 AFO)。 通过AFO,我们只需简单修改一些配置文件,即可快速部署多种…...

C#多线程创建及线程的同步
需求:有时为了能分时的调用多个任务运行,因此需要考虑多线程的编程方式 操作步骤如下: 1)创建线程并开启线程 Thread thread0 new Thread(() > DoWork0(0)); thread0.Start(); 2)编写线程函数 static void Do…...

MOM系统功能清单
什么是MOM系统? MOM系统是制造运营管理(Manufacturing Operation Management)的缩写。它是指通过协调管理企业的人员、设备、物料和能源等资源,把原材料或零件转化为产品的活动。MOM系统集成了生产计划、库存管理、生产调度、质量…...

ARM Cortex-M核的内核态,用户态
首先,用户态和内核态是从操作系统层面上来划分的,如果没有操作系统,我可以直接运行在特权模式下,并使用特权指令。在这种情况下,我将负责管理和控制系统资源,执行关键操作,以及确保系统的安全性…...
flex布局实战之自动填充剩余
案例目标 文字部分自适应并且居中 图中是一个弹窗,我现在使用flex的布局来实现,标题和关闭按钮。因为是uni-app,所以标签是view 。你可以自行替换为 代码 <view class"popup-box"><view class"title"><view class&…...

【LeetCode】203. 移除链表元素
203. 移除链表元素 难度:简单 题目 给你一个链表的头节点 head 和一个整数 val ,请你删除链表中所有满足 Node.val val 的节点,并返回 新的头节点 。 示例 1: 输入:head [1,2,6,3,4,5,6], val 6 输出ÿ…...
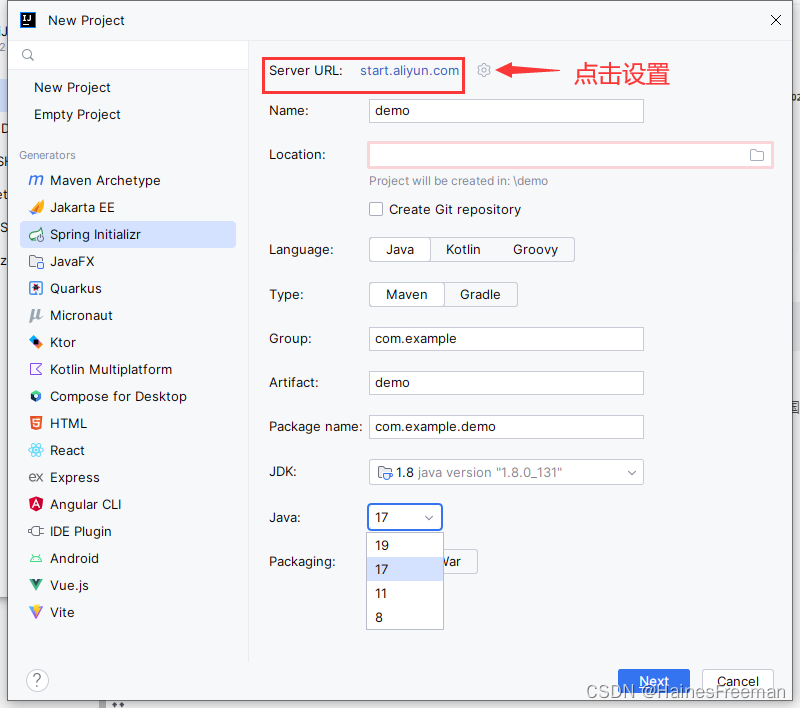
IDEA2023版本创建Sping项目只能勾选17和21,却无法使用Java8?(已解决)
方案:替换创建项目的源 我们只知道IDEA页面创建Spring项目,其实是访问spring initializr去创建项目。故我们可以通过阿里云国服去间接创建Spring项目。将https://start.spring.io/或者http://start.springboot.io/替换为 https://start.aliyun.com/...

Vue生命周期详解
以下是 Vue 生命周期钩子函数分别做了什么事情的详细说明 详细说明 beforeCreate(创建前):在实例初始化之前调用。此时,实例的数据观测 (data observer)、属性和方法的运算,以及事件配置等内部设置都已完成࿰…...
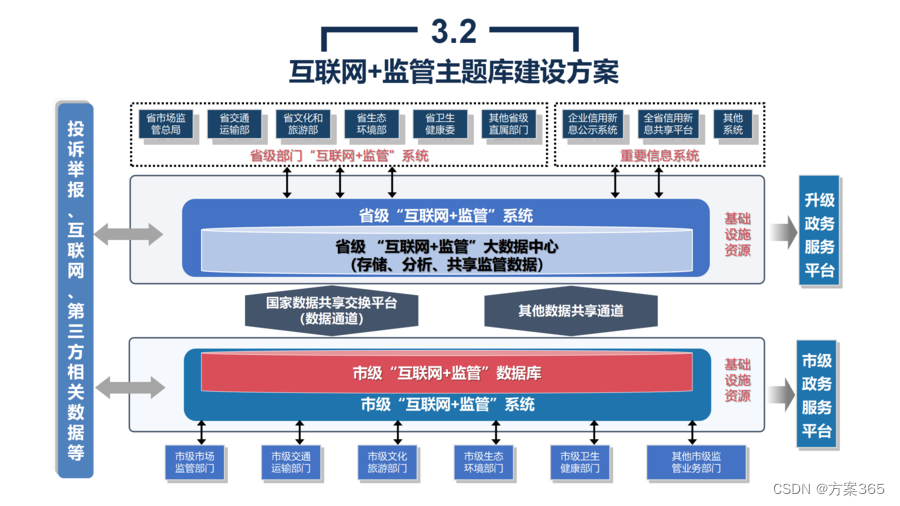
政务大数据与资源平台建设解决方案:PPT全文75页,附下载
关键词:智慧政务解决方案,大数据解决方案,数据中心解决方案,数据治理解决方案 一、政务大数据与资源平台建设背景 1、政务大数据已成为智慧城市建设的必要基础 为响应国家不断加快5G基建、大数据、人工智能等新型基础设施建设布…...

环境监测传感器守护我们的地球
随着人类活动的不断增加,环境问题日益凸显。为了更好地保护我们的地球,环境监测成为了一项非常重要的任务。而在这个领域,传感器技术发挥着至关重要的作用。今天,我们就来聊聊WX-WQX12 环境监测传感器。 环境监测传感器是一种能够…...

PHP 循环控制 学习资料
PHP 循环控制 在 PHP 中,循环控制语句用于控制循环的执行流程,包括跳出循环、跳过当前迭代等操作。以下是 PHP 中常用的循环控制语句的介绍和示例: break 语句 break 语句用于立即跳出当前循环,并继续执行循环之后的代码。 示…...
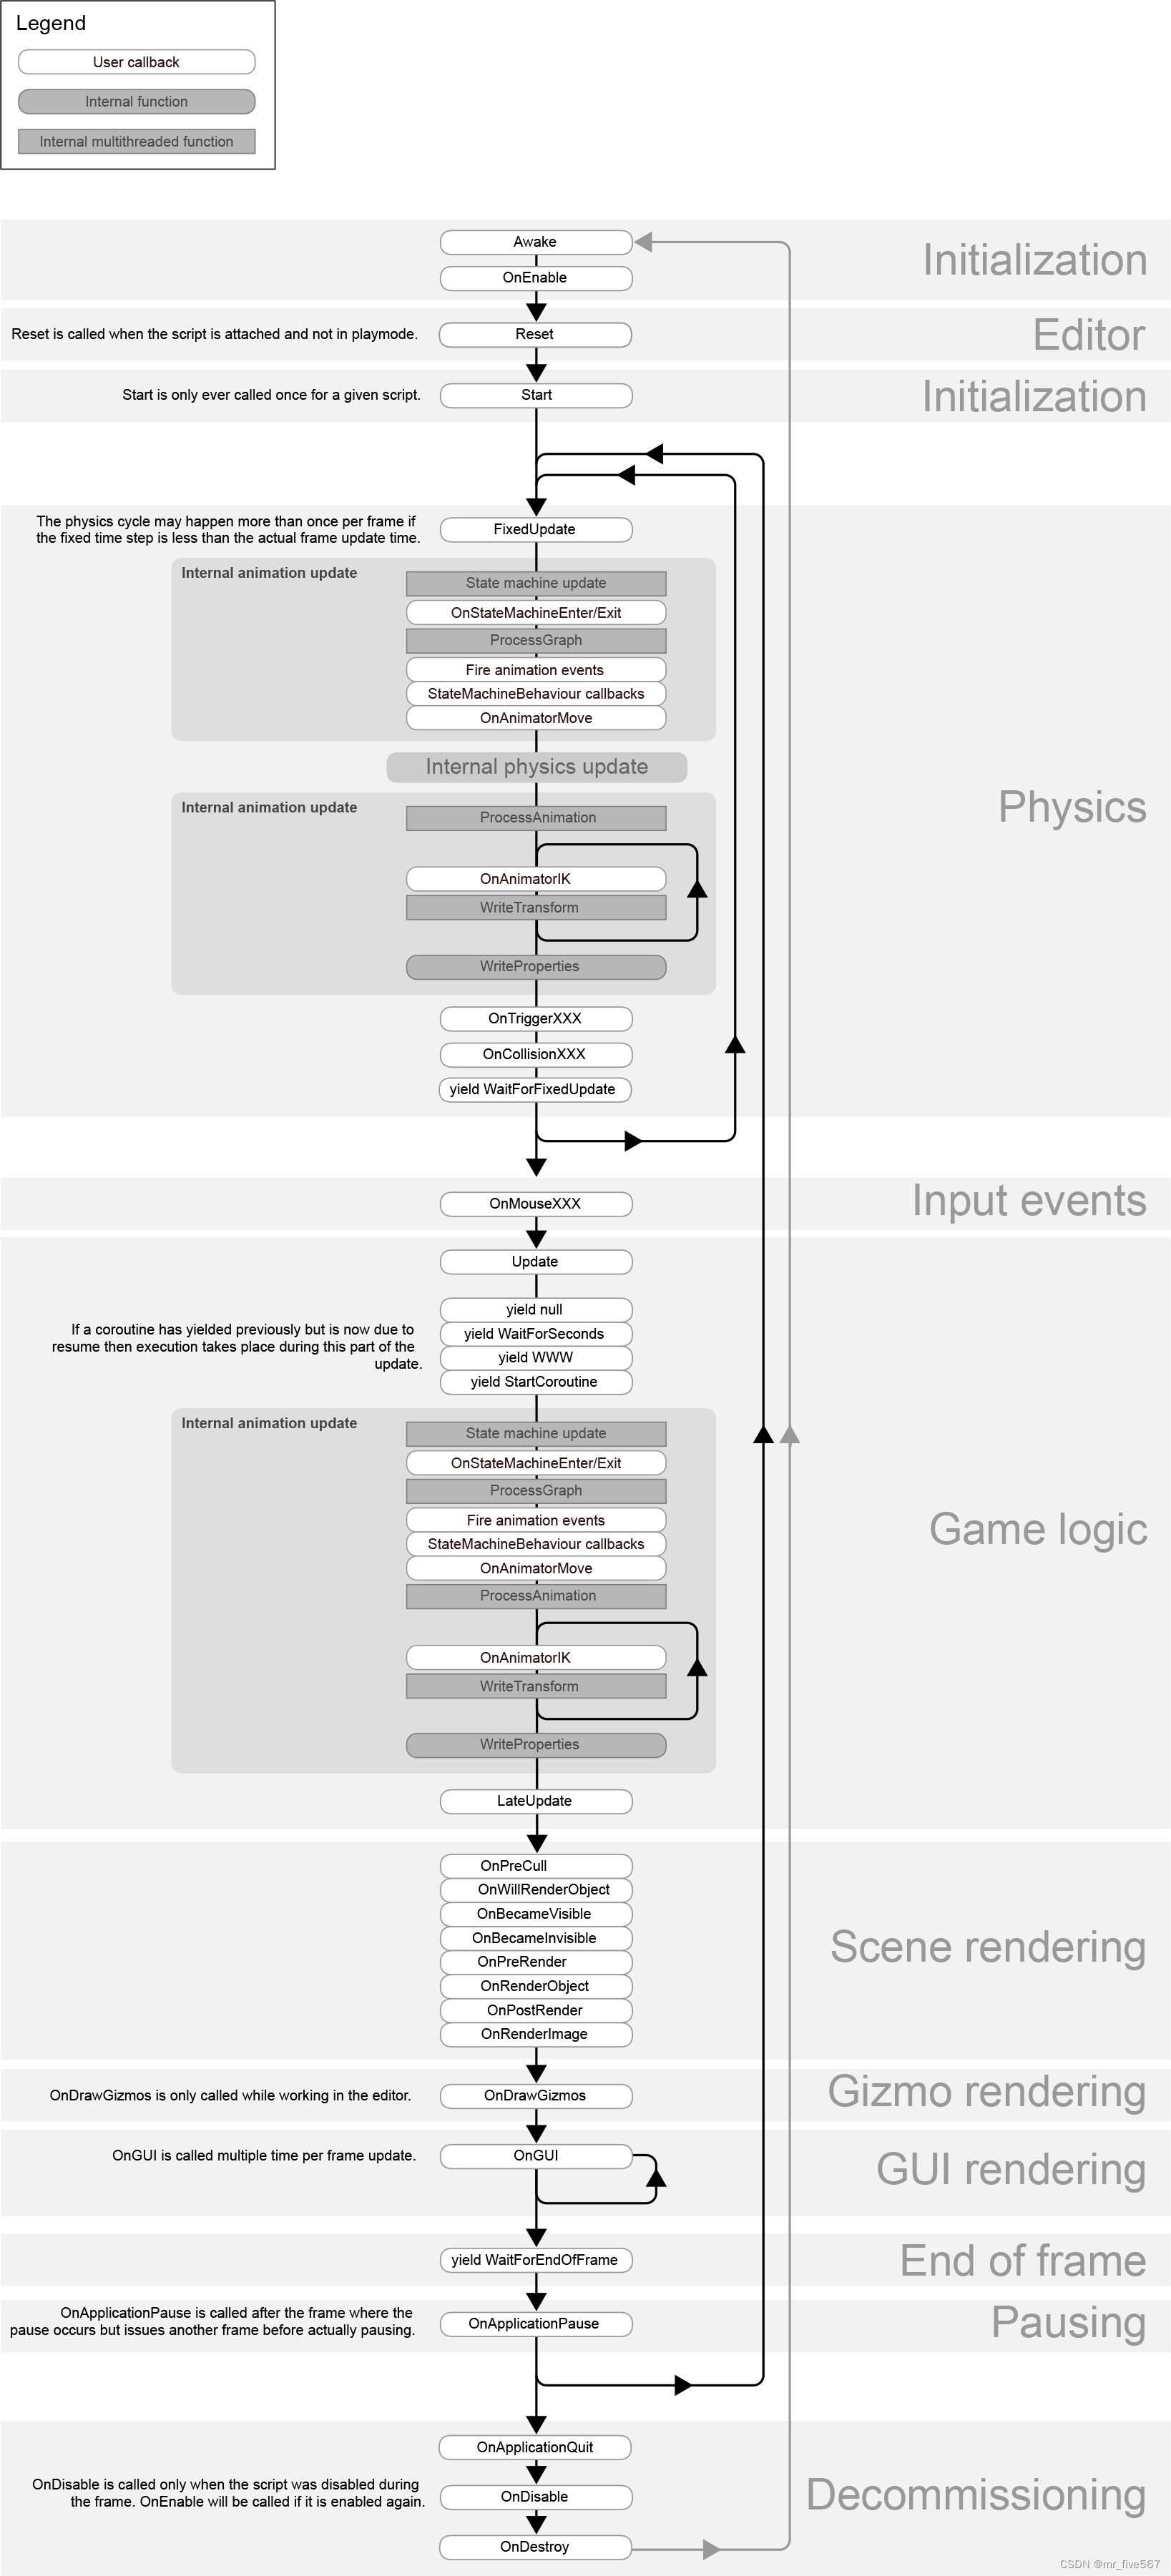
Unity 关于生命周期函数的一些认识
Unity 生命周期函数主要有以下一些: Awake(): 在脚本被加载时调用。用于初始化对象的状态和引用。 OnEnable(): 在脚本组件被启用时调用。在脚本组件被激活时执行一次,以及在脚本组件被重新激活时执行。 Reset(): 在脚本组件被重置时调用。用于重置脚本…...
-spark核心总结)
大数据学习(26)-spark核心总结
&&大数据学习&& 🔥系列专栏: 👑哲学语录: 承认自己的无知,乃是开启智慧的大门 💖如果觉得博主的文章还不错的话,请点赞👍收藏⭐️留言📝支持一下博主哦ᾑ…...
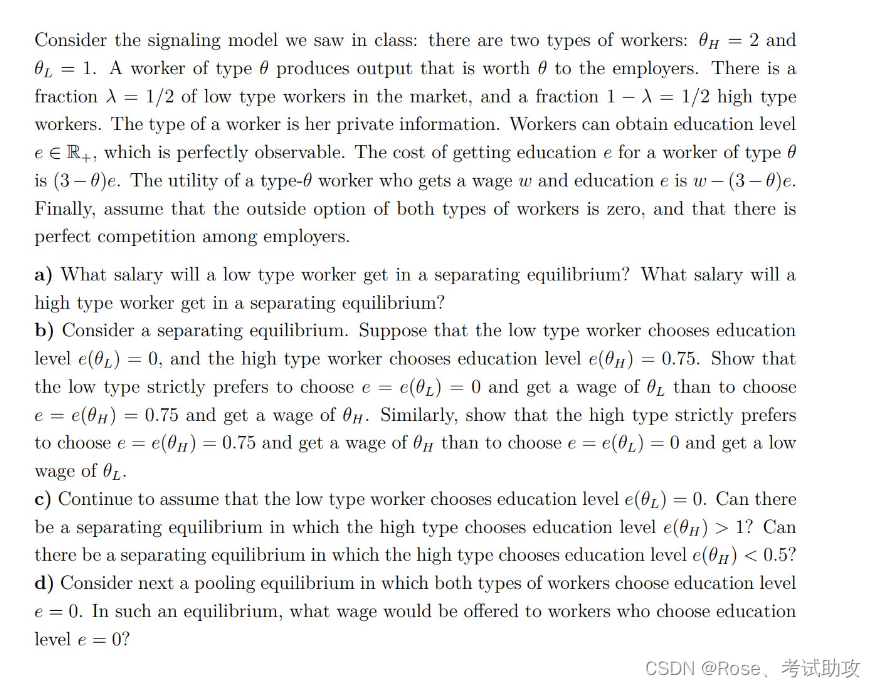
EC 404 information economics
EC 404 information economics WeChat: zh6-86...

基于单片机的烟雾检测报警装置(论文+源码)
1.系统设计 (1)利用传感器实现环境中温度、烟雾浓度的实时检测; (2)系统检测的各项数据信息通过液晶模块进行显示,提高设计可视化; (3)系统可以根据实际情况利用按键模…...

【CP-05】RTE运行时环境 - SWC的操作系统接口
CP-05_RTE运行时环境【CP-05】RTE运行时环境 - SWC的“操作系统接口”前言在AUTOSAR架构中,RTE(Runtime Environment,运行时环境)是一个常被提及却难以理解的概念。它像是应用层软件组件(SW-C)与底层基础软…...

Vue3 图片标框功能实现方案
基于 Vue3 组合式 API 的图片标框(画框、标注、选框)完整实现,核心逻辑封装在 GetBoxes 组件里,复制就能用 一、功能说明 ✅ 在图片上鼠标拖拽画矩形框 ✅ 实时显示框坐标(x, y, width, height) ✅ 支持多…...
)
ThinkPad开机报错0183/0253?别慌,手把手教你搞定EFI变量错误(附BIOS重置教程)
ThinkPad开机报错0183/0253?EFI变量错误全面解决方案当你按下ThinkPad的电源键,期待熟悉的开机画面时,屏幕上却突然跳出一串神秘代码——"0183: Bad CRC of Security Settings in EFI Variable"或"0253: EFI Variable Block D…...

Veo 2胶片质感生成器失效?——深度解析Color Science v2.3内核中被屏蔽的Cinematic Grain Injection层
更多请点击: https://kaifayun.com 第一章:Veo 2胶片质感生成器失效现象全景透视 近期大量用户反馈,Veo 2 胶片质感生成器在调用 generate_film_effect() 接口后返回空纹理、纯灰帧或 HTTP 503 Service Unavailable 错误,且该问题…...

INT8量化下TVA注意力对齐精度保障方案
重磅预告:本专栏将独家连载系列丛书《智能体视觉技术与应用》部分精华内容,该书是世界首套系统阐述“因式智能体”视觉理论与实践的专著,特邀美国 TypeOne 公司首席科学家、斯坦福大学博士 Bohan 担任技术顾问。Bohan先生师从美国三院院士、“…...

Unity项目DrawCall降不下来?试试用Mesh Baker合并贴图集,保姆级图文教程
Unity性能优化实战:用Mesh Baker合并贴图集降低DrawCall全流程解析当你的Unity项目帧率开始卡顿,Profiler里DrawCall数字居高不下时,合并贴图集往往是解决问题的关键一步。本文将以一个实际项目为例,带你从零开始使用Mesh Baker的…...

Keil µVision反汇编窗口内容导出方案与调试技巧
1. 问题背景与需求解析在嵌入式开发过程中,调试环节往往占据大量时间。Keil Vision作为业界广泛使用的集成开发环境(IDE),其调试器功能强大但某些细节功能仍有提升空间。最近我在使用C251架构开发汽车电子控制单元时,就遇到了一个看似简单却影…...

别再手动维护接口文档了!用Spring Boot 3和Swagger 3实现代码与文档的自动同步
Spring Boot 3与Swagger 3:构建零维护成本的API文档工作流 每次接口变更都要手动更新文档?团队成员总是抱怨文档与实际接口不一致?在敏捷开发时代,传统文档维护方式已成为拖累工程效率的典型痛点。本文将揭示如何通过Spring Boot …...

claude code用户如何迁移到taotoken解决封号与token不足问题
🚀 告别海外账号与网络限制!稳定直连全球优质大模型,限时半价接入中。 👉 点击领取海量免费额度 Claude Code 用户如何迁移到 Taotoken 解决封号与 Token 不足问题 应用场景类,针对 Claude Code 用户常遇封号与 Token…...

3步快速部署:智能茅台抢购平台的终极自动化解决方案
3步快速部署:智能茅台抢购平台的终极自动化解决方案 【免费下载链接】campus-imaotai i茅台app自动预约,每日自动预约,支持docker一键部署(本项目不提供成品,使用的是已淘汰的算法) 项目地址: https://gi…...