【Excel】【VBA】Reaction超限点筛选与散点图可视化
【Excel】【VBA】Reaction超限点筛选与散点图可视化

功能概述
这段代码实现了以下功能:
- 从SAFE输出的结果worksheet通过datalink获取更新数据
- 从指定工作表中读取数据
- 检测超过阈值的数据点
- 生成结果表格并添加格式化
- 创建可视化散点图
- 显示执行时间
流程图
关键方法详解
1. 性能优化技巧
Application.ScreenUpdating = False
Application.Calculation = xlCalculationManual
- 禁用屏幕更新和自动计算,提高执行效率
- 完成后需要恢复这些设置
2. 数组操作
dataArray = .Range(.Cells(1, 1), .Cells(lastRow, 10)).Value
ReDim Preserve results(1 To 10, 1 To itemCount)
- 使用数组批量读取数据,比逐单元格读取更快
ReDim Preserve允许动态调整数组大小同时保留现有数据
3. 错误处理
On Error Resume Next
' 代码块
On Error GoTo 0
- 使用错误处理确保代码稳定性
- 可以优雅地处理工作表不存在等异常情况
4. 条件格式化
formatRange.FormatConditions.AddDatabar
With formatRange.FormatConditions(1).BarFillType = xlDataBarFillSolid.BarColor.Color = RGB(255, 0, 0)
End With
- 添加数据条来可视化超限比率
- 使用RGB颜色定义来设置格式
5. 图表创建
Set chtObj = wsResult.ChartObjects.Add(...)
With chtObj.Chart.ChartType = xlXYScatter.SeriesCollection.NewSeries' 设置数据源和格式
End With
- 使用ChartObjects创建图表对象
- 设置图表类型、数据源和格式化选项
6. 数据标签
With .DataLabels.ShowValue = False.Format.TextFrame2.TextRange.Font.Size = 8For pt = 1 To .Count.Item(pt).Text = Format(wsResult.Cells(pt + 1, "M").Value, "0.00%")Next pt
End With
- 为散点添加自定义数据标签
- 使用Format函数格式化百分比显示
学习要点
-
数据处理效率
- 使用数组批量处理数据
- 禁用不必要的Excel功能提升性能
-
代码结构
- 使用With语句块简化代码
- 合理组织代码逻辑,提高可读性
-
错误处理
- 在关键操作处添加错误处理
- 确保程序稳定运行
-
Excel对象模型
- 理解工作表、单元格范围的操作
- 掌握图表对象的创建和设置
-
可视化技巧
- 条件格式化的应用
- 散点图的创建和自定义
实用技巧
- 使用常量定义关键值
Const THRESHOLD_VALUE As Double = 1739
- 计时功能实现
startTime = Timer
executionTime = Format(Timer - startTime, "0.00")
- 动态范围处理
lastRow = .Cells(.Rows.Count, "G").End(xlUp).Row
V20250121
Sub FindExceedingValues()Dim wsSource As Worksheet, wsCoord As Worksheet, wsResult As WorksheetDim lastRow As LongDim i As Long, itemCount As LongDim dataArray() As VariantDim results() As VariantDim startTime As DoubleConst THRESHOLD_VALUE As Double = 1739 '设置阈值变量,方便修改Dim chtObj As ChartObjectApplication.ScreenUpdating = FalseApplication.Calculation = xlCalculationManualstartTime = Timer'Set up worksheetsSet wsSource = ThisWorkbook.Worksheets("Nodal Reactions")Set wsCoord = ThisWorkbook.Worksheets("Obj Geom - Point Coordinates")'Create or clear result worksheetOn Error Resume NextSet wsResult = ThisWorkbook.Worksheets("04.Over Points List")If wsResult Is Nothing ThenSet wsResult = ThisWorkbook.Worksheets.Add(After:=ThisWorkbook.Sheets(ThisWorkbook.Sheets.Count))wsResult.Name = "04.Over Points List"End IfOn Error GoTo 0wsResult.Cells.Clear'Get last row of source dataWith wsSourcelastRow = .Cells(.Rows.Count, "G").End(xlUp).Row'Read all data at oncedataArray = .Range(.Cells(1, 1), .Cells(lastRow, 10)).Value'Initialize results arrayitemCount = 0ReDim results(1 To 10, 1 To 1)'Process data arrayFor i = 2 To UBound(dataArray, 1)If IsNumeric(dataArray(i, 7)) ThenIf Abs(dataArray(i, 7)) > THRESHOLD_VALUE ThenitemCount = itemCount + 1ReDim Preserve results(1 To 10, 1 To itemCount)'Store all columnsFor j = 1 To 10results(j, itemCount) = dataArray(i, j)Next jEnd IfEnd IfNext iEnd With'Write resultsWith wsResult'Write headers.Range("A1:J1") = Array("Node", "Point", "OutputCase", "CaseType", "Fx", "Fy", "Fz", "Mx", "My", "Mz").Range("K1") = "X Coordinate".Range("L1") = "Y Coordinate".Range("M1") = "Exceeding Ratio" '新增列标题'Write data if any foundIf itemCount > 0 Then'Write main dataFor i = 1 To itemCountFor j = 1 To 10.Cells(i + 1, j) = results(j, i)Next jNext i'Add VLOOKUP formulas.Range("K2").Formula = "=VLOOKUP($B2,'Obj Geom - Point Coordinates'!$A:$C,2,FALSE)".Range("L2").Formula = "=VLOOKUP($B2,'Obj Geom - Point Coordinates'!$A:$C,3,FALSE)"'添加比值计算公式.Range("M2").Formula = "=ABS(G2)/" & THRESHOLD_VALUE & "-1"'Fill down formulas if more than one rowIf itemCount > 1 Then.Range("K2:M2").AutoFill Destination:=.Range("K2:M" & itemCount + 1)End If'Format the worksheetWith .Range("A1:M1").Font.Bold = True.Interior.Color = RGB(200, 200, 200)End WithWith .Range("A1:M" & itemCount + 1).Borders.LineStyle = xlContinuous.Columns.AutoFitEnd With.Range("A:D").NumberFormat = "@".Range("M:M").NumberFormat = "0.00%" '设置比值列为百分比格式'添加数据条条件格式Dim formatRange As RangeSet formatRange = .Range("M2:M" & itemCount + 1)formatRange.FormatConditions.DeleteformatRange.FormatConditions.AddDatabarWith formatRange.FormatConditions(1).BarFillType = xlDataBarFillSolid.BarColor.Color = RGB(255, 0, 0) 'Red color.ShowValue = TrueEnd With'删除现有图表(如果存在)On Error Resume NextwsResult.ChartObjects.DeleteOn Error GoTo 0'创建散点图Set chtObj = wsResult.ChartObjects.Add( _Left:=.Range("O1").Left, _Top:=.Range("O1").Top, _Width:=800, _Height:=600)With chtObj.Chart.ChartType = xlXYScatter'添加数据系列.SeriesCollection.NewSeriesWith .SeriesCollection(1).XValues = wsResult.Range("K2:K" & itemCount + 1).Values = wsResult.Range("L2:L" & itemCount + 1).MarkerStyle = xlMarkerStyleCircle.MarkerSize = 8.Format.Fill.ForeColor.RGB = RGB(255, 0, 0)'为每个点添加数据标签.HasDataLabels = TrueWith .DataLabels.ShowValue = False.ShowCategoryName = False.ShowSeriesName = False.Format.TextFrame2.TextRange.Font.Size = 8'设置每个点的数据标签为对应的M列值On Error Resume Next  '添加错误处理Dim pt As IntegerFor pt = 1 To .Count.Item(pt).Text = Format(wsResult.Cells(pt + 1, "M").Value, "0.00%")Next ptOn Error GoTo 0End WithEnd With'设置图表标题和轴标题.HasTitle = True.ChartTitle.Text = "Distribution of Exceeding Points"With .Axes(xlCategory, xlPrimary).HasTitle = True.AxisTitle.Text = "X Coordinate"End WithWith .Axes(xlValue, xlPrimary).HasTitle = True.AxisTitle.Text = "Y Coordinate"End With'添加图例.HasLegend = FalseEnd WithEnd IfEnd With'Restore settingsApplication.ScreenUpdating = TrueApplication.Calculation = xlCalculationAutomatic'Show completion messageDim executionTime As StringexecutionTime = Format(Timer - startTime, "0.00")If itemCount = 0 ThenMsgBox "No values exceeding " & THRESHOLD_VALUE & " were found in Column Fz." & vbNewLine & _"Execution time: " & executionTime & " seconds", vbInformationElseMsgBox itemCount & " values exceeding " & THRESHOLD_VALUE & " were found and listed." & vbNewLine & _"Execution time: " & executionTime & " seconds", vbInformationEnd If
End Sub
V20250122 add lower point list (for reduncancy reference)

Sub FindExceedingValues()Dim wsSource As Worksheet, wsCoord As Worksheet, wsResult As Worksheet, wsResultLow As WorksheetDim lastRow As LongDim i As Long, itemCount As Long, itemCountLow As LongDim dataArray() As VariantDim results() As Variant, resultsLow() As VariantDim startTime As DoubleConst THRESHOLD_VALUE_HIGH As Double = 1850 '上限阈值Const THRESHOLD_VALUE_LOW As Double = 1000  '下限阈值Dim chtObj As ChartObjectApplication.ScreenUpdating = FalseApplication.Calculation = xlCalculationManualstartTime = Timer'Set up worksheetsSet wsSource = ThisWorkbook.Worksheets("Nodal Reactions")Set wsCoord = ThisWorkbook.Worksheets("Obj Geom - Point Coordinates")'Create or clear result worksheetsOn Error Resume NextSet wsResult = ThisWorkbook.Worksheets("04.Over Points List")Set wsResultLow = ThisWorkbook.Worksheets("05.Under Points List")If wsResult Is Nothing ThenSet wsResult = ThisWorkbook.Worksheets.Add(After:=ThisWorkbook.Sheets(ThisWorkbook.Sheets.Count))wsResult.Name = "04.Over Points List"End IfIf wsResultLow Is Nothing ThenSet wsResultLow = ThisWorkbook.Worksheets.Add(After:=wsResult)wsResultLow.Name = "05.Lower Points List"End IfOn Error GoTo 0wsResult.Cells.ClearwsResultLow.Cells.Clear'Get last row of source dataWith wsSourcelastRow = .Cells(.Rows.Count, "G").End(xlUp).Row'Read all data at oncedataArray = .Range(.Cells(1, 1), .Cells(lastRow, 10)).Value'Initialize results arraysitemCount = 0itemCountLow = 0ReDim results(1 To 10, 1 To 1)ReDim resultsLow(1 To 10, 1 To 1)'Process data arrayFor i = 2 To UBound(dataArray, 1)If IsNumeric(dataArray(i, 7)) ThenIf Abs(dataArray(i, 7)) > THRESHOLD_VALUE_HIGH ThenitemCount = itemCount + 1ReDim Preserve results(1 To 10, 1 To itemCount)'Store all columns for high valuesFor j = 1 To 10results(j, itemCount) = dataArray(i, j)Next jElseIf Abs(dataArray(i, 7)) < THRESHOLD_VALUE_LOW ThenitemCountLow = itemCountLow + 1ReDim Preserve resultsLow(1 To 10, 1 To itemCountLow)'Store all columns for low valuesFor j = 1 To 10resultsLow(j, itemCountLow) = dataArray(i, j)Next jEnd IfEnd IfNext iEnd With'处理超过上限的数据ProcessWorksheet wsResult, results, itemCount, THRESHOLD_VALUE_HIGH, "Over"'处理低于下限的数据ProcessWorksheet wsResultLow, resultsLow, itemCountLow, THRESHOLD_VALUE_LOW, "Under"'Restore settingsApplication.ScreenUpdating = TrueApplication.Calculation = xlCalculationAutomatic'Show completion messageDim executionTime As StringexecutionTime = Format(Timer - startTime, "0.00")MsgBox "Found " & itemCount & " values exceeding " & THRESHOLD_VALUE_HIGH & vbNewLine & _"Found " & itemCountLow & " values below " & THRESHOLD_VALUE_LOW & vbNewLine & _"Execution time: " & executionTime & " seconds", vbInformation
End SubSub ProcessWorksheet(ws As Worksheet, results() As Variant, itemCount As Long, thresholdValue As Double, sheetType As String)Dim chtObj As ChartObjectDim j As LongWith ws'Write headers.Range("A1:J1") = Array("Node", "Point", "OutputCase", "CaseType", "Fx", "Fy", "Fz", "Mx", "My", "Mz").Range("K1") = "X Coordinate".Range("L1") = "Y Coordinate".Range("M1") = "Ratio" '新增列标题If itemCount > 0 Then'Write main dataFor i = 1 To itemCountFor j = 1 To 10.Cells(i + 1, j) = results(j, i)Next jNext i'Add VLOOKUP formulas.Range("K2").Formula = "=VLOOKUP($B2,'Obj Geom - Point Coordinates'!$A:$C,2,FALSE)".Range("L2").Formula = "=VLOOKUP($B2,'Obj Geom - Point Coordinates'!$A:$C,3,FALSE)"'添加比值计算公式If sheetType = "Over" Then.Range("M2").Formula = "=ABS(G2)/" & thresholdValue & "-1"Else.Range("M2").Formula = "=1-ABS(G2)/" & thresholdValueEnd If'Fill down formulas if more than one rowIf itemCount > 1 Then.Range("K2:M2").AutoFill Destination:=.Range("K2:M" & itemCount + 1)End If'Format the worksheetWith .Range("A1:M1").Font.Bold = True.Interior.Color = RGB(200, 200, 200)End WithWith .Range("A1:M" & itemCount + 1).Borders.LineStyle = xlContinuous.Columns.AutoFitEnd With.Range("A:D").NumberFormat = "@".Range("M:M").NumberFormat = "0.00%"'添加数据条条件格式Dim formatRange As RangeSet formatRange = .Range("M2:M" & itemCount + 1)formatRange.FormatConditions.DeleteformatRange.FormatConditions.AddDatabarWith formatRange.FormatConditions(1).BarFillType = xlDataBarFillSolidIf sheetType = "Over" Then.BarColor.Color = RGB(255, 0, 0) 'Red for over valuesElse.BarColor.Color = RGB(0, 0, 255) 'Blue for under valuesEnd If.ShowValue = TrueEnd With'删除现有图表(如果存在)On Error Resume Nextws.ChartObjects.DeleteOn Error GoTo 0'创建散点图Set chtObj = ws.ChartObjects.Add( _Left:=.Range("O1").Left, _Top:=.Range("O1").Top, _Width:=800, _Height:=600)With chtObj.Chart.ChartType = xlXYScatter'添加数据系列.SeriesCollection.NewSeriesWith .SeriesCollection(1).XValues = ws.Range("K2:K" & itemCount + 1).Values = ws.Range("L2:L" & itemCount + 1).MarkerStyle = xlMarkerStyleCircle.MarkerSize = 8If sheetType = "Over" Then.Format.Fill.ForeColor.RGB = RGB(255, 0, 0)Else.Format.Fill.ForeColor.RGB = RGB(0, 0, 255)End If'为每个点添加数据标签.HasDataLabels = TrueWith .DataLabels.ShowValue = False.ShowCategoryName = False.ShowSeriesName = False.Format.TextFrame2.TextRange.Font.Size = 8On Error Resume NextDim pt As IntegerFor pt = 1 To .Count.Item(pt).Text = Format(ws.Cells(pt + 1, "M").Value, "0.00%")Next ptOn Error GoTo 0End WithEnd With'设置图表标题和轴标题.HasTitle = TrueIf sheetType = "Over" Then.ChartTitle.Text = "Distribution of Exceeding Points"Else.ChartTitle.Text = "Distribution of Lower Points"End IfWith .Axes(xlCategory, xlPrimary).HasTitle = True.AxisTitle.Text = "X Coordinate"End WithWith .Axes(xlValue, xlPrimary).HasTitle = True.AxisTitle.Text = "Y Coordinate"End With'添加图例.HasLegend = FalseEnd WithEnd IfEnd With
End Sub
相关文章:

【Excel】【VBA】Reaction超限点筛选与散点图可视化
【Excel】【VBA】Reaction超限点筛选与散点图可视化 功能概述 这段代码实现了以下功能: 从SAFE输出的结果worksheet通过datalink获取更新数据从指定工作表中读取数据检测超过阈值的数据点生成结果表格并添加格式化创建可视化散点图显示执行时间 流程图 #mermaid-…...

京华春梦,守岁这方烟火人间
文章目录 准备篇温度公共交通人流情况年货采购 文化体验传统庙会博物馆与展览烟花灯会祈福仪式民俗集市现代氛围其他活动 美食盛宴传统美食与特色小吃传统老字号京城新宠特色小吃街多元美食街 准备篇 温度 北京春节期间气温较低,室外通常在零下几度到零上几度之间…...

学Python的人…
学Python的人… 一、Python能干什么? 1.爬虫:前几年,深度学习还没发展起来的时候,书店里Python就和爬虫挂钩,因为Python写爬虫确实方便。 2.数据分析:Python有各种的数据分析库可以方便使用࿰…...

WebSocket 和 Socket 的区别
一、协议层次和工作方式 1.1 )Socket 1.1.1)Socket位于传输层,通常使用TCP或UDP协议 1.1.2)提供了一个通用的网络编程接口,允许应用程序通过它发送和接收数据 1.1.3)一般需要手动管理连接,错…...

学习ASP.NET Core的身份认证(基于JwtBearer的身份认证6)
重新创建WebApi项目,安装Microsoft.AspNetCore.Authentication.JwtBearer包,将之前JwtBearer测试项目中的初始化函数,jwt配置类、token生成类全部挪到项目中。 重新编写login函数,之前测试Cookie和Session认证时用的函数适合m…...

【SpringBoot】SpringBoot中分页插件(PageHelper)的使用
目录 1.分页概念 2.原生写法 3.PageHelper插件分页查询 3.1 介绍 3.2?使用 3.3 Page对象和PageInf对象 1.分页概念 用户查询的数据不可能一次性全部展示给用户(如果用户有一万条数据呢),而是分页展示给用户,这就是分页查询…...

【优选算法】4----盛最多水的容器
开始有点上强度了铁子们,这道算法题也是可以说很难理解的~ 想了好久才想明白~ ---------------------------------------begin--------------------------------------- 题目解析: 这一道题刚看题目,根本不知道在讲啥,但看到体积…...

EDI安全:2025年数据保护与隐私威胁应对策略
在数字化转型的浪潮中,电子数据交换(EDI)已成为企业间信息传递的核心基础设施。然而,随着数据规模的指数级增长和网络威胁的日益复杂化,EDI安全正面临前所未有的挑战。展望2025年,企业如何构建一套全面、高…...

代码随想录刷题day13|(链表篇)24.两两交换链表中的结点
目录 一、链表理论基础 二、思路及易错点 易错点 三、相关算法题目 四、错误代码分析 一、链表理论基础 代码随想录 (programmercarl.com) 二、思路及易错点 该题使用虚拟头结点正常进行模拟即可,有两个关键点,一是循环何时终止?终止…...

集群、分布式及微服务间的区别与联系
目录 单体架构介绍集群和分布式架构集群和分布式集群和分布式区别和联系 微服务架构的引入微服务带来的挑战 总结 单体架构介绍 早期很多创业公司或者传统企业会把业务的所有功能实现都打包在一个项目中,这种方式就称为单体架构 以我们都很熟悉的电商系统为例&…...

MySQL(4)多表查询
引言:为什么需要多表的查询? A:提高效率,多线进行。 高内聚、低耦合。 一、多表查询的条件 1、错误的多表查询: SELECT employee_id,department_name FROM employees,departments; SELECT employee_id,department…...

web前端3--css
注意(本文一切代码一律是在vscode中书写) 1、书写位置 1、行内样式 //<标签名 style"样式声明"> <p style"color: red;">666</p> 2、内嵌样式 1、style标签 里面写css代码 css与html之间分离 2、css属性:值…...

【Nacos】Nacos快速上手
Nacos快速上手 项目环境介绍一、服务注册/服务发现1.引入Spring Cloud Alibaba依赖2.引入Nacos相关的依赖3.引入Load Balance依赖4.配置Nacos的地址 二、修改远程调用代码三、测试四、启动多个服务,测试负载均衡五、可能出现的问题 项目环境介绍 请你确保你的服务器…...

C++otlv4连接sql serveer使用记录(注意点)
C使用otlv4在做插入时,有一些设计的坑需要注意 插入数据: 当要给表中插入单个字符时,数据库表设计使用varchar(1)是合理的,但是otlv4一直报错char。 后续查很久才知道,otlv4所写的绑定的字符数组的长度应该实际数组…...

在Linux中,如何查询已安装软件包的版本信息?
在Linux中,查询已安装软件包的版本信息可以使用多种方法,具体取决于你使用的Linux发行版及其所采用的包管理器。 RPM-based Linux系统(如Red Hat、CentOS、Dedora) 使用rpm命令查询所有已经安装的特定软件包及其版本:…...

搜广推实习面经四
字节跳动TAC 广告算法 一、回归任务的评价指标有哪些 1.均方误差(Mean Squared Error, MSE)/均方根误差(Root Mean Squared Error, RMSE) M S E 1 n ∑ i 1 n ( y i − y ^ i ) 2 MSE \frac{1}{n} \sum_{i1}^{n} (y_i - \ha…...

【Elasticsearch】inference ingest pipeline
Elasticsearch 的 Ingest Pipeline 功能允许你在数据索引之前对其进行预处理。通过使用 Ingest Pipeline,你可以执行各种数据转换和富化操作,包括使用机器学习模型进行推理(inference)。这在处理词嵌入、情感分析、图像识别等场景…...

AQS公平锁与非公平锁之源码解析
AQS加锁逻辑 ReentrantLock.lock public void lock() {sync.acquire(1);}AbstractQueuedSynchronizer#acquire public final void acquire(int arg) {if (!tryAcquire(arg) &&acquireQueued(addWaiter(Node.EXCLUSIVE), arg))selfInterrupt();}addWaiter就是将节点加入…...

若依框架在企业中的应用调研
若依框架作为一款基于 Spring Boot 的轻量级 Java 快速开发框架,在企业级应用开发中发挥着重要作用。以下是对其在企业中应用的调研情况: 应用现状 广泛应用于多种管理系统:在众多企业中,若依框架常被用于构建各类后台管理系统&a…...

【Day23 LeetCode】贪心算法题
一、贪心算法 贪心没有套路,只有碰运气(bushi),举反例看看是否可行,(运气好)刚好贪心策略的局部最优就是全局最优。 1、分发饼干 455 思路:按照孩子的胃口从小到大的顺序依次满足…...
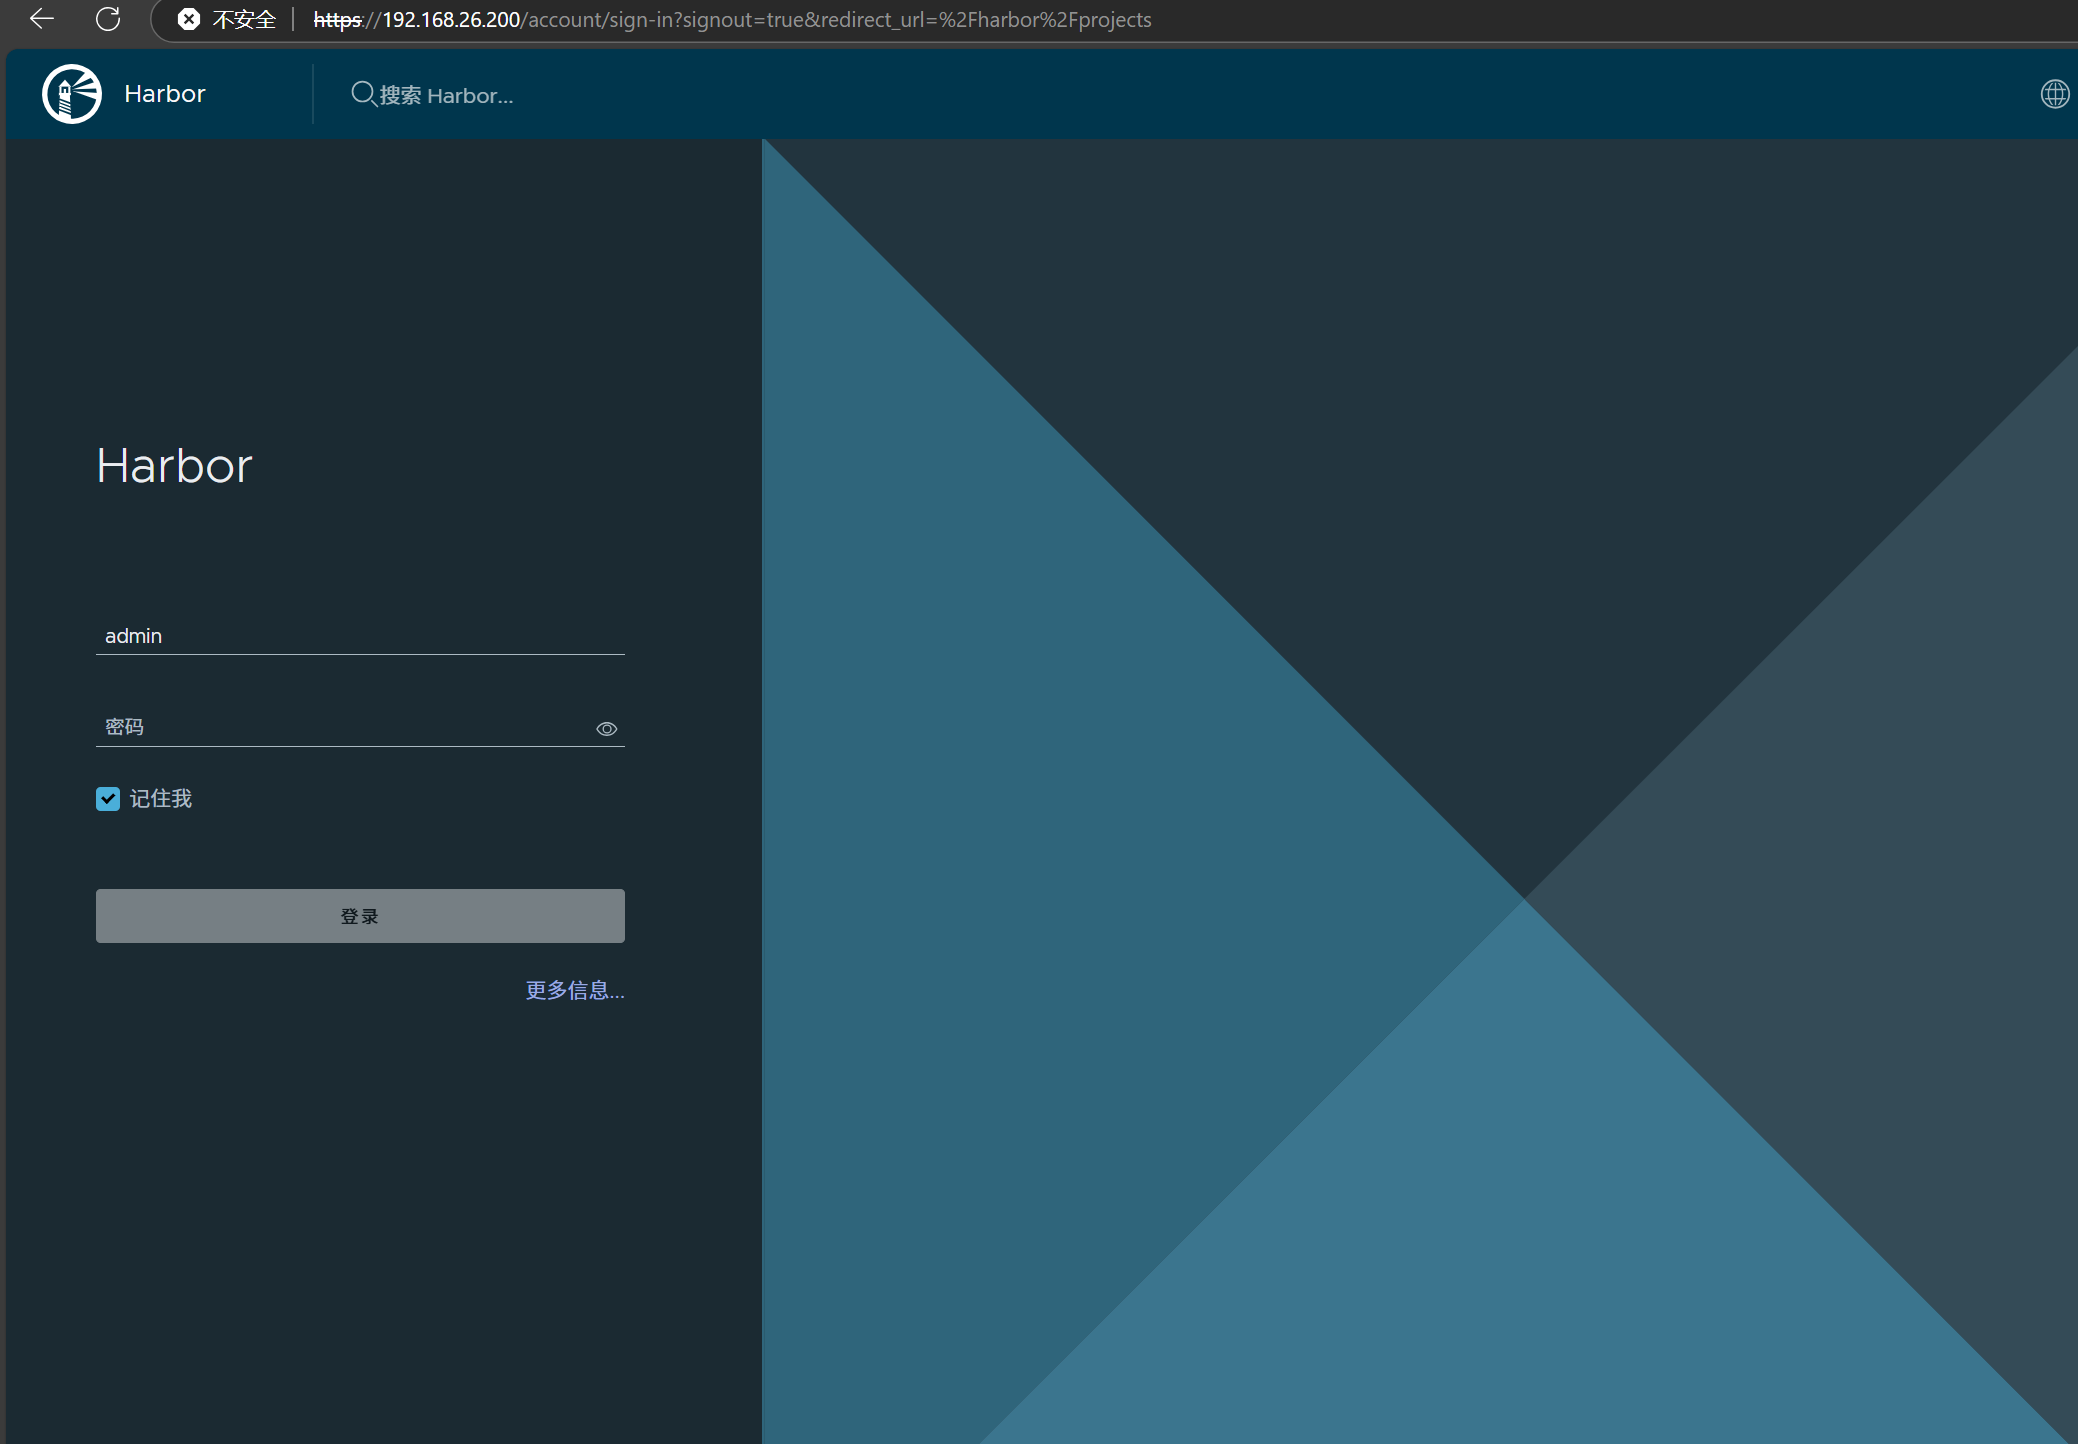
docker详细操作--未完待续
docker介绍 docker官网: Docker:加速容器应用程序开发 harbor官网:Harbor - Harbor 中文 使用docker加速器: Docker镜像极速下载服务 - 毫秒镜像 是什么 Docker 是一种开源的容器化平台,用于将应用程序及其依赖项(如库、运行时环…...

【OSG学习笔记】Day 16: 骨骼动画与蒙皮(osgAnimation)
骨骼动画基础 骨骼动画是 3D 计算机图形中常用的技术,它通过以下两个主要组件实现角色动画。 骨骼系统 (Skeleton):由层级结构的骨头组成,类似于人体骨骼蒙皮 (Mesh Skinning):将模型网格顶点绑定到骨骼上,使骨骼移动…...

CRMEB 框架中 PHP 上传扩展开发:涵盖本地上传及阿里云 OSS、腾讯云 COS、七牛云
目前已有本地上传、阿里云OSS上传、腾讯云COS上传、七牛云上传扩展 扩展入口文件 文件目录 crmeb\services\upload\Upload.php namespace crmeb\services\upload;use crmeb\basic\BaseManager; use think\facade\Config;/*** Class Upload* package crmeb\services\upload* …...

全面解析各类VPN技术:GRE、IPsec、L2TP、SSL与MPLS VPN对比
目录 引言 VPN技术概述 GRE VPN 3.1 GRE封装结构 3.2 GRE的应用场景 GRE over IPsec 4.1 GRE over IPsec封装结构 4.2 为什么使用GRE over IPsec? IPsec VPN 5.1 IPsec传输模式(Transport Mode) 5.2 IPsec隧道模式(Tunne…...
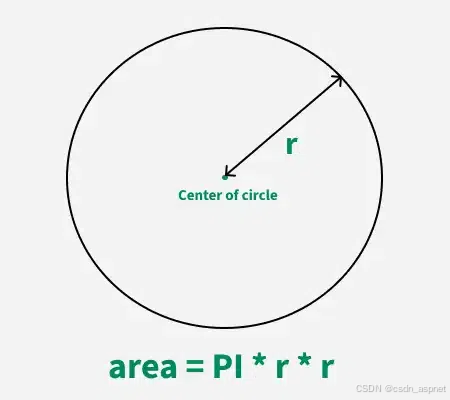
C# 求圆面积的程序(Program to find area of a circle)
给定半径r,求圆的面积。圆的面积应精确到小数点后5位。 例子: 输入:r 5 输出:78.53982 解释:由于面积 PI * r * r 3.14159265358979323846 * 5 * 5 78.53982,因为我们只保留小数点后 5 位数字。 输…...

学校时钟系统,标准考场时钟系统,AI亮相2025高考,赛思时钟系统为教育公平筑起“精准防线”
2025年#高考 将在近日拉开帷幕,#AI 监考一度冲上热搜。当AI深度融入高考,#时间同步 不再是辅助功能,而是决定AI监考系统成败的“生命线”。 AI亮相2025高考,40种异常行为0.5秒精准识别 2025年高考即将拉开帷幕,江西、…...
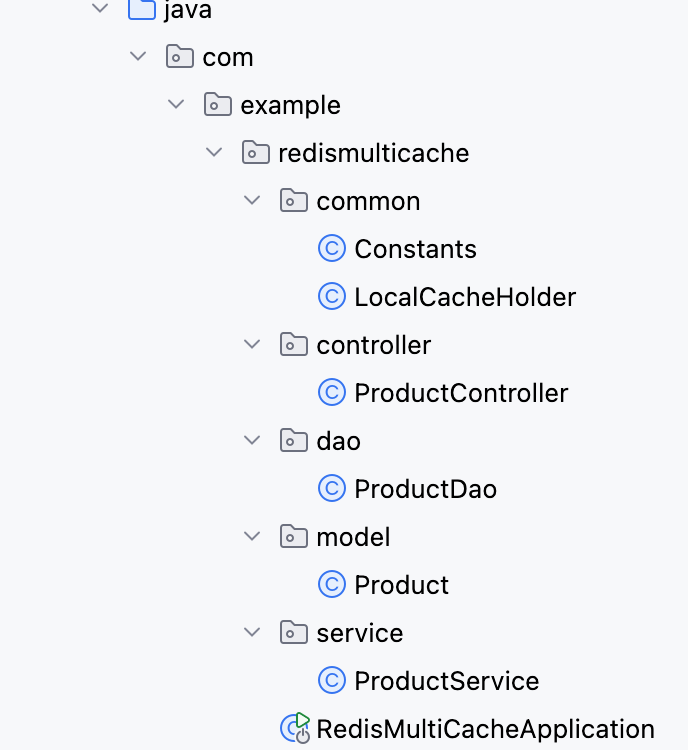
【Redis】笔记|第8节|大厂高并发缓存架构实战与优化
缓存架构 代码结构 代码详情 功能点: 多级缓存,先查本地缓存,再查Redis,最后才查数据库热点数据重建逻辑使用分布式锁,二次查询更新缓存采用读写锁提升性能采用Redis的发布订阅机制通知所有实例更新本地缓存适用读多…...
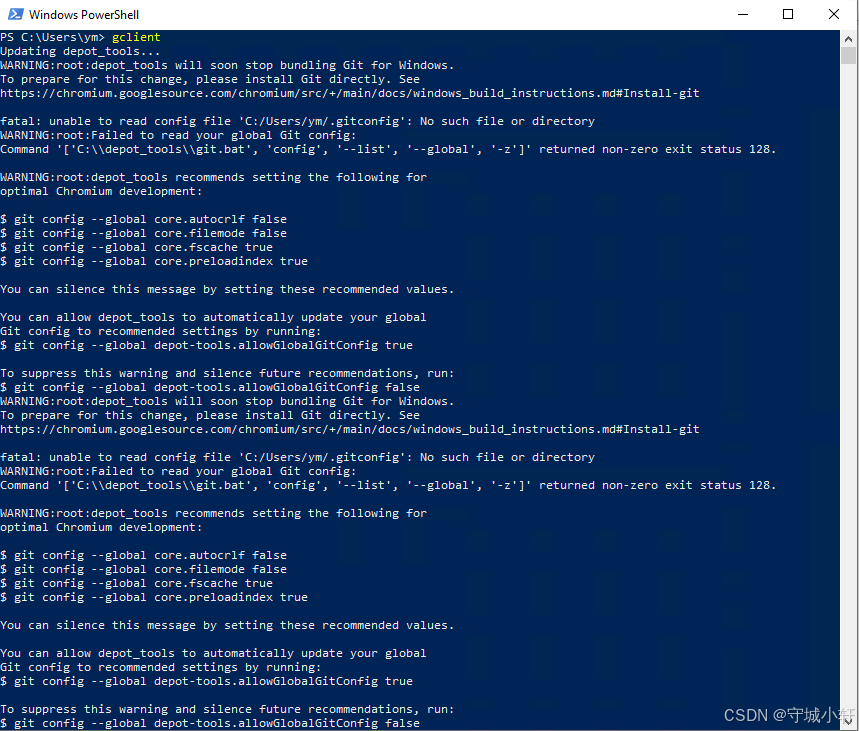
Chromium 136 编译指南 Windows篇:depot_tools 配置与源码获取(二)
引言 工欲善其事,必先利其器。在完成了 Visual Studio 2022 和 Windows SDK 的安装后,我们即将接触到 Chromium 开发生态中最核心的工具——depot_tools。这个由 Google 精心打造的工具集,就像是连接开发者与 Chromium 庞大代码库的智能桥梁…...
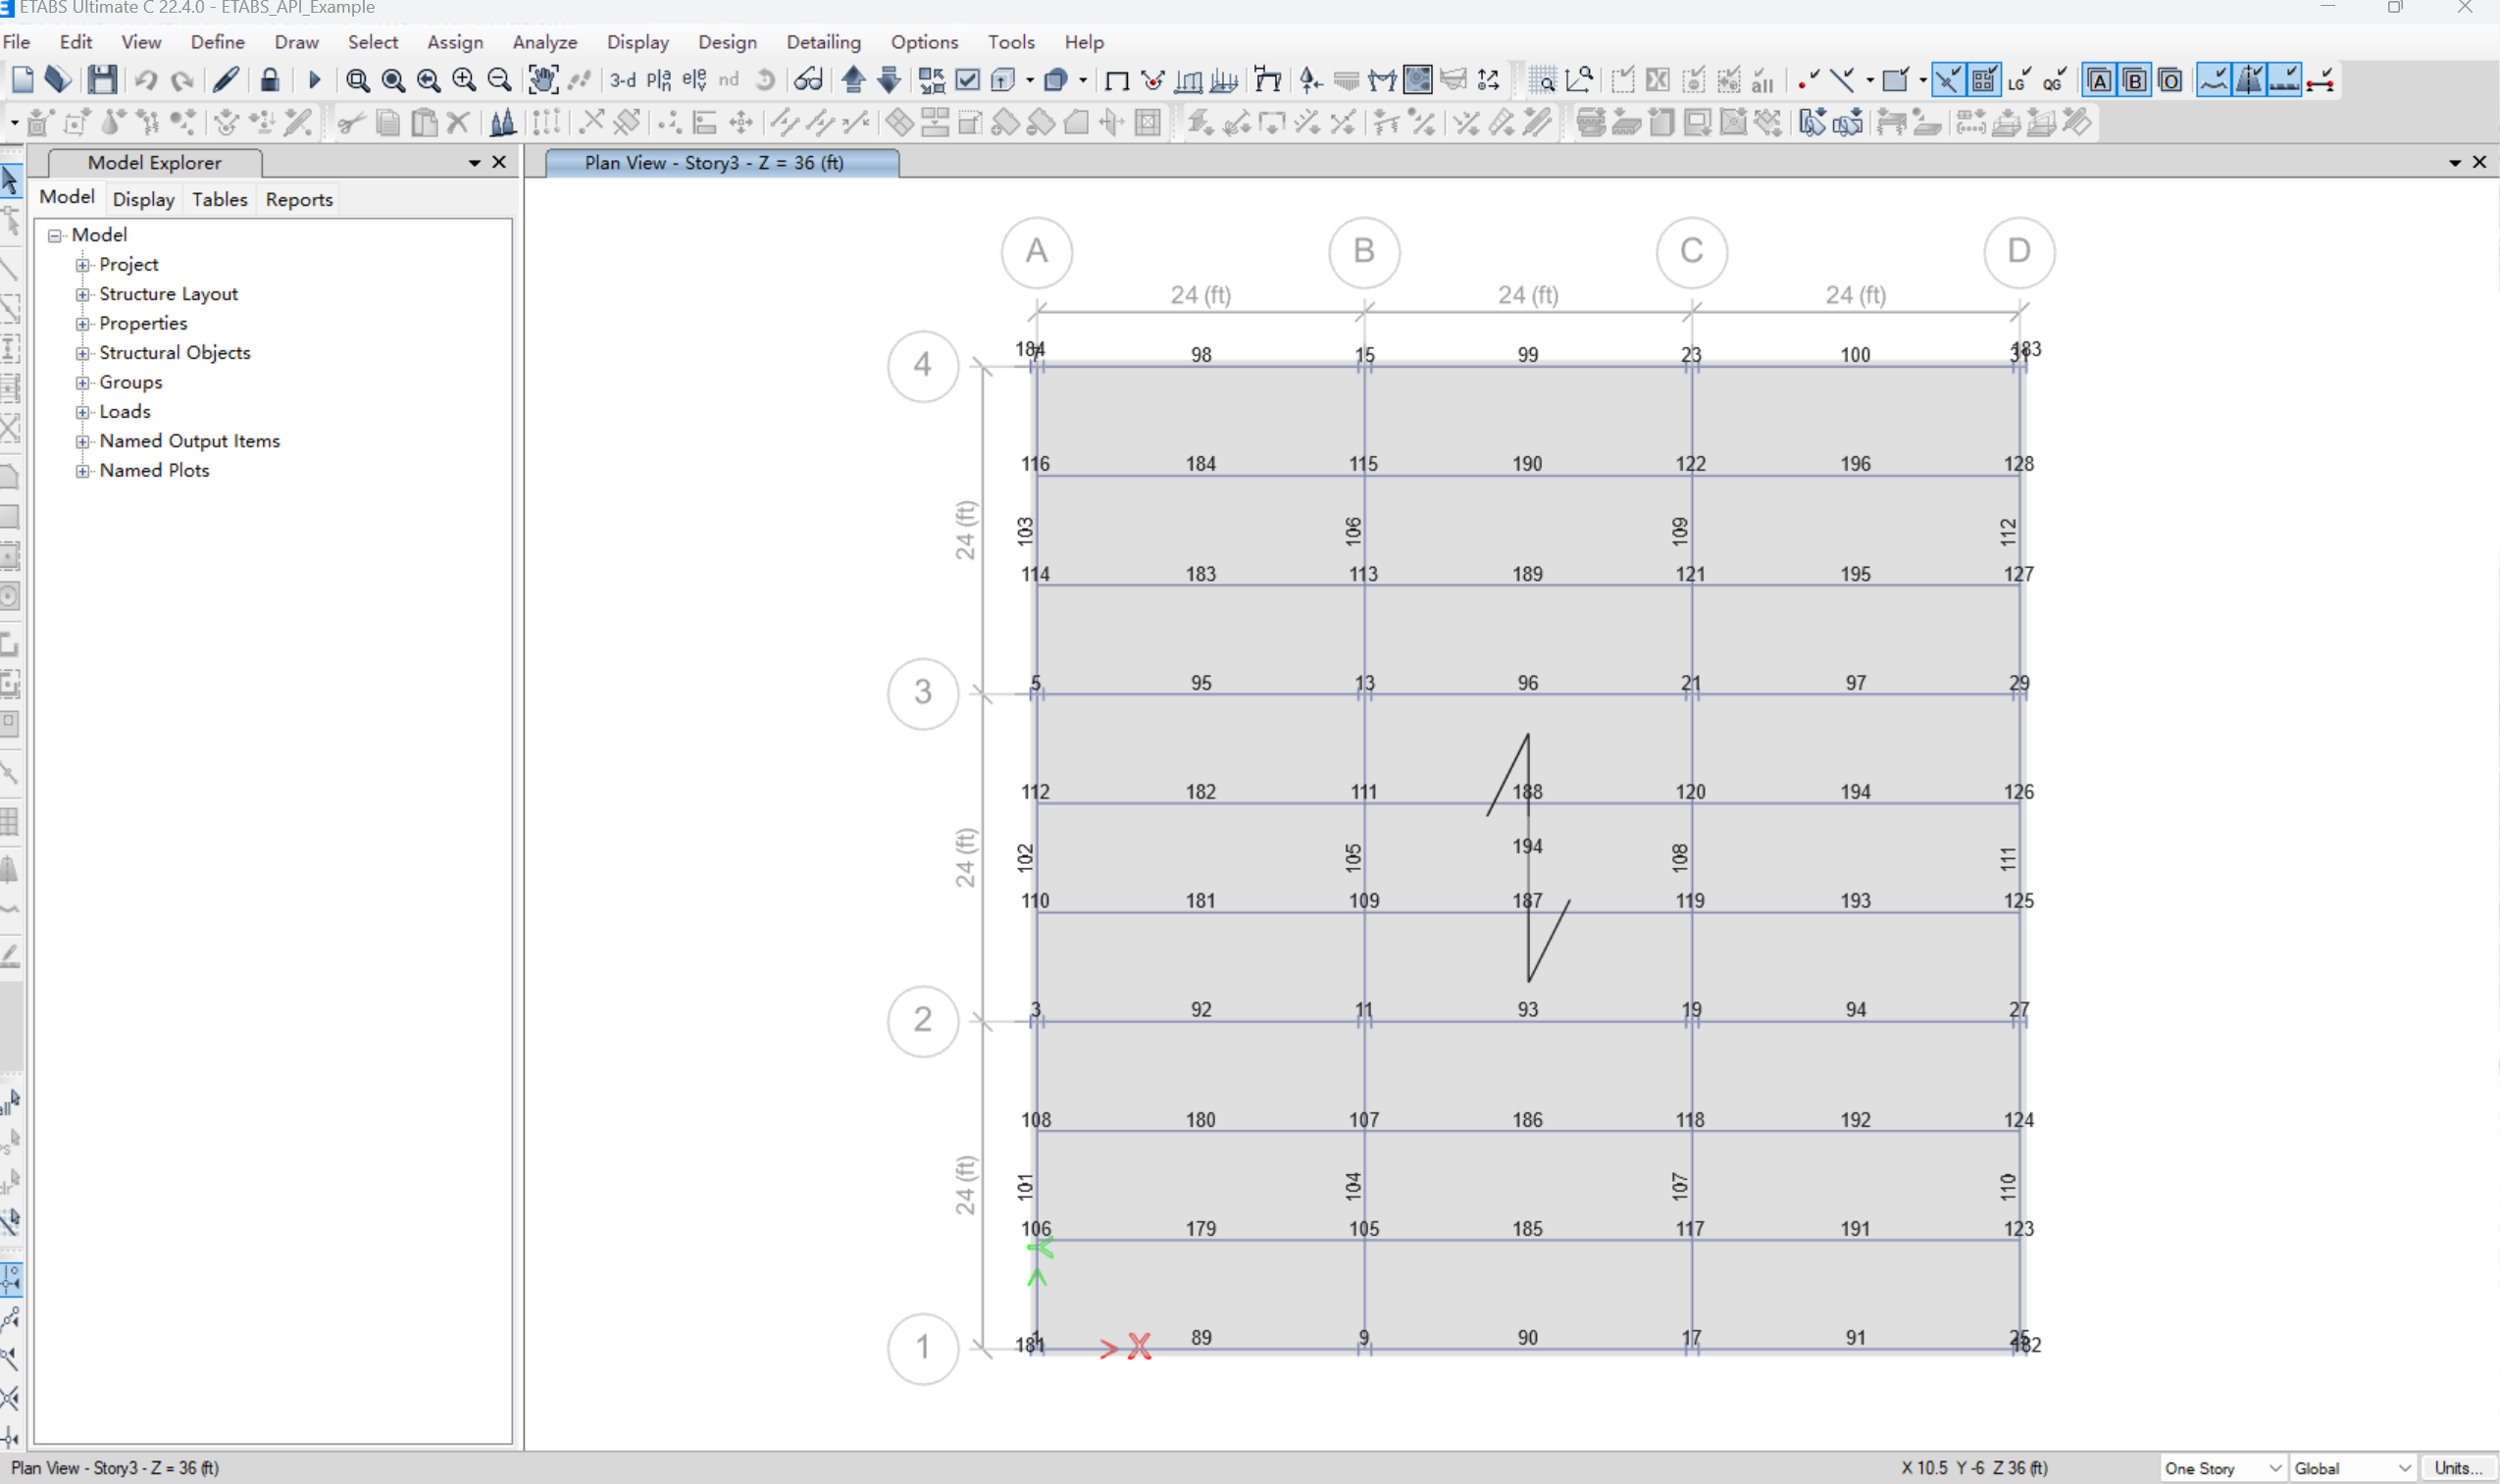
【Post-process】【VBA】ETABS VBA FrameObj.GetNameList and write to EXCEL
ETABS API实战:导出框架元素数据到Excel 在结构工程师的日常工作中,经常需要从ETABS模型中提取框架元素信息进行后续分析。手动复制粘贴不仅耗时,还容易出错。今天我们来用简单的VBA代码实现自动化导出。 🎯 我们要实现什么? 一键点击,就能将ETABS中所有框架元素的基…...
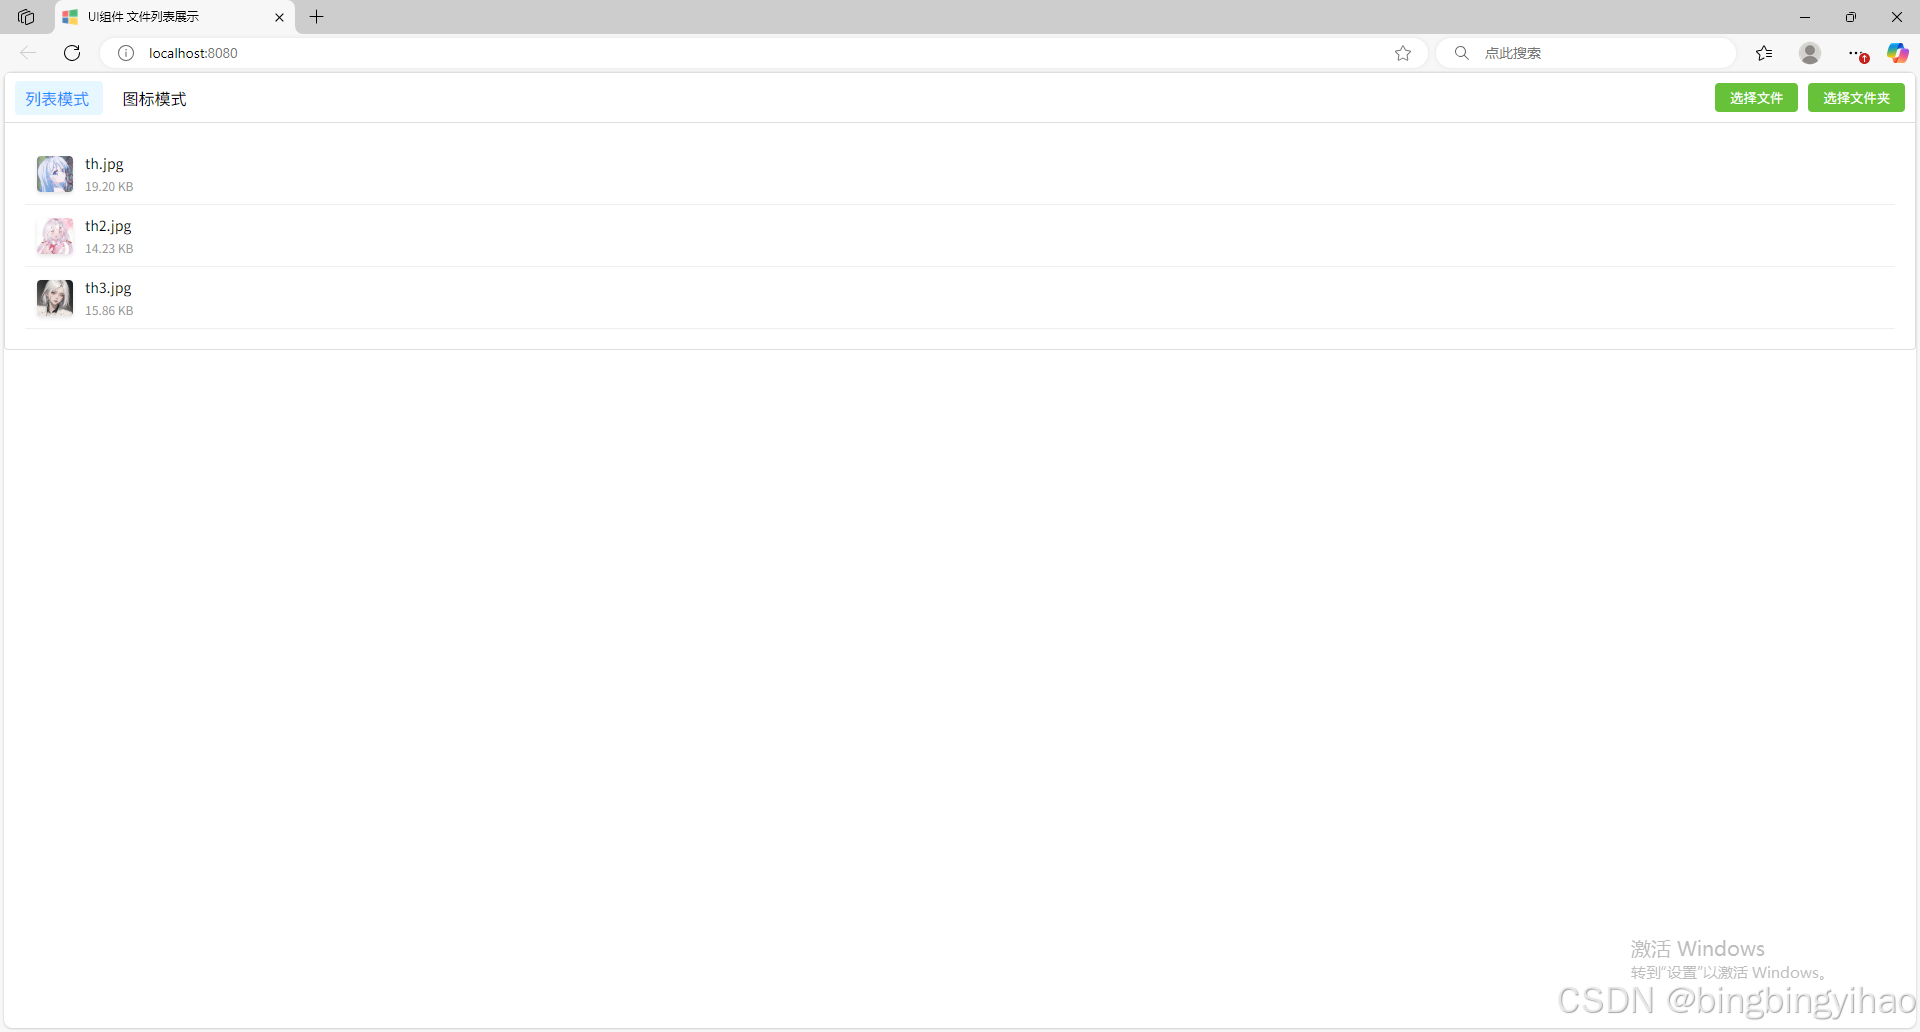
ui框架-文件列表展示
ui框架-文件列表展示 介绍 UI框架的文件列表展示组件,可以展示文件夹,支持列表展示和图标展示模式。组件提供了丰富的功能和可配置选项,适用于文件管理、文件上传等场景。 功能特性 支持列表模式和网格模式的切换展示支持文件和文件夹的层…...
