echarts饼图封装
1. 组件
<template>
<div
:id="id"
class="main"
:style="{ width: width, height: height }"
:ref="id"
></div>
</template>
<script>
import * as echarts from "echarts";
export default {
name: "roseChart",
data() {
return {
myEchart: null,
};
},
props: {
width: {
type: String,
default: "100%",
},
height: {
type: String,
default: "100%",
},
// 数据(数组)
typeAnalysisData: {
type: Array,
default: () => [],
},
id: {
type: String,
default: "roseChart",
},
// 是否显示提示(方框)
legendShow: {
type: Boolean,
default: true,
},
// 上面距离
legendTop: {
type: String,
default: "auto",
},
// 左面距离
legendLeft: {
type: String,
default: "auto",
},
// 排列方式
legendOrient: {
type: String,
default: "vertical",
},
// 字体颜色(方框)
legendColor: {
type: String,
default: "#8493c3",
},
// 字体大小(方框)
legendFontSize: {
type: String,
default: "16px",
},
titleFontSize: {
type: Number,
default: 34,
},
titleColor: {
type: String,
default: "#8493c3",
},
// 饼图的半径
radius: {
type: Array,
default: () => [],
},
// 文本标签
labelShow: {
type: Boolean,
default: true,
},
labelPosition: {
type: String,
default: "center",
},
// 文本字体大小
labelFontSize: {
type: Number,
default: 14,
},
// 文本字体行高
lineHeight: {
type: Number,
default: 15,
},
// 文本字体颜色
labelColor: {
type: String,
default: "#8493c3",
},
activeFontSize: {
type: Number,
default: 15,
},
activeColor: {
type: String,
default: "#8493c3",
},
// 中心
center: {
type: Array,
default: () => [],
},
// 标题
titleShow: {
type: Boolean,
default: true,
},
// 主标题
text: {
type: String,
default: "主标题",
},
// 副标题
subtext: {
type: String,
default: "副标题",
},
// 标题位置(上下)
titleTop: {
type: String,
default: "center",
},
// 标题位置(左右)
titleLeft: {
type: String,
default: "center",
},
},
methods: {
drawChart() {
let timer = null;
timer = setTimeout(() => {
if (
this.myEchart != null &&
this.myEchart != "" &&
this.myEchart != undefined
) {
this.myEchart.dispose(); //销毁
}
if (!this.$refs[this.id]) return;
this.myEchart = echarts.init(this.$refs[this.id]);
let option = {
title: {
show: this.titleShow,
// x: "44%", //X坐标
// y: "35%", //Y坐标
top: this.titleTop,
left: this.titleLeft,
text: this.text, //主标题
subtext: this.subtext, //副标题
textStyle: {
//标题样式
fontSize: 20,
fontWeight: "bolder",
color: "rgb(113, 116, 123)",
// formatter: "",
// marginTop: this.marginTop,
// marginLeft: this.marginLeft,
// transfrom: "translate(-50%,-50%)",
},
subtextStyle: {
//副标题样式
fontSize: 14,
fontWeight: "bolder",
color: "rgb(113, 116, 123)",
// transform: "translate(-50%,-50%)",
// marginTop: this.marginTop,
// marginLeft: this.marginLeft,
},
},
legend: {
show: this.legendShow,
orient: this.legendOrient,
top: this.legendTop,
left: this.legendLeft,
textStyle: {
color: this.legendColor,
fontSize: this.legendFontSize,
},
},
series: [
{
name: "Nightingale Chart",
type: "pie",
radius: this.radius,
center: this.center,
// roseType: "area",
itemStyle: {
normal: {
color: function (colors) {
var colorList = [
"rgb(250, 133, 133)",
"rgb(108, 200, 121)",
];
return colorList[colors.dataIndex];
},
borderRadius: 0,
},
},
label: {
show: this.labelShow,
alignTo: "edge",
formatter: "{name|{b}}\n{time|{d} %}",
minMargin: 5,
edgeDistance: 10,
lineHeight: this.lineHeight,
rich: {
time: {
fontSize: this.labelFontSize,
color: this.labelColor,
},
name: {
fontSize: this.labelFontSize,
color: this.labelColor,
},
},
},
labelLine: {
length: 15,
length2: 0,
maxSurfaceAngle: 80,
},
// label: {
// normal: {
// show: true,
// textStyle: {
// color: this.labelColor,
// fontSize: this.labelFontSize,
// },
// formatter: "{per|{d}%}",
// rich: {
// }
// },
// },
data: this.typeAnalysisData,
},
],
};
this.myEchart.setOption(option);
}, 500);
},
},
mounted() {
this.drawChart();
},
watch: {
typeAnalysisData: {
handler(newName, oldName) {
this.$nextTick(() => {
this.drawChart();
window.addEventListener("resize", this.drawChart);
});
},
deep: true,
},
},
destroyed() {
window.removeEventListener("resize", this.drawChart);
},
};
</script>
<style lang="scss" scoped>
</style>
2.内容
(1)标签
<rose-chart
:typeAnalysisData="dataList"
:color="color"
:labelShow="false"
:radius="radius"
:center="center"
legendLeft="right"
legendTop="middle"
></rose-chart>
(2)数据
// 饼状图
dataList: [
{ value: 1048, name: "异常设备" },
{ value: 735, name: "正常设备" },
],
color: ["#3c4a73", "#00a0e9", "#090", "#f00", "#f00"],
radius: ["50%", "60%"],
center: ["50%", "50%"],
相关文章:

echarts饼图封装
1. 组件 <template> <div :id"id" class"main" :style"{ width: width, height: height }" :ref"id" ></div> </template> <script> import * as echarts from "echarts"; export default { …...

Web3.0 教学基础一
目录 什么是web3.0 Web 1.0 概念 Web 2.0 概念 Web 3.0 概念 Web 3.0 的优势 什么是DAPP 什么是web3.0 在了解web3.0之前我们需要了解下前面的web1.0与web2.0。 Web 1.0 概念 Web1.0是万维网最初的版本,而静态网站则被认为是全网Web 1.0的起源,用…...

body使用渐变色无效的原因之一:html没有设置高度
直接在css文件中对body设置渐变色: body {height: 100%;background: -webkit-linear-gradient(120deg, #a1c4fd 0%, #c2e9fb 100%);background: -moz-linear-gradient(120deg, #a1c4fd 0%, #c2e9fb 100%);background: -o-linear-gradient(120deg, #a1c4fd 0%, #c2e…...
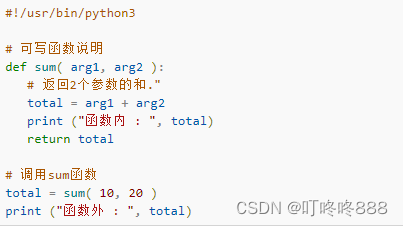
Python3 函数实例及演示
函数是组织好的,可重复使用的,用来实现单一,或相关联功能的代码段。 函数能提高应用的模块性,和代码的重复利用率。我们已经知道Python提供了许多内建函数,比如print()。但也可以自己创建函数,这被叫做用户…...
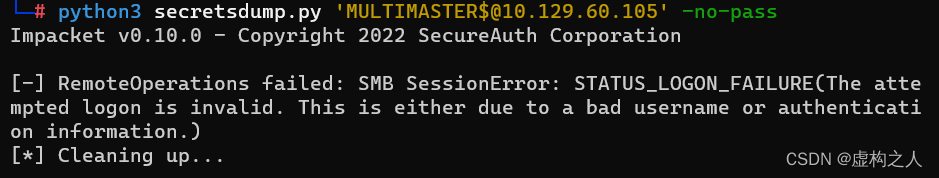
HTB打靶(Active Directory 101 Multimaster)
Nmap扫描 Starting Nmap 7.93 ( https://nmap.org ) at 2023-02-08 02:52 EST Stats: 0:00:51 elapsed; 0 hosts completed (1 up), 1 undergoing SYN Stealth Scan SYN Stealth Scan Timing: About 55.85% done; ETC: 02:54 (0:00:40 remaining) Nmap scan report for 10.129…...

漏洞预警|Apache Sling JCR Base 存在JNDI注入漏洞
棱镜七彩安全预警 近日网上有关于开源项目Apache Sling JCR Base 存在JNDI注入漏洞,棱镜七彩威胁情报团队第一时间探测到,经分析研判,向全社会发起开源漏洞预警公告,提醒相关安全团队及时响应。 项目介绍 Apache Sling是一个基于…...

【学习笔记】DFA的构造
虽然平时做过但是考场上肯定还是不会,不过没事干还是写一下吧 Myhill-Nerode\text{Myhill-Nerode}Myhill-Nerode 定理:给定一个语言LLL,定义在字符串上一个关系为,若对于所有的zzz,xzxzxz在LLL中当且仅当yzyzyz在LLL中…...
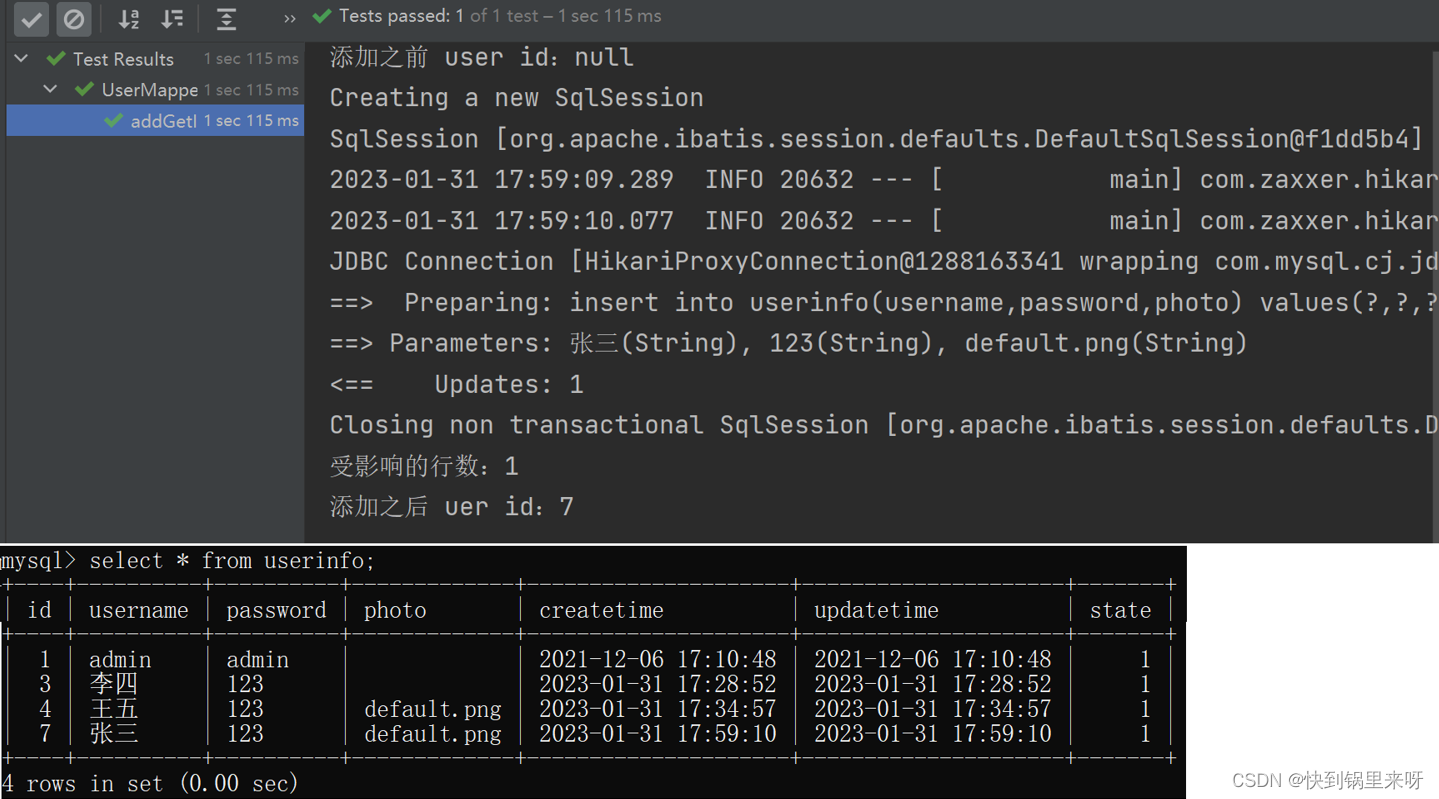
MyBatis 之二(增、删、改操作)
文章目录1. 修改操作1.1 在 mapper(interface)里面添加修改方法的声明1.2 在 XMl 中添加 <update> 标签和修改的 sql 代码1.3 在 UserMapper 中右键 Generate 点击 Test 生成 update 测试类2. 删除操作2.1 在 mapper (interface&#x…...

28k入职腾讯测试岗那天,我哭了,这5个月付出的一切总算没有白费~
先说一下自己的个人情况,计算机专业,16年普通二本学校毕业,经历过一些失败的工作经历后,经推荐就进入了华为的测试岗,进去才知道是接了个外包项目,不太稳定的样子,可是刚毕业谁知道什么外包不外…...
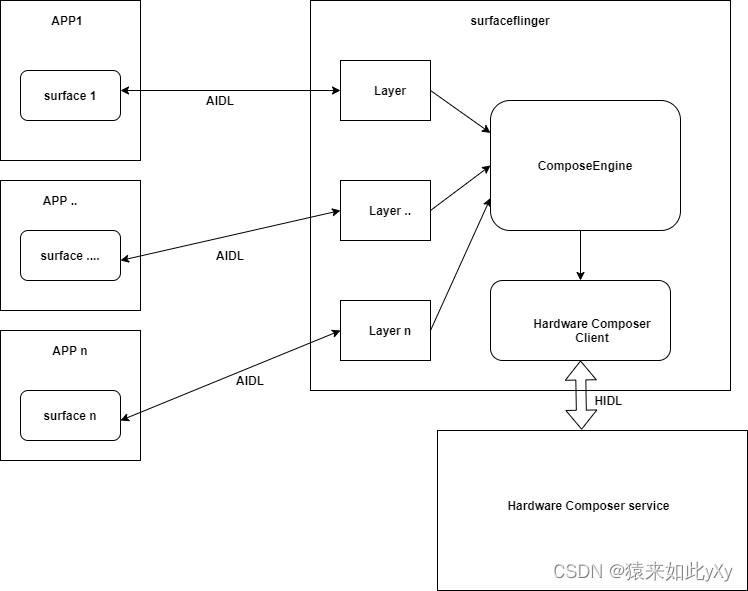
【surfaceflinger源码分析】surfaceflinger进程的消息驱动模型
概述 对于surfaceflinger大多数人都知道它的功能是做图形合成的,用英语表示就是指composite。其大致框图如下: 各个Android app将自己的图形画面通过surface为载体通过AIDL接口(Binder IPC)传递到surfaceflinger进程surfaceflinger进程中的composition engine与HW…...

「架构师」001计算机组成与体系结构
文章目录 前言一、计算机结构1.1 计算机组成结构1.2 CPU组成1.3 冯诺依曼结构与哈佛结构二、存储结构2.1 层次化存储结构2.2 Cache三、数据传输控制方式四、总线五、CISC与RISC六、流水线七、校验码八、嵌入式前言 本文主要介绍计算机组成与体系结构。 一、计算机结构 1.1 计…...
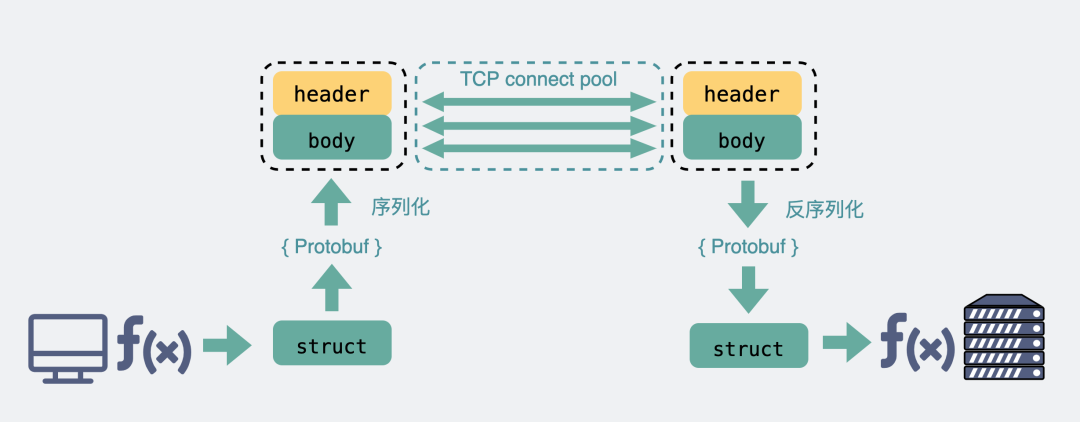
既然有HTTP协议,为什么还要有RPC
既然有HTTP协议,为什么还要有RPC? 从TCP聊起 作为一个程序员,假设我们需要在A电脑的进程发一段数据到B电脑的进程,我们一般会在代码里使用socket进行编程。 这时候,我们可选项一般也就TCP和UDP二选一。TCP可靠&…...
)
【新2023】华为OD机试 - 选座位(Python)
华为 OD 清单查看地址:blog.csdn.net/hihell/category_12199275.html 选座位 题目 疫情期间需要大家保证一定的社交距离 公司组织开交流会议,座位有一排共N个座位 编号分别为[0...n-1] 要求员工一个接着一个进入会议室 并且还可以在任何时候离开会议室 每当一个员工进入时…...
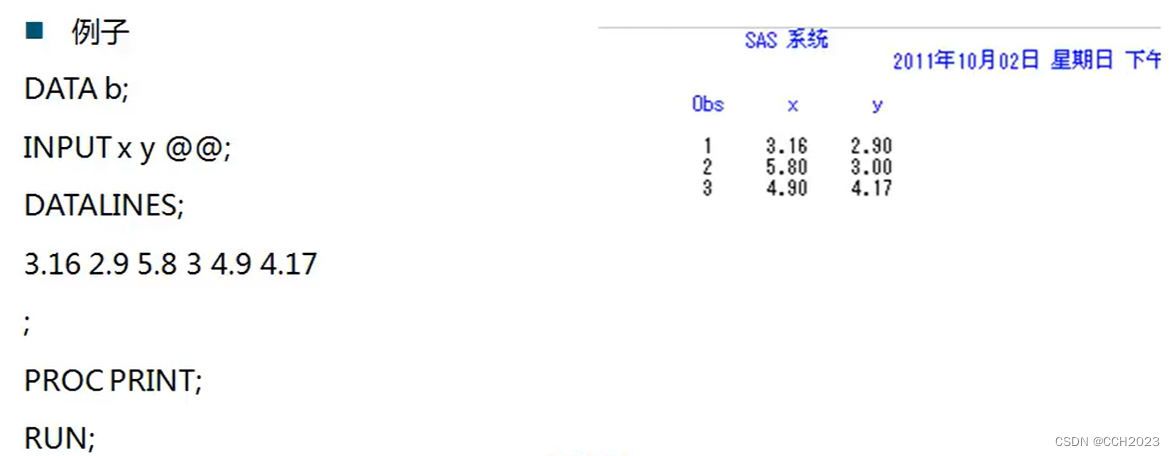
数据分析与SAS学习笔记4
INPUT语句:格式修饰符: “:” 修饰符。表示从下一个非空格列读入数据,直到:1 遇到再下一个空格列; 2 读到预先定义的变量长度; 3 数据行结束。哪个先出现就在哪儿结束。 “&” 修饰符。表示从下一个非空格列读入…...

Xepor:一款针对逆向工程和安全分析的Web路由框架
关于Xepor Xepor是一款专为逆向分析工程师和安全研究专家设计的Web路由框架,该工具可以为研究人员提供类似Flask API的功能,支持以人类友好的方式拦截和修改HTTP请求或HTTP响应信息。 该项目需要与mitmproxy一起结合使用,用户可以使用Xepor…...
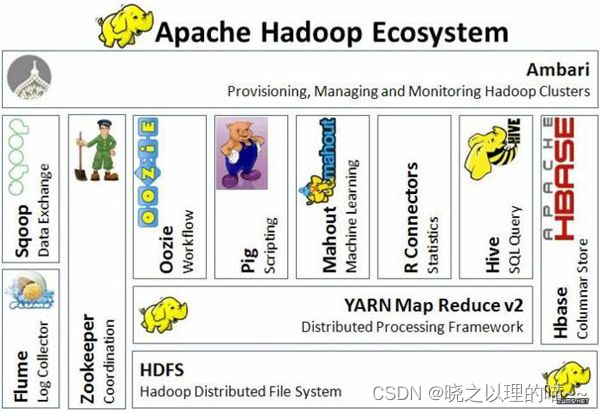
Hadoop核心组成和生态系统简介
一、Hadoop的概念 Hadoop是一个由Apache基金会所开发的分布式系统基础架构。用户可以在不了解分布式底层细节的情况下,开发分布式程序。充分利用集群的威力进行高速运算和存储。Hadoop实现了一个分布式文件系统( Distributed File System)&am…...
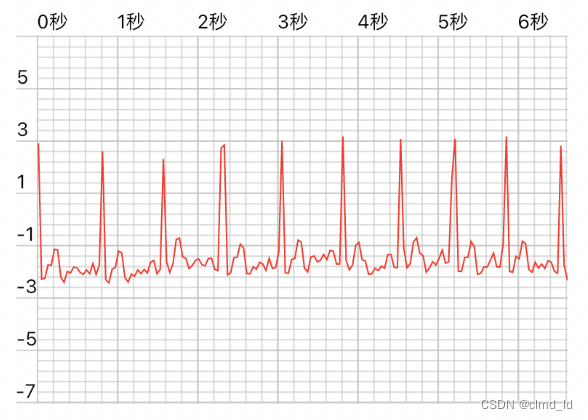
Flutter-Charts_painter大数据量绘制性能优化-数据收敛
Flutter-Charts_painter大数据量绘制性能优化-数据收敛 1、背景介绍 HRV测量仪器上传的数据,每秒有250个数据,业务上需要测量180秒,预计有3w-5w个数据点需要绘制到折线图上去。Charts_painter绘制这么大的数据是时候会有些卡顿,…...

使用 GeForce Experience 更新 NVIDIA GPU 显卡驱动
使用 GeForce Experience 更新 NVIDIA GPU 显卡驱动1. NVIDIA GeForce Experience 2. 驱动程序 -> 检查更新文件 3. 下载 如果有可用的新版驱动的话,点击后方的 [下载] 按钮即可。 4. 安装 [快速安装] 按照默认设置安装驱动,[自定义安装] 可以自行…...

Java泛型的<? super T>,<? extend T>的区别
? extends T ? extends T 描述了通配符上界, 即具体的泛型参数需要满足条件: 泛型参数必须是 T 类型或它的子类, 例如: List<? extends Number> numberArray new ArrayList<Number>(); // Number 是 Number 类型的 List<? extends Number>…...

如何做出好看的Excel可视化图表?
可视化死磕excel是不行的,作为数据分析行业的偷懒大户,分享一些我在可视化工具上的使用心得,总结了三大类:快速出图类、专业图表类、高端大屏类。个人经验,大家按需采纳: 一、快速出图类 如果你只是因为偶…...

Hypha框架深度解析:现代Python异步Web开发与API构建实践
1. 项目概述:Hypha,一个被低估的轻量级Web框架 如果你和我一样,长期在Web后端开发领域摸爬滚打,那么对Flask、FastAPI、Express这些名字一定耳熟能详。它们各有千秋,也各有其“甜蜜点”和“痛点”。最近在GitHub上闲逛…...

基于OpenTelemetry的LLM应用可观测性实践:从黑盒到透明化
1. 项目概述:当LLM应用遇见可观测性如果你正在开发或运维基于大语言模型(LLM)的应用,那么你一定遇到过这样的场景:用户反馈“AI回答得不对”,或者“响应突然变慢了”。当你一头扎进日志和监控系统ÿ…...

ARM TPIU调试架构原理与时钟同步技术解析
1. ARM TPIU架构与调试跟踪原理在嵌入式系统开发中,实时跟踪调试能力是诊断复杂问题的关键。Trace Port Interface Unit (TPIU)作为ARM CoreSight调试架构的核心组件,承担着将芯片内部多源跟踪数据可靠传输到外部分析设备的重要职责。其设计难点在于如何…...

AI原生推理为何卡在42ms?:SITS 2026实测揭示KV Cache压缩、FlashAttention-3适配与CUDA Graph动态融合的黄金三角
更多请点击: https://intelliparadigm.com 第一章:AI原生性能优化:SITS 2026 LLM推理加速实战技巧 在 SITS 2026 基准测试框架下,LLM 推理延迟与显存带宽利用率成为关键瓶颈。AI 原生优化并非简单套用传统 CUDA kernel 调优策略&…...

StofDoctrineExtensionsBundle的IpTraceable扩展:自动记录用户IP地址的简单实现指南 [特殊字符]
StofDoctrineExtensionsBundle的IpTraceable扩展:自动记录用户IP地址的简单实现指南 🚀 【免费下载链接】StofDoctrineExtensionsBundle Integration bundle for DoctrineExtensions by l3pp4rd in Symfony 项目地址: https://gitcode.com/gh_mirrors/…...

3步快速部署GitHub中文化插件:告别英文界面的烦恼
3步快速部署GitHub中文化插件:告别英文界面的烦恼 【免费下载链接】github-chinese GitHub 汉化插件,GitHub 中文化界面。 (GitHub Translation To Chinese) 项目地址: https://gitcode.com/gh_mirrors/gi/github-chinese 你是否曾经因为GitHub的…...

ustcthesis与Overleaf完美结合:云端LaTeX写作新体验
ustcthesis与Overleaf完美结合:云端LaTeX写作新体验 【免费下载链接】ustcthesis LaTeX template for USTC thesis 项目地址: https://gitcode.com/gh_mirrors/us/ustcthesis 在当今数字化写作时代,ustcthesis作为中国科学技术大学官方的学位论文…...

SecureVault - 基于新范式的Windows文件加密工具
前言作为一个常年和各种文件打交道的普通人,我一直有个困扰:现有的加密工具要么太复杂,要么太贵,要么用的都是几十年的老算法。我想,能不能做一款简单、便宜、但加密方式完全不同的新工具?于是就有了 Secur…...

EMC预合规测试:传导与辐射发射的实战指南
1. 预合规EMC测试的核心价值与挑战在电子设备开发领域,电磁兼容性(EMC)问题如同无形的暗礁,往往在产品开发后期才突然显现,导致昂贵的重新设计和上市延迟。我曾参与过一个工业控制设备的项目,团队在功能验证…...

免费开源网盘直链下载工具:八大主流网盘完整使用指南
免费开源网盘直链下载工具:八大主流网盘完整使用指南 【免费下载链接】Online-disk-direct-link-download-assistant 一个基于 JavaScript 的网盘文件下载地址获取工具。基于【网盘直链下载助手】修改 ,支持 百度网盘 / 阿里云盘 / 中国移动云盘 / 天翼云…...