Filebeat学习笔记
Filebeat基本概念
简介
Filebeat是一种轻量级日志采集器,内置有多种模块(auditd、Apache、Nginx、System、MySQL等),针对常见格式的日志大大简化收集、解析和可视化过程,只需一条命令即可。之所以能实现这一点,是因为它将自动默认路径(因操作系统而异)与Elasticsearch采集节点管道的定义和Kibana仪表板组合在一起。不仅如此,数个Filebeat模块还包括预配置的 Machine Learning 任务。另一点需要声明的是:根据采集的数据形式不同,形成了由多个模块组成的Beats。Beats是开源数据传输程序集,可以将其作为代理安装在服务器上,将操作数据发送给Elasticsearch,或者通过Logstash,在Kibana中可视化数据之前,在Logstash中进一步处理和增强数据。
Beats组成模块如下:
| 日志格式 | 采集所需组件框架 | 备注 |
|---|---|---|
| Audit data | Auditbeat | 轻量型审计日志采集器 |
| Log files | Filebeat | 轻量型日志采集器 |
| Availability | Heartbeat | 轻量型运行时间监控采集器 |
| Metrics | Metribeat | 轻量型指标采集器 |
| Network traffic | Packetbeat | 轻量型网络数据采集器 |
| Windows event logs | Winlogbeat | 轻量型Windows事件日志采集器 |

Filebeat特点
- 轻量型日志采集器,占用资源更少,对机器配置要求极低。
- 操作简便,可将采集到的日志信息直接发送到ES集群、Logstash、Kafka集群等消息队列中。
- 异常中断重启后会继续上次停止的位置。(通过${filebeat_home}\data\registry文件来记录日志的偏移量)。
- 使用压力敏感协议(backpressure-sensitive)来传输数据,在logstash忙的时候,Filebeat会减慢读取-传输速度,一旦logstash恢复,则Filebeat恢复原来的速度。
- Filebeat带有内部模块(auditd,Apache,Nginx,System和MySQL),可通过一个指定命令来简化通用日志格式的收集、解析和可视化。
bin/logstash -e 'input { stdin{} } output { stdout{} }'
Filebeat与Logstash对比
- Filebeat是轻量级数据托运者,您可以在服务器上将其作为代理安装,以将特定类型的操作数据发送到Elasticsearch。与Logstash相比,其占用空间小,使用的系统资源更少。
- Logstash具有更大的占用空间,但提供了大量的输入,过滤和输出插件,用于收集,丰富和转换来自各种来源的数据。
- Logstash是使用Java编写,插件是使用jruby编写,对机器的资源要求会比较高。在采集日志方面,对CPU、内存上都要比Filebeat高很多。
Filebeat安装
Filebeat本身对机器性能要求不高,采集数据后采用http请求发送数据。
下载链接:https://www.elastic.co/cn/downloads/beats/filebeat
注意下载版本对应一致,避免出现兼容性问题。
将下载的filebeat-8.9.0-linux-x86_64.tar.gz文件上传到/usr/local/software/路径上。
cd /usr/local/software/
tar -xzvf filebeat-8.9.0-linux-x86_64.tar.gz
mv filebeat-8.9.0-linux-x86_64 filebeat-8.9.0
cd filebeat-8.9.0
官方文档:https://www.elastic.co/guide/en/beats/filebeat/current/index.html
通过修改filebeat.yml文件
###################### Filebeat Configuration Example ########################## This file is an example configuration file highlighting only the most common
# options. The filebeat.reference.yml file from the same directory contains all the
# supported options with more comments. You can use it as a reference.
#
# You can find the full configuration reference here:
# https://www.elastic.co/guide/en/beats/filebeat/index.html# For more available modules and options, please see the filebeat.reference.yml sample
# configuration file.# ============================== Filebeat inputs ===============================filebeat.inputs:# Each - is an input. Most options can be set at the input level, so
# you can use different inputs for various configurations.
# Below are the input specific configurations.# filestream is an input for collecting log messages from files.
- type: filestream# Unique ID among all inputs, an ID is required.id: my-filestream-id# Change to true to enable this input configuration.# 输入默认是关闭状态,需要改成true打开enabled: false# Paths that should be crawled and fetched. Glob based paths.# 改成我们需要监控的日志文件paths:- /var/log/*.log#- c:\programdata\elasticsearch\logs\*# Windows的案例# Exclude lines. A list of regular expressions to match. It drops the lines that are# matching any regular expression from the list.# Line filtering happens after the parsers pipeline. If you would like to filter lines# before parsers, use include_message parser.#exclude_lines: ['^DBG']# Include lines. A list of regular expressions to match. It exports the lines that are# matching any regular expression from the list.# Line filtering happens after the parsers pipeline. If you would like to filter lines# before parsers, use include_message parser.#include_lines: ['^ERR', '^WARN']# Exclude files. A list of regular expressions to match. Filebeat drops the files that# are matching any regular expression from the list. By default, no files are dropped.#prospector.scanner.exclude_files: ['.gz$']# Optional additional fields. These fields can be freely picked# to add additional information to the crawled log files for filtering#fields:#  level: debug#  review: 1# ============================== Filebeat modules ==============================filebeat.config.modules:# Glob pattern for configuration loadingpath: ${path.config}/modules.d/*.yml# Set to true to enable config reloadingreload.enabled: false# Period on which files under path should be checked for changes#reload.period: 10s# ======================= Elasticsearch template setting =======================setup.template.settings:index.number_of_shards: 1#index.codec: best_compression#_source.enabled: false# ================================== General ===================================# The name of the shipper that publishes the network data. It can be used to group
# all the transactions sent by a single shipper in the web interface.
#name:# The tags of the shipper are included in their own field with each
# transaction published.
#tags: ["service-X", "web-tier"]# Optional fields that you can specify to add additional information to the
# output.
#fields:
#  env: staging# ================================= Dashboards =================================
# These settings control loading the sample dashboards to the Kibana index. Loading
# the dashboards is disabled by default and can be enabled either by setting the
# options here or by using the `setup` command.
#setup.dashboards.enabled: false# The URL from where to download the dashboards archive. By default this URL
# has a value which is computed based on the Beat name and version. For released
# versions, this URL points to the dashboard archive on the artifacts.elastic.co
# website.
#setup.dashboards.url:# =================================== Kibana ===================================# Starting with Beats version 6.0.0, the dashboards are loaded via the Kibana API.
# This requires a Kibana endpoint configuration.
setup.kibana:# Kibana Host# Scheme and port can be left out and will be set to the default (http and 5601)# In case you specify and additional path, the scheme is required: http://localhost:5601/path# IPv6 addresses should always be defined as: https://[2001:db8::1]:5601#host: "localhost:5601"# Kibana Space ID# ID of the Kibana Space into which the dashboards should be loaded. By default,# the Default Space will be used.#space.id:# =============================== Elastic Cloud ================================# These settings simplify using Filebeat with the Elastic Cloud (https://cloud.elastic.co/).# The cloud.id setting overwrites the `output.elasticsearch.hosts` and
# `setup.kibana.host` options.
# You can find the `cloud.id` in the Elastic Cloud web UI.
#cloud.id:# The cloud.auth setting overwrites the `output.elasticsearch.username` and
# `output.elasticsearch.password` settings. The format is `<user>:<pass>`.
#cloud.auth:# ================================== Outputs ===================================# Configure what output to use when sending the data collected by the beat.# ---------------------------- Elasticsearch Output ----------------------------
output.elasticsearch:# Array of hosts to connect to.hosts: ["localhost:9200"]# Protocol - either `http` (default) or `https`.#protocol: "https"# Authentication credentials - either API key or username/password.#api_key: "id:api_key"#username: "elastic"#password: "changeme"# ------------------------------ Logstash Output -------------------------------
#output.logstash:# The Logstash hosts#hosts: ["localhost:5044"]# Optional SSL. By default is off.# List of root certificates for HTTPS server verifications#ssl.certificate_authorities: ["/etc/pki/root/ca.pem"]# Certificate for SSL client authentication#ssl.certificate: "/etc/pki/client/cert.pem"# Client Certificate Key#ssl.key: "/etc/pki/client/cert.key"# ================================= Processors =================================
processors:- add_host_metadata:when.not.contains.tags: forwarded- add_cloud_metadata: ~- add_docker_metadata: ~- add_kubernetes_metadata: ~# ================================== Logging ===================================# Sets log level. The default log level is info.
# Available log levels are: error, warning, info, debug
#logging.level: debug# At debug level, you can selectively enable logging only for some components.
# To enable all selectors use ["*"]. Examples of other selectors are "beat",
# "publisher", "service".
#logging.selectors: ["*"]# ============================= X-Pack Monitoring ==============================
# Filebeat can export internal metrics to a central Elasticsearch monitoring
# cluster.  This requires xpack monitoring to be enabled in Elasticsearch.  The
# reporting is disabled by default.# Set to true to enable the monitoring reporter.
#monitoring.enabled: false# Sets the UUID of the Elasticsearch cluster under which monitoring data for this
# Filebeat instance will appear in the Stack Monitoring UI. If output.elasticsearch
# is enabled, the UUID is derived from the Elasticsearch cluster referenced by output.elasticsearch.
#monitoring.cluster_uuid:# Uncomment to send the metrics to Elasticsearch. Most settings from the
# Elasticsearch output are accepted here as well.
# Note that the settings should point to your Elasticsearch *monitoring* cluster.
# Any setting that is not set is automatically inherited from the Elasticsearch
# output configuration, so if you have the Elasticsearch output configured such
# that it is pointing to your Elasticsearch monitoring cluster, you can simply
# uncomment the following line.
#monitoring.elasticsearch:# ============================== Instrumentation ===============================# Instrumentation support for the filebeat.
#instrumentation:# Set to true to enable instrumentation of filebeat.#enabled: false# Environment in which filebeat is running on (eg: staging, production, etc.)#environment: ""# APM Server hosts to report instrumentation results to.#hosts:#  - http://localhost:8200# API Key for the APM Server(s).# If api_key is set then secret_token will be ignored.#api_key:# Secret token for the APM Server(s).#secret_token:# ================================= Migration ==================================# This allows to enable 6.7 migration aliases
#migration.6_to_7.enabled: true
相关文章:
Filebeat学习笔记
Filebeat基本概念 简介 Filebeat是一种轻量级日志采集器,内置有多种模块(auditd、Apache、Nginx、System、MySQL等),针对常见格式的日志大大简化收集、解析和可视化过程,只需一条命令即可。之所以能实现这一点&#…...
 —— React17+React Hook+TS4 最佳实践,仿 Jira 企业级项目(十六))
【实战】 九、深入React 状态管理与Redux机制(一) —— React17+React Hook+TS4 最佳实践,仿 Jira 企业级项目(十六)
文章目录 一、项目起航:项目初始化与配置二、React 与 Hook 应用:实现项目列表三、TS 应用:JS神助攻 - 强类型四、JWT、用户认证与异步请求五、CSS 其实很简单 - 用 CSS-in-JS 添加样式六、用户体验优化 - 加载中和错误状态处理七、Hook&…...

第九十五回 如何使用dio的转换器
文章目录 概念介绍使用方法使用默认的转换器自定义转换器 示例代码经验分享 我们在上一章回中介绍了"如何打造一个网络框架"相关的内容,本章回中将介绍 如何使用dio的转换器.闲话休提,让我们一起Talk Flutter吧。 概念介绍 转换器主要用来转…...
Python深度学习“四大名著”之一【赠书活动|第二期《Python机器学习:基于PyTorch和Scikit-Learn》】
近年来,机器学习方法凭借其理解海量数据和自主决策的能力,已在医疗保健、 机器人、生物学、物理学、大众消费和互联网服务等行业得到了广泛的应用。自从AlexNet模型在2012年ImageNet大赛被提出以来,机器学习和深度学习迅猛发展,取…...
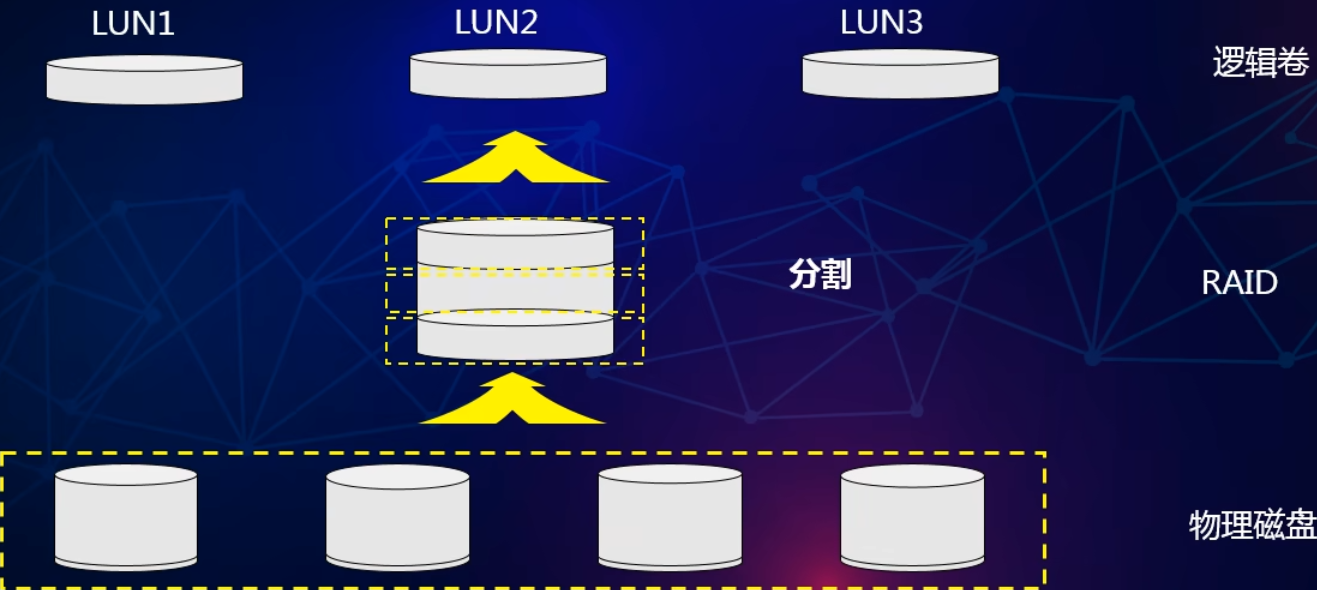
RAID相关知识
简介 RAID ( Redundant Array of Independent Disks )即独立磁盘冗余阵列,通常简称为磁盘阵列。RAID技术将多个单独的物理硬盘以不同的方式组合成一个逻辑磁盘,从而提高硬盘的读写性能和数据安全性。 数据组织形式 分块&#x…...
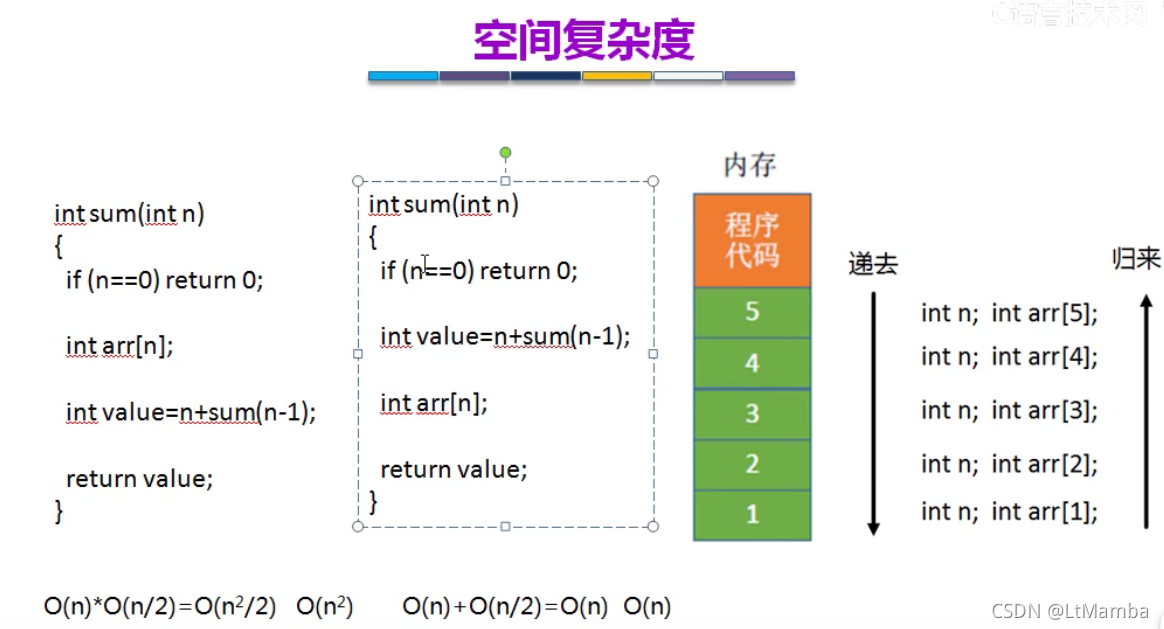
DataStructure--Basic
程序设计数据结构算法 只谈数据结构不谈算法就跟去话剧院看梁山伯与祝英台结果只有梁山伯在演,祝英台生病了没来一样。 本文的所有内容都出自《大话数据结构》这本书中的代码实现部分,建议看书,书中比我本文写的全。 数据结构,直…...
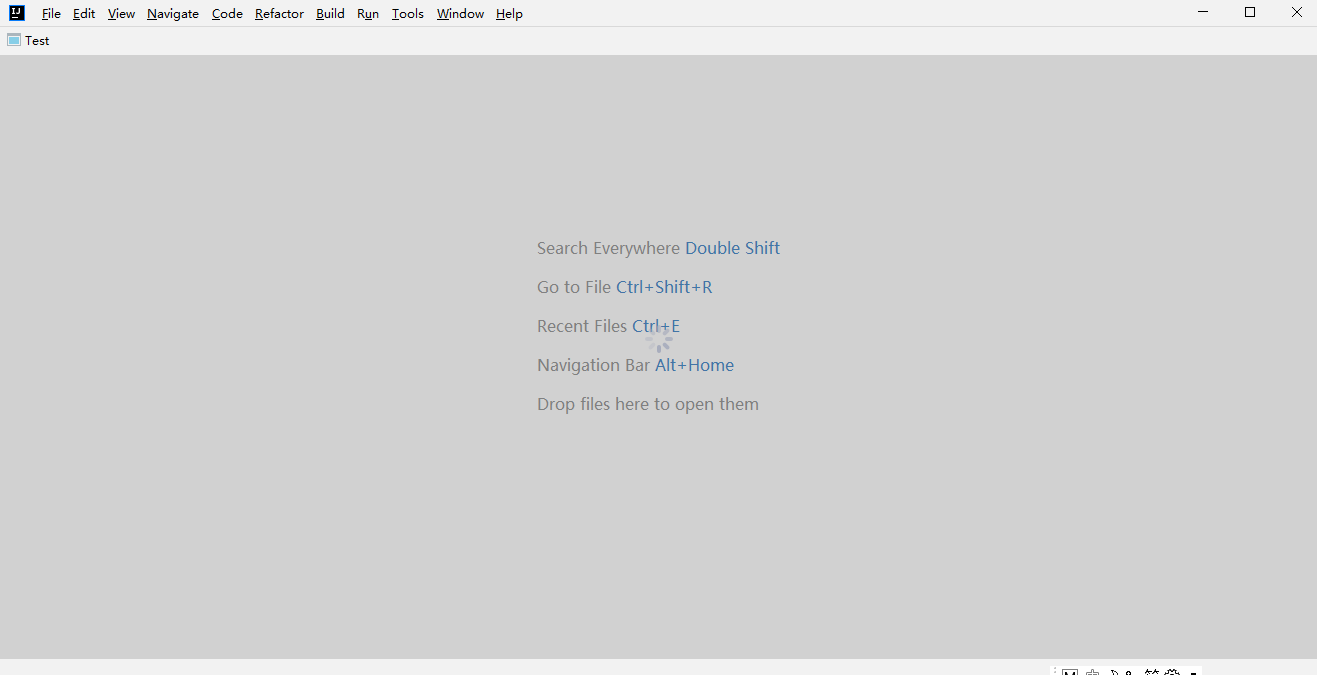
Intellij IDEA 双击启动报错ClassNotFoundException: com.licel.b.z@
项目场景: 新从官网下载了ideaIU-2023.2.win.zip ,安装后双击启动报错, 无法运行idea, 提示信息如下 问题描述 Internal error. Please refer to https://jb.gg/ide/critical-startup-errorsjava.lang.ExceptionInInitializerErrorat java…...
使用 Logstash 及 enrich processor 实现数据丰富自动化
在我之前的文章: Elasticsearch:enrich processor (7.5发行版新功能) Elasticsearch:使用 Elasticsearch ingest pipeline 丰富数据 通过上面的两篇文章的介绍,我们应该充分掌握了如何使用 enrich proce…...
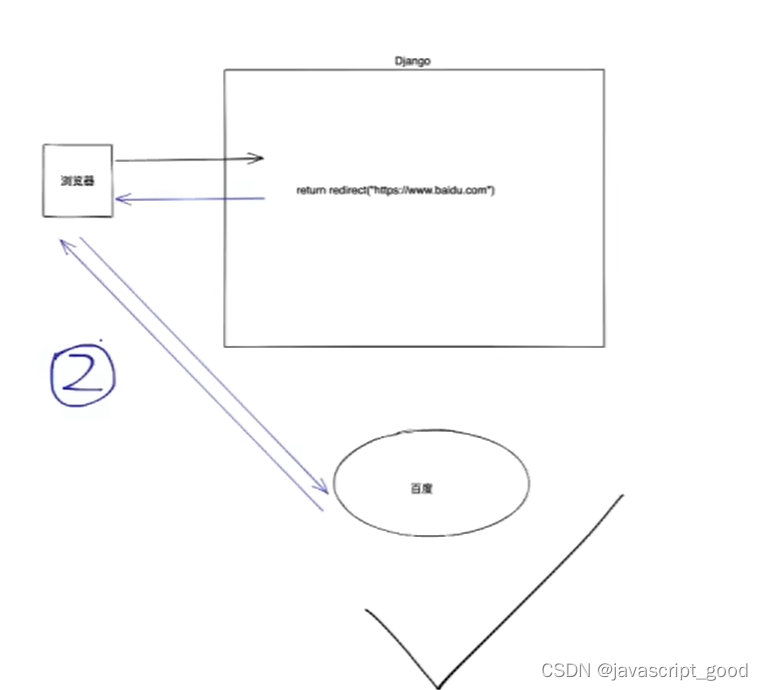
Django模板语法和请求
1、在django关于模板文件加载顺序 创建的django项目下会有一个seeetings.py的文件 如果在seeetings.py 中加了 os.path.join(BASE_DIR,‘templates’),如果是pycharm创建的django项目会加上,就会默认先去根目录找templates目录下的html文件,…...

Android跨进程传大图思考及实现——附上原理分析
1.抛一个问题 这一天,法海想锻炼小青的定力,由于Bitmap也是一个Parcelable类型的数据,法海想通过Intent给小青传个特别大的图片 intent.putExtra("myBitmap",fhBitmap)如果“法海”(Activity)使用Intent去传递一个大的Bitmap给“…...
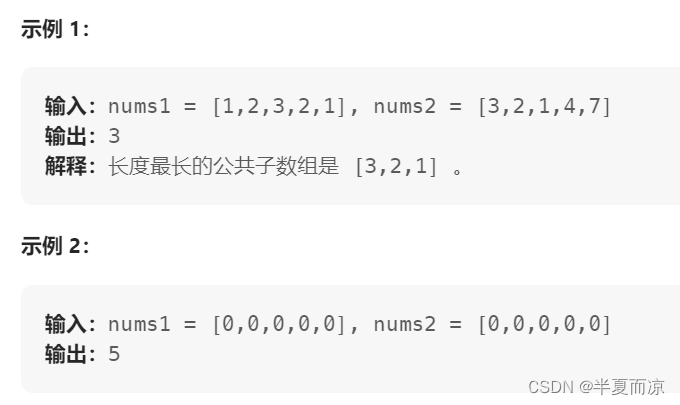
【动态规划part13】| 300.最长递增子序列、674.最长连续递增序列、718.最长重复数组
目录 🎈LeetCode 300.最长递增子序列 🎈LeetCode 674. 最长连续递增序列 🎈LeetCode 718. 最长重复子数组 🎈LeetCode 300.最长递增子序列 链接:300.最长递增子序列 给你一个整数数组 nums ,找到其…...

QMainWindow
文章目录 QMainWindow基本元素QMainWindow函数介绍简单的示例效果图 QMainWindow QMainWindow是一个为用户提供主窗口程序 的类,包含一个菜单栏(menu bar)、多个工具栏 (tool bars)、多个锚接部件(dock widgets)、―个 状态栏(status bar )及一个中心部件(central …...
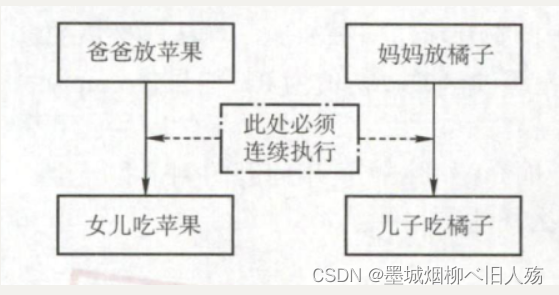
PV操作解决经典进程同步问题
一.经典同步问题 在学习《操作系统》时,会接触到进程的概念,其中不可避免的接触到进程同步问题,今天我们用熟悉的PV操作解决一些经典的进程同步问题。 二.生产者-消费者问题 1.问题描述 问题描述:一组生产者进程和一组消费者进…...

一文3000字从0到1使用Selenium进行自动化测试
对于很多刚入门的测试新手来说,大家都将自动化测试作为自己职业发展的一个主要阶段。可是,在成为一名合格的自动化测试工程师之前,我们不仅要掌握相应的理论知识,还要进行大量的实践,积累足够的经验,以便快…...

基于开源IM即时通讯框架MobileIMSDK:RainbowChat v9.0版已发布
关于MobileIMSDK MobileIMSDK 是一套专门为移动端开发的开源IM即时通讯框架,超轻量级、高度提炼,一套API优雅支持UDP 、TCP 、WebSocket 三种协议,支持iOS、Android、H5、标准Java平台,服务端基于Netty编写。 工程开源地址是&am…...

交叉编译----宿主机x86 ubuntu 64位-目标机ARMv8 aarch64
1.交叉编译是什么,为什么要交叉编译 编译:在一个平台上生成在该平台上的可执行代码交叉编译:在一个平台上生成在另一个平台上的可执行代码交叉编译的例子:如51单片机的可执行代码(hex文件)是在集成环境kei…...
安防监控视频汇聚平台EasyCVR修改录像计划等待时间较长是什么原因?
安防监控视频EasyCVR视频融合汇聚平台基于云边端智能协同,支持海量视频的轻量化接入与汇聚、转码与处理、全网智能分发等。音视频流媒体视频平台EasyCVR拓展性强,视频能力丰富,具体可实现视频监控直播、视频轮播、视频录像、云存储、回放与检…...

深度学习调参指南
1. 选择合适的模型架构 模型的结构(层数和宽度),参数配置,尽量用已经有效的模型 2. 选择优化器 针对具体的问题,从选择常用的优化器开始,进行比较 3. 选择BatchSize 1). Batch Size决定训练速度,但是不影响验证集…...

MYSQL 优化常用方法
1、选取最适用的字段属性 MySQL可以很好的支持大数据量的存取,但是一般说来,数据库中的表越小,在它上面执行的查询也就会越快。因此,在创建表的时候,为了获得更好的性能,我们可以将表中字段的宽度设得尽可…...
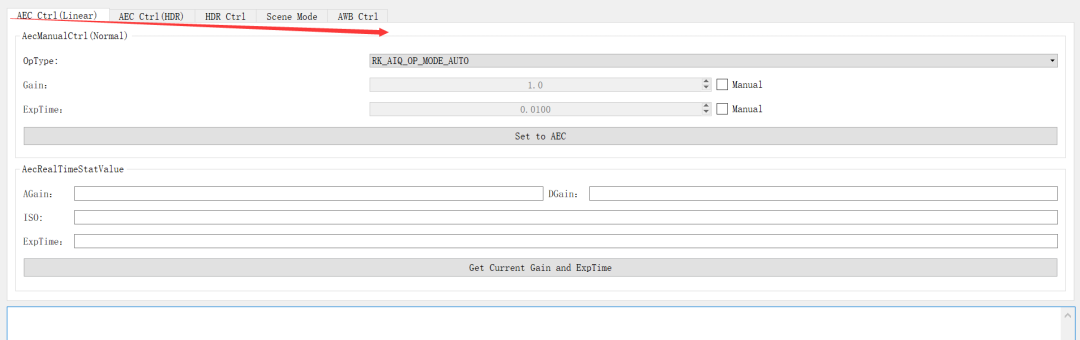
isp调试工具环境搭建及其介绍!
一、isp调试环境搭建: 后期调试isp,是在rv1126提供的RKISP2.x Tuner工具上进行调试,所以我们大前提必须要把这个环境和一些操作先搞熟悉来,后面有一些专用术语,我们遇到了再去看,现在专门看一些专用术语&am…...

Burp Suite MFA插件开发实战:状态机驱动的多因素认证自动化
1. 这不是“加个验证码”那么简单:为什么MFA插件开发是Burp生态里最被低估的硬功夫你肯定见过这样的场景:测试一个银行后台,登录流程走完用户名密码后,弹出Google Authenticator六位码;再点一下,又跳转到短…...

比系统自带强在哪?深度体验WizTree v4.16:磁盘分析老手的新选择
WizTree v4.16:重新定义磁盘空间分析的效率革命当你的C盘突然亮起红色警告,或是发现SSD剩余空间以每天1GB的速度神秘消失时,大多数人的第一反应是打开Windows自带的磁盘清理工具。但真正经历过数据洪流洗礼的IT老手,往往会默默启动…...

鲸震恩!DeepSeek V4 价格永久“打骨折”,网友疯狂“表白”:梁圣的恩情还不完
①2026 年 5 月 22 日 20:36,DeepSeek 官宣,deepseek-v4-pro 模型 API 价格将于北京时间 2026/05/31 23:59 结束 2.5 折优惠活动后,正式调整为原定价的 1/4。也就是说,从 6 月 1 日起当前 2.5 折直接变成常态价了。在上次…...

SELA框架:融合MCTS与LLM的智能AutoML新范式
1. SELA框架:当MCTS的“棋手”思维遇上LLM的“专家”直觉在数据科学项目里,最耗时的往往不是敲代码,而是做决策。面对一个新的表格数据集,从数据清洗、特征工程到模型选型、调参,每一步都像站在一个岔路口,…...

Keil ULINK强制全片擦除与CRC校验实践
1. 问题现象与背景解析当使用Keil开发环境配合ULINK调试器对英飞凌C166系列微控制器进行程序烧录时,部分工程师会遇到一个看似奇怪的现象:明明在代码中设置了全片CRC校验逻辑,但实际运行时却出现校验失败。经过排查发现,ULINK默认…...

深度学习框架与编程语言选型指南:从TensorFlow、PyTorch到Java生态的实战解析
1. 项目概述在人工智能浪潮席卷全球的今天,机器学习与深度学习已不再是实验室里的概念,而是驱动产业变革、解决实际问题的核心引擎。无论是识别网络中的异常流量以抵御攻击,还是从海量数字证据中快速定位关键线索,这些技术都展现出…...

从零到一:用 LangChain 搭建你的第一个 AI Agent,让 LLM 自己干活!
导读:,2024年最火的不是大模型本身,而是基于大模型的 AI Agent。它能自主思考、调用工具、执行任务——不再是"你说一句我回一句"的聊天机器人,而是真正能帮你干活的数字员工。本文从零带你搭建一个完整的 AI Agent&…...

Cortex-R82集成ELA-600调试模块的信号连接问题解析
1. Cortex-R82与ELA-600集成时的信号连接问题解析在基于Arm Cortex-R82处理器的开发过程中,集成ELA-600(Embedded Logic Analyzer)调试模块是一个常见但容易产生困惑的环节。许多工程师在YAML配置文件中添加ELA-600支持后,会发现系…...
)
Windows设备管理器报‘代码43’导致HDMI无输出?保姆级排查与修复指南(附原理)
Windows设备管理器报‘代码43’导致HDMI无输出?保姆级排查与修复指南(附原理)当你正准备进行一场重要的演示,或是沉浸在游戏世界中时,突然发现外接显示器黑屏无信号,设备管理器显示"Windows已停止该设…...

计算机视觉与贝叶斯优化驱动的粉末饮料智能制备系统
1. 项目概述:从“冲一杯”到“冲好一杯”的自动化跃迁“机器人结合计算机视觉与贝叶斯优化实现粉末饮料制备自动化”,这个标题听起来有点学术,但说白了,我们做的就是把冲奶粉、泡蛋白粉、调咖啡这类“凭感觉”的手工活,…...