About Oracle Database Performance Method
bottleneck(瓶颈): a point where resource contention is highest
throughput(吞吐量): the amount of work that can be completed in a specified time.
response time (响应时间): the time to complete a specified workload
2.1 Gathering Database Statistics Using the Automatic Workload Repository(AWR)
Automatic Workload Repository (AWR) automates database statistics gathering by collecting, processing, and maintaining performance statistics for database problem detection and self-tuning purposes.
the database gathers statistics every hour and creates an AWR snapshot, which is a set of data for a specific time that is used for performance comparisons.
The following initialization parameters are relevant for AWR:
- STATISTICS_LEVEL
- CONTROL_MANAGEMENT_PACK_ACCESS
The database statistics collected and processed by AWR include:
2.1.1 Time Model Statistics
Time model statistics measure the time spent in the database by operation type. The most important time model statistic is database time (DB time). DB time represents the total time spent in database calls by foreground sessions, and is an indicator of the total instance workload.
A session is a logical entity in the database instance memory that represents the state of a current user login to a database.Database time is calculated by aggregating the CPU time and wait time of all active sessions (sessions that are not idle).

The objective of database tuning is to reduce DB time. In this way, you can improve the overall response time of user transactions in the application.
2.1.2 Wait Event Statistics
Wait events are incremented by a session to indicate that the session had to wait for an event to complete before being able to continue processing. When a session has to wait while processing a user request, the database records the wait by using one of a set of predefined wait events. The events are then grouped into wait classes, such as User I/O and Network. Wait event data reveals symptoms of problems that might be affecting performance, such as latch, buffer, or I/O contention.
2.1.3 Session and System Statistics
A large number of cumulative database statistics are available on a system and session level. Some of these statistics are collected by AWR.
2.1.4 Active Session History Statistics
The Active Session History (ASH) statistics are samples of session activity in the database. The database samples active sessions every second and stores them in a circular buffer in the System Global Area (SGA).
2.1.5 High-Load SQL Statistics
SQL statements that are consuming the most resources produce the highest load on the system, based on criteria such as elapsed time and CPU time.
2.2 Using the Oracle Performance Method
Performance tuning using the Oracle performance method is driven by identifying and eliminating bottlenecks in the database, and by developing efficient SQL statements. Database tuning is performed in two phases: proactively and reactively.
In the proactive tuning phase, you must perform tuning tasks as part of your daily database maintenance routine, such as reviewing ADDM analysis and findings, monitoring the real-time performance of the database, and responding to alerts.
In the reactive tuning phase, you must respond to issues reported by users, such as performance problems that may occur for only a short duration of time, or performance degradation to the database over a period of time.
SQL tuning is an iterative process to identify, tune, and improve the efficiency of high-load SQL statements.
To improve database performance, you must apply these principles iteratively.
2.2.1 Preparing the Database for Tuning
To prepare the database for tuning:
- Get feedback from users.
Determine the scope of the performance project and subsequent performance goals, and determine performance goals for the future. This process is key for future capacity planning.
2. Check the operating systems of all systems involved with user performance.
Check for hardware or operating system resources that are fully utilized. List any overused resources for possible later analysis. In addition, ensure that all hardware is functioning properly.
3.Ensure that the STATISTICS_LEVEL initialization parameter is set to TYPICAL (default) or ALL to enable the automatic performance tuning features of Oracle Database, including AWR and ADDM.
4.Ensure that the CONTROL_MANAGEMENT_PACK_ACCESS initialization parameter is set to DIAGNOSTIC+TUNING (default) or DIAGNOSTIC to enable ADDM.
2.2.2 Tuning the Database Proactively
To tune the database proactively:
- Review the ADDM findings
- Implement the ADDM recommendations
- Monitor performance problems with the database in real time
- Respond to performance-related alerts
-
Validate that any changes have produced the desired effect, and verify that the users experience performance improvements.
2.2.3 Tuning the Database Reactively
This section lists and describes the steps required to tune the database based on user feedback. This tuning procedure is considered reactive. Perform this procedure periodically when performance problems are reported by the users.
To tune the database reactively:
- Run ADDM manually to diagnose current and historical database performance when performance problems are reported by the users
- Resolve transient performance problems.(ASH reports enable you to analyze trainsient performance problems with the database that are short-lived and do not appear in the ADDM analysis)
- Resolve performance degradation over time
-
Validate that the changes made have produced the desired effect, and verify that the users experience performance improvements.
-
Repeat these steps until your performance goals are met or become impossible to achieve due to other constraints.
2.2.4 Tuning SQL Statements
This section lists and describes the steps required to identify, tune, and optimize high-load SQL statements.
To tune SQL statements:
- Identify high-load SQL statements
- Tune high-load SQL statements
- Optimize data access paths(creating the proper set of materialized views, materialized view logs, and indexes for a given workload by using SQL Access Advisor)
- Analyze the SQL performance impact of SQL tuning and other system changes by using SQL Performance Analyzer.
-
Repeat these steps until all high-load SQL statements are tuned for greatest efficiency.
2.3 Common Performance Problems Found in Databases
consult the appropriate section that addresses these problems:
- CPU bottlenecks
Performance problems caused by CPU bottlenecks are diagnosed by ADDM,you can also identify CPU bottlenecks by using the Performance page in Cloud Control
- Undersized memory structures
Are the Oracle memory structures such as the System Global Area (SGA), Program Global Area (PGA), and buffer cache adequately sized? Performance problems caused by undersized memory structures are diagnosed by ADDM.You can also identify memory usage issues by using the Performance page in Cloud Control
- I/O capacity issues
Is the I/O subsystem performing as expected? Performance problems caused by I/O capacity issues are diagnosed by ADDM.You can also identify disk I/O issues by using the Performance page in Cloud Control
- Suboptimal use of Oracle Database by the application
Problems such as establishing new database connections repeatedly, excessive SQL parsing, and high levels of contention for a small amount of data (also known as application-level block contention) can degrade the application performance significantly. Performance problems caused by suboptimal use of Oracle Database by the application are diagnosed by ADDM.You can also monitor top activity in various dimensions—including SQL, session, services, modules, and actions—by using the Performance page in Cloud Control.
- Concurrency issues
A high degree of concurrent activities might result in contention for shared resources that can manifest in the form of locks or waits for buffer cache. Performance problems caused by concurrency issues are diagnosed by ADDM.You can also identify concurrency issues by using Top Sessions in Cloud Control
- Database configuration issues
For example, is there evidence of incorrect sizing of log files, archiving issues, too many checkpoints, or suboptimal parameter settings? Performance problems caused by database configuration issues are diagnosed by ADDM.
- Short-lived performance problems
Depending on the interval between snapshots taken by AWR, performance problems that have a short duration may not be captured by ADDM. You can identify short-lived performance problems by using the Active Session History report.
- Degradation of database performance over time
You can generate an AWR Compare Periods report to compare the period when the performance was poor to a period when the performance is stable to identify configuration settings, workload profile, and statistics that are different between these two time periods. This technique helps you identify the cause of the performance degradation
- Inefficient or high-load SQL statements
Performance problems caused by high-load SQL statements are diagnosed by ADDM.You can also identify high-load SQL statements by using Top SQL in Cloud Control.You can tune the high-load SQL statements using SQL Tuning Advisor
- Object contention
Are any database objects the source of bottlenecks because they are continuously accessed?Performance problems caused by object contention are diagnosed by ADDM.You can also optimize the data access path to these objects using SQL Access Advisor.
- Unexpected performance regression after tuning SQL statements
Tuning SQL statements may cause changes to their execution plans, resulting in a significant impact on SQL performance. In some cases, the changes may result in the improvement of SQL performance. In other cases, the changes may cause SQL statements to regress, resulting in a degradation of SQL performance.
Before making changes on a production system, you can analyze the impact of SQL tuning on a test system by using SQL Performance Analyzer. This feature enables you to forecast the impact of system changes on a SQL workload by:
-
Measuring the performance before and after the change
-
Generating a report that describes the change in performance
-
Identifying the SQL statements that regressed or improved
-
Providing tuning recommendations for each SQL statement that regressed
-
Enabling you to implement the tuning recommendations when appropriate
相关文章:
About Oracle Database Performance Method
bottleneck(瓶颈): a point where resource contention is highest throughput(吞吐量): the amount of work that can be completed in a specified time. response time (响应时间): the time to complete a spec…...
)
JavaScript 日期和时间的格式化大汇总(收集)
一、日期和时间的格式化 1、原生方法 1.1、使用 toLocaleString 方法 Date 对象有一个 toLocaleString 方法,该方法可以根据本地时间和地区设置格式化日期时间。例如: const date new Date(); console.log(date.toLocaleString(en-US, { timeZone: …...

【Python】缺失值可视化工具库:missingno
文章目录一、前言二、下载二、使用介绍2.1 绘制缺失值条形图2.2 绘制缺失值热力图2.3 缺失值树状图三、参考资料一、前言 在我们进行机器学习或者深度学习的时候,我们经常会遇到需要处理数据集缺失值的情况,那么如何可视化数据集的缺失情况呢࿱…...

【代码随想录二刷】Day18-二叉树-C++
代码随想录二刷Day18 今日任务 513.找树左下角的值 112.路径总和 113.路径总和ii 106.从中序与后序遍历序列构造二叉树 105.从前序与中序遍历序列构造二叉树 语言:C 513.找树左下角的值 链接:https://leetcode.cn/problems/find-bottom-left-tree-va…...
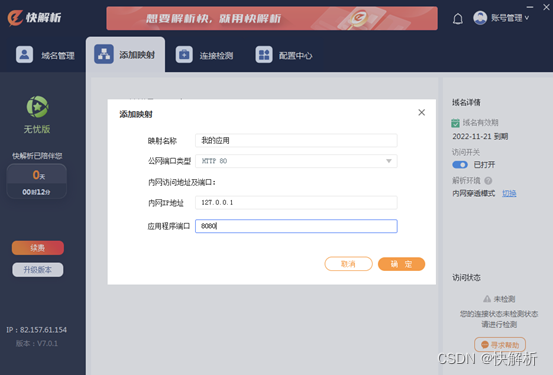
制造业的云ERP在外网怎么访问?内网服务器一步映射到公网
随着企业信息化、智能化时代的到来,很多制造业企业都在用云ERP。用友U 9cloud通过双版本公有云专属、私有云订阅、传统软件购买三种模式满足众多制造业企业的需求,成为一款适配中型及中大型制造业的云ERP,是企业数智制造的创新平台。 用友U 9…...

zookeeper 复习 ---- 练习
zookeeper 复习 ---- 练习在同一节点配置三个 zookeeper,配置正确的是? A: zoo1.cfg tickTime2000 initLimit5 syncLimit2 dataDir/var/lib/zookeeper/zoo1 clientPort2181 server.1localhost:2666:3666 server.2localhost:2667:3667 serv…...

2023年全国最新道路运输从业人员精选真题及答案1
百分百题库提供道路运输安全员考试试题、道路运输从业人员考试预测题、道路安全员考试真题、道路运输从业人员证考试题库等,提供在线做题刷题,在线模拟考试,助你考试轻松过关。 11.在以下选项中关于安全生产管理方针描述正确的是(…...
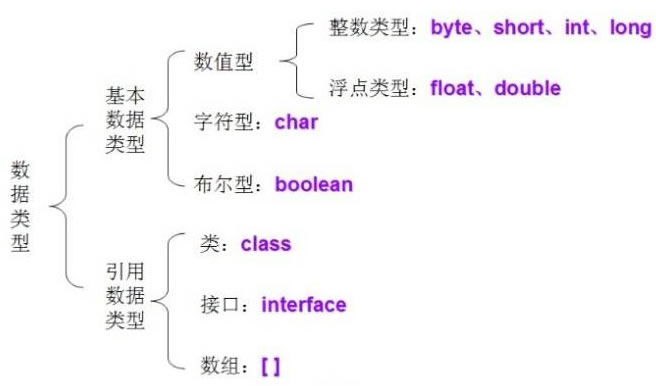
Java每日一练——Java简介与基础练习
系列文章目录 提示:这里可以添加系列文章的所有文章的目录,目录需要自己手动添加 例如:第一章 Python 机器学习入门之pandas的使用 文章目录 目录 系列文章目录 文章目录 前言 一、简述解释型语言与编译型语言 二、Java语言的执行流程 2.1、…...
解决Edge浏览器主页被篡改问题,或许可以帮你彻底解决
问题描述: 之前从一个第三方网站下载了一个不知名软件,接着电脑就各种下载360全家桶之类的软件,后来问题解决了,但是还残留了一些问题,前几天发现edge浏览器的主页被改成了360导航,就是那个该死的hao123&a…...
字符设备驱动基础(一)
目录 一、Linux内核对设备的分类 linux的文件种类: Linux内核按驱动程序实现模型框架的不同,将设备分为三类: 总体框架图: 二、设备号------内核中同类设备的区分 三、申请和注销设备号 四、函数指针复习 4.1、 内存四区 …...
将 Supabase 作为下一个后端服务
对于想快速实现一个产品而言,如果使用传统开发,又要兼顾前端开发,同时又要花费时间构建后端服务。然而有这么一个平台(Baas Backend as a service)后端即服务,能够让开发人员可以专注于前端开发,…...

14:高级篇 - CTK 服务工厂 简述
作者: 一去、二三里 个人微信号: iwaleon 微信公众号: 高效程序员 一般情况下,服务对象在被注册之后,任何其它的 Plugin 在请求该服务时,CTK Plugin Framework 都返回的是同一个对象。倘若要为每一个 Plugin 消费者返回不同的服务对象,或者在真正需要该服务对象时才创建…...
Java中的链表实现介绍
Java中的链表实现介绍 学习数据结构的的链表和树时,会遇到节点(node)和链表(linked list)这两个术语,节点是处理数据结构的链表和树的基础。节点是一种数据元素,包括两个部分:一个是…...
演示Ansible中的角色使用方法(ansible roles)
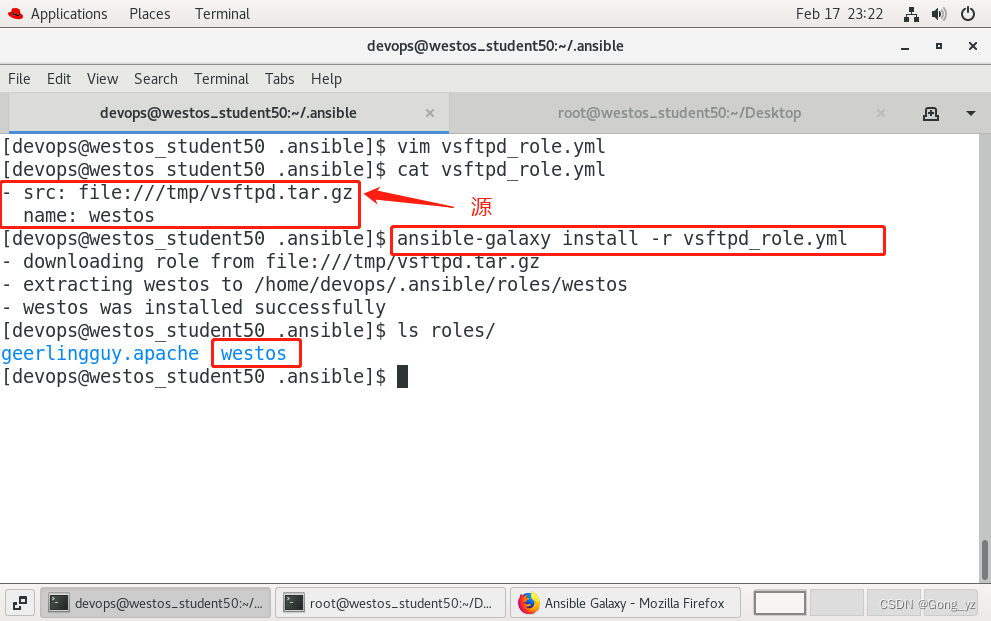
文章目录一、ansible 角色简介二、roles目录结构三、role存放的路径:配置文件ansible.cfg中定义四、创建目录结构五、playbook中使用rolesplaybook变量会覆盖roles中的定义变量六、控制任务执行顺序七、ansible—galaxy命令工具八、安装选择的角色1.从网上下载&…...
Bash Shell 通过ls命令筛选文件
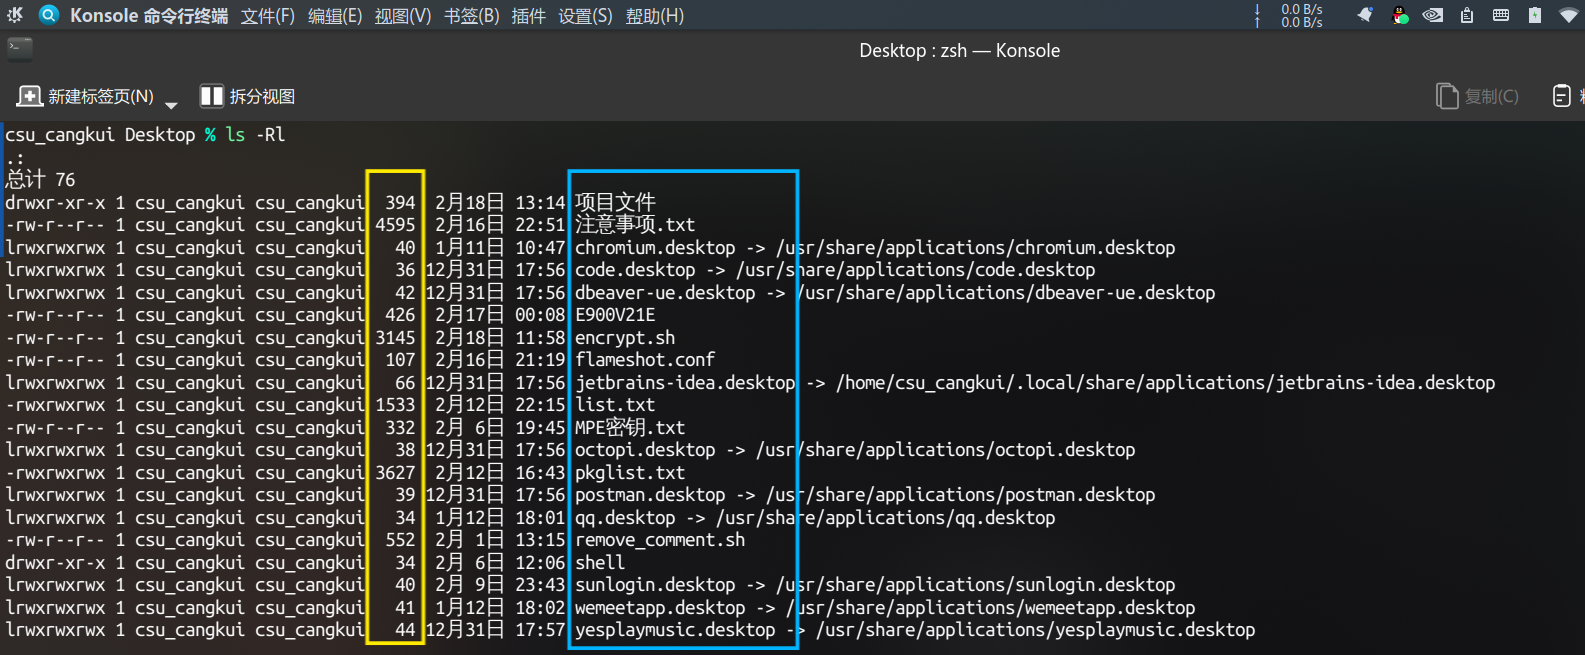
Bash Shell 通过ls命令及其管道根据大小名称筛选文件 最近参与的项目当中有需要用pyarmor加密项目的要求,听网上吹的pyarmor都那么神,用了一下感觉也一般,试用版普通模式下文件加密居然还有大小32KB的限制,加密到一半就失败了&am…...

2023-2-18 刷题情况
删列造序 III 题目描述 给定由 n 个小写字母字符串组成的数组 strs ,其中每个字符串长度相等。 选取一个删除索引序列,对于 strs 中的每个字符串,删除对应每个索引处的字符。 比如,有 strs [“abcdef”,“uvwxyz”] …...

【Linux】进程控制
文章目录进程创建简单认识一下fork()函数为什么fork()会有两个返回值fork通过写时拷贝的方式创建子进程进程终止进程退出码进程退出的方式exit()和_exit()进程等待进程等待方法 -- wait()和waitpid()status参数解释waitpid()的pid参数waitpid()的options参数 - 阻塞和非阻塞进程…...

谷歌seo快排技术怎么做?Google排名霸屏推广原理
本文主要分享关于谷歌快速排名的方法和所需要的条件。 本文由光算创作,有可能会被剽窃和修改,我们佛系对待这种行为吧。 首先提出一个问题:谷歌seo快排技术怎么做?如何达到谷歌霸屏的效果? 答案是:利用谷…...

MySQL的优化
目录 一.概念 二.查看SQL执行频率 三.定位低效率执行SQL 定位低效率执行SQL—慢查询日志 操作 定位低效率执行SQL—show processlist 四.explain分析执行计划 字段说明 explain中的id explain中的select_type explain中的type explain中的table explain中的rows ex…...
实现qq群消息接收和发送功能
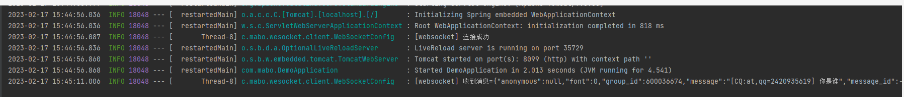
QQWebsocketClient是什么 实现qq群消息接收和发送功能,基于websocket技术和cqhttp服务开发 一、 效果截图 二、实现思路 使用cqhttp进行socket反向代理,获取qq聊天的所有消息 编写java客户端,连接至cqhttp服务器获取聊天消息 获取聊天消…...

企业级后端四层架构实战:从理论到代码的清晰落地
1. 项目概述:一个四层架构的实战蓝图最近在GitHub上看到一个挺有意思的项目,叫BTawaifi/four-layer-system。光看名字,你可能会觉得这又是一个老生常谈的“四层架构”理论教程,无非是Controller、Service、Repository那套东西。但…...

Go语言SDK开发实战:为AI编程助手Cursor构建高效API客户端
1. 项目概述:一个为AI编程助手Cursor定制的Go语言SDK如果你和我一样,日常重度依赖Cursor这类AI编程助手来提升开发效率,同时又是个Go语言的忠实拥趸,那你肯定遇到过这样的场景:想用Go写个脚本,自动化处理一…...

基于Blazor与LLamaSharp构建本地大模型ChatGPT式Web应用
1. 项目概述与核心价值最近在折腾一个内部工具,想把本地大模型的能力和类似ChatGPT的对话体验结合起来,部署成一个Web应用。找了一圈,发现一个挺有意思的项目叫“BLlamaSharp.ChatGpt.Blazor”。光看这个名字,信息量就很大了&…...

【ElevenLabs阿拉伯文语音实战指南】:20年AI语音工程师亲授7大本地化陷阱与3步高保真合成法
更多请点击: https://intelliparadigm.com 第一章:阿拉伯语语音合成的独特挑战与ElevenLabs能力边界 阿拉伯语语音合成(TTS)面临多重语言学与技术层面的固有挑战,远超拉丁语系语言的常规处理范畴。其核心难点在于右向…...

个人代码问题记录
内容全部来自网上搜集,防止再次遇到同样问题找不到地方参考了,遇到问题解决了就更新 MATLAB 1,求逆问题,奇异 使用函数xlsqminnorm(A,b)或伪逆xpinv(A)*b 矩阵求逆若出现“矩阵接近奇异值,或者缩放错误“怎么办 2…...

Mermaid Live Editor:免费实时图表编辑器终极指南,让技术绘图简单到令人惊叹
Mermaid Live Editor:免费实时图表编辑器终极指南,让技术绘图简单到令人惊叹 【免费下载链接】mermaid-live-editor Edit, preview and share mermaid charts/diagrams. New implementation of the live editor. 项目地址: https://gitcode.com/GitHub…...

智能硬件开发实战:从核心架构到产品落地的全流程解析
1. 智能硬件:从概念到现实的产业全景透视提起“智能硬件”,很多朋友可能觉得这是个离自己生活有点距离的高科技词汇。但如果说“智能手机”,那几乎无人不知,无人不晓。其实,智能硬件和智能手机在本质上是一脉相承的&am…...

PHP 的多态机制的庖丁解牛
它的本质是:多态 (Polymorphism) 允许不同的类对象,在响应 相同的方法调用 (Method Call) 时,表现出 不同的行为 (Behavior)。它基于 继承 (Inheritance) 或 接口实现 (Interface Implementation),通过 父类/接口引用 指向 子类/实…...

基于MCP协议构建Jira连接器:打通AI助手与项目管理的技术实践
1. 项目概述:当Jira遇上MCP,一个连接器如何重塑项目管理工具链如果你和我一样,长期在软件研发一线摸爬滚打,那么对Jira这个名字一定不会陌生。它几乎是敏捷开发、缺陷跟踪和项目管理的代名词,无数团队用它来规划冲刺、…...

如何为 Claude Code 配置 Taotoken 的稳定 API 连接
🚀 告别海外账号与网络限制!稳定直连全球优质大模型,限时半价接入中。 👉 点击领取海量免费额度 如何为 Claude Code 配置 Taotoken 的稳定 API 连接 Claude Code 作为一款强大的 AI 编程助手,其原生服务在某些地区可…...