使用 prometheus client SDK 暴露指标
目录
- 1. 使用 prometheus client SDK 暴露指标
- 1.1. How Go exposition works
- 1.2. Adding your own metrics
- 1.3. Other Go client features
- 2. Golang Application monitoring using Prometheus
- 2.1. Metrics and Labels
- 2.2. Metrics Types
- 2.2.1. Counters:
- 2.2.2. Gauges:
- 2.2.3. Histograms:
- 2.2.4. Summaries
- 2.3. Setting Up Our Go Project
- 2.4. Adding metrics to the application
- 2.5. Dockerizing the application
- 2.6. Visualizing metrics using Grafana
1. 使用 prometheus client SDK 暴露指标
1.1. How Go exposition works
To expose Prometheus metrics in a Go application, you need to provide a /metrics HTTP endpoint. You can use the prometheus/promhttp library’s HTTP Handler as the handler function.
This minimal application, for example, would expose the default metrics for Go applications via http://localhost:2112/metrics:
package mainimport ("net/http""github.com/prometheus/client_golang/prometheus/promhttp"
)func main() {http.Handle("/metrics", promhttp.Handler())http.ListenAndServe(":2112", nil)
}
To start the application:
go run main.go
To access the metrics:
curl http://localhost:2112/metrics
1.2. Adding your own metrics
The application above exposes only the default Go metrics. You can also register your own custom application-specific metrics. This example application exposes a myapp_processed_ops_total counter that counts the number of operations that have been processed thus far. Every 2 seconds, the counter is incremented by one.
package mainimport ("net/http""time""github.com/prometheus/client_golang/prometheus""github.com/prometheus/client_golang/prometheus/promauto""github.com/prometheus/client_golang/prometheus/promhttp"
)func recordMetrics() {go func() {for {opsProcessed.Inc()time.Sleep(2 * time.Second)}}()
}var (opsProcessed = promauto.NewCounter(prometheus.CounterOpts{Name: "myapp_processed_ops_total",Help: "The total number of processed events",})
)func main() {recordMetrics()http.Handle("/metrics", promhttp.Handler())http.ListenAndServe(":2112", nil)
}
In the metrics output, you’ll see the help text, type information, and current value of the myapp_processed_ops_total counter:
# HELP myapp_processed_ops_total The total number of processed events
# TYPE myapp_processed_ops_total counter
myapp_processed_ops_total 5
You can configure a locally running Prometheus instance to scrape metrics from the application. Here’s an example prometheus.yml configuration:
scrape_configs:
- job_name: myappscrape_interval: 10sstatic_configs:- targets:- localhost:2112
1.3. Other Go client features
In this guide we covered just a small handful of features available in the Prometheus Go client libraries. You can also expose other metrics types, such as gauges and histograms, non-global registries, functions for pushing metrics to Prometheus PushGateways, bridging Prometheus and Graphite, and more.
2. Golang Application monitoring using Prometheus
In this article, you will learn the basics of Prometheus including what metrics are, the different types of metrics and when they are used. After that, you will expose metrics of a Golang application and visualize them using Grafana.
To ensure our applications’ quality, some kind of quality monitoring and quality checks need to be executed. These quality checks often compare a given metric captured from the application e.g. throughput or error rate, with some defined value e.g. error rate < 0,1%.
Prometheus is an open source monitoring and alerting tool that helps us to collect and expose these metrics from our application in an easy and reliable way.
In this article, you will learn the basics of Prometheus including what metrics are, the different types of metrics and when they are used. After that, you will expose metrics of a Golang application and visualize them using Grafana.
2.1. Metrics and Labels
Simply put, metrics measure a particular value e.g. the response time of your application over time. Once the metrics are exposed from the application using some kind of instrumented system Prometheus stores them in a time-series database and makes them promptly available using queries.
# Total number of HTTP request
http_requests_total# Response status of HTTP request
response_status# Duration of HTTP requests in seconds
http_response_time_seconds
If you have more than one service for a specific metric you can add a label to specify which service the metric is from. For example, you could add a service label to the http_requests_total metric to differentiate between each service’s request. Another useful metric would be the URL of the different response statuses:
# Total number of HTTP request
http_requests_total{service="builder"}# Response status of HTTP request
response_status{path="/"}
response_status{path="/articles"}
Augmenting metrics with the correct labels will make it easy to query them, especially when you have many different services.
2.2. Metrics Types
Prometheus provides four different metric types each with their advantages and disadvantages that make them useful for different use-cases. In this part of the article we are going to take a close look at all four of them.
2.2.1. Counters:
Counters are a simple metric type that can only be incremented or be reset to zero on restart. It is often used to count primitive data like the total number of requests to a services or number of tasks completed. Most counters are therefore named using the _total suffix e.g. http_requests_total.
# Total number of HTTP request
http_requests_total# Total number of completed jobs
jobs_completed_total
The absolute value of these counters is often irrelevant and does not give you much information about the applications state. The real information can be gathered by their evolution over time which can be obtained using the rate() function.
2.2.2. Gauges:
Gauges also represent a single numerical value but different to counters the value can go up as well as down. Therefore gauges are often used for measured values like temperature, humidy or current memory usage.
Unlike with counters the current value of a gauge is meaningful and can be directly used in graphs and tests.
2.2.3. Histograms:
Histograms are used to measure the frequency of value observations that fall into specific predefined buckets. This means that they will provide information about the distribution of a metric like response time and signal outliers.
By default Prometheus provides the following buckets: .005, .01, .025, .05, .075, .1, .25, .5, .75, 1, 2.5, 5, 7.5, 10. These buckets are not suitable for every measurement and can therefore easily be changed.
2.2.4. Summaries
Summaries are very similar to Histograms because they both expose the distribution of a given data set. The one major difference is that a Histogram estimate quantiles on the Prometheus server while Summaries are calculated on the client side.
Summaries are more accurate for some pre-defined quantiles but can be a lot more resource expensive because of the client-side calculations. That is why it is recommended to use Histograms for most use-cases.
2.3. Setting Up Our Go Project
Before we can use Prometheus, we first need to build a simple application to expose some basic metrics. For this, we will build a simple Golang HTTP server that serves a static HTML and CSS file when accessing localhost:9000.
Let’s start by creating the files needed for the project. This can be done using the following commands:
mkdir static
touch main.go Dockerfile static/index.html
The HTTP server is written using Mux and will serve the static directory containing the HTML and CSS file you created above.
package mainimport ("fmt""github.com/gorilla/mux""log""net/http"
)func main() {router := mux.NewRouter()// Serving static filesrouter.PathPrefix("/").Handler(http.FileServer(http.Dir("./static/")))fmt.Println("Serving requests on port 9000")err := http.ListenAndServe(":9000", router)log.Fatal(err)
}
The HTML file will only contain an H1 tag with “Hello World!” as its content and import a CSS file.
<html>
<head><title>Hello server</title><link rel="stylesheet" href="style.css"/>
</head>
<body>
<div><h1>Hello World!</h1>
</div>
</body>
</html>
2.4. Adding metrics to the application
Now that the application’s basic functionality is finished, we can start exposing metrics that Prometheus will later scrape. The official Golang Prometheus library automatically exposes some build-in metrics and simply needs to be imported and added to the HTTP server.
package mainimport ("fmt""github.com/gorilla/mux""log""net/http""github.com/prometheus/client_golang/prometheus/promhttp"
)func main() {router := mux.NewRouter()// Serving static filesrouter.PathPrefix("/").Handler(http.FileServer(http.Dir("./static/")))// Prometheus endpointrouter.Path("/prometheus").Handler(promhttp.Handler())fmt.Println("Serving requests on port 9000")err := http.ListenAndServe(":9000", router)log.Fatal(err)
}
Now that we have added the Prometheus library and exposed the handler on /prometheus we can see the metrics by starting the application and navigating to localhost:9000/prometheus. The output should look similar to this:
# HELP go_gc_duration_seconds A summary of the pause duration of garbage collection cycles.
# TYPE go_gc_duration_seconds summary
go_gc_duration_seconds{quantile="0"} 2.07e-05
go_gc_duration_seconds{quantile="0.25"} 7.89e-05
go_gc_duration_seconds{quantile="0.5"} 0.000137
go_gc_duration_seconds{quantile="0.75"} 0.0001781
go_gc_duration_seconds{quantile="1"} 0.0002197
go_gc_duration_seconds_sum 0.0071928
go_gc_duration_seconds_count 56
# HELP go_goroutines Number of goroutines that currently exist.
# TYPE go_goroutines gauge
go_goroutines 8
# HELP go_info Information about the Go environment.
# TYPE go_info gauge
go_info{version="go1.15"} 1
# HELP go_memstats_alloc_bytes Number of bytes allocated and still in use.
# TYPE go_memstats_alloc_bytes gauge
go_memstats_alloc_bytes 4.266136e+06
# HELP go_memstats_alloc_bytes_total Total number of bytes allocated, even if freed.
# TYPE go_memstats_alloc_bytes_total counter
go_memstats_alloc_bytes_total 1.17390144e+08
# HELP go_memstats_buck_hash_sys_bytes Number of bytes used by the profiling bucket hash table.
# TYPE go_memstats_buck_hash_sys_bytes gauge
go_memstats_buck_hash_sys_bytes 1.456289e+06
# HELP go_memstats_frees_total Total number of frees.
# TYPE go_memstats_frees_total counter
go_memstats_frees_total 435596
# HELP go_memstats_gc_cpu_fraction The fraction of this program's available CPU time used by the GC since the program started.
# TYPE go_memstats_gc_cpu_fraction gauge
go_memstats_gc_cpu_fraction 1.5705717722141224e-06
# HELP go_memstats_gc_sys_bytes Number of bytes used for garbage collection system metadata.
# TYPE go_memstats_gc_sys_bytes gauge
go_memstats_gc_sys_bytes 4.903096e+06
# HELP go_memstats_heap_alloc_bytes Number of heap bytes allocated and still in use.
# TYPE go_memstats_heap_alloc_bytes gauge
go_memstats_heap_alloc_bytes 4.266136e+06
# HELP go_memstats_heap_idle_bytes Number of heap bytes waiting to be used.
# TYPE go_memstats_heap_idle_bytes gauge
go_memstats_heap_idle_bytes 6.1046784e+07
# HELP go_memstats_heap_inuse_bytes Number of heap bytes that are in use.
# TYPE go_memstats_heap_inuse_bytes gauge
go_memstats_heap_inuse_bytes 5.210112e+06
# HELP go_memstats_heap_objects Number of allocated objects.
# TYPE go_memstats_heap_objects gauge
go_memstats_heap_objects 17572
# HELP go_memstats_heap_released_bytes Number of heap bytes released to OS.
# TYPE go_memstats_heap_released_bytes gauge
go_memstats_heap_released_bytes 6.0588032e+07
# HELP go_memstats_heap_sys_bytes Number of heap bytes obtained from system.
# TYPE go_memstats_heap_sys_bytes gauge
go_memstats_heap_sys_bytes 6.6256896e+07
# HELP go_memstats_last_gc_time_seconds Number of seconds since 1970 of last garbage collection.
# TYPE go_memstats_last_gc_time_seconds gauge
go_memstats_last_gc_time_seconds 1.61550102568985e+09
# HELP go_memstats_lookups_total Total number of pointer lookups.
# TYPE go_memstats_lookups_total counter
go_memstats_lookups_total 0
# HELP go_memstats_mallocs_total Total number of mallocs.
# TYPE go_memstats_mallocs_total counter
go_memstats_mallocs_total 453168
# HELP go_memstats_mcache_inuse_bytes Number of bytes in use by mcache structures.
# TYPE go_memstats_mcache_inuse_bytes gauge
go_memstats_mcache_inuse_bytes 27776
# HELP go_memstats_mcache_sys_bytes Number of bytes used for mcache structures obtained from system.
# TYPE go_memstats_mcache_sys_bytes gauge
go_memstats_mcache_sys_bytes 32768
# HELP go_memstats_mspan_inuse_bytes Number of bytes in use by mspan structures.
# TYPE go_memstats_mspan_inuse_bytes gauge
go_memstats_mspan_inuse_bytes 141576
# HELP go_memstats_mspan_sys_bytes Number of bytes used for mspan structures obtained from system.
# TYPE go_memstats_mspan_sys_bytes gauge
go_memstats_mspan_sys_bytes 147456
# HELP go_memstats_next_gc_bytes Number of heap bytes when next garbage collection will take place.
# TYPE go_memstats_next_gc_bytes gauge
go_memstats_next_gc_bytes 6.42088e+06
# HELP go_memstats_other_sys_bytes Number of bytes used for other system allocations.
# TYPE go_memstats_other_sys_bytes gauge
go_memstats_other_sys_bytes 1.931943e+06
# HELP go_memstats_stack_inuse_bytes Number of bytes in use by the stack allocator.
# TYPE go_memstats_stack_inuse_bytes gauge
go_memstats_stack_inuse_bytes 851968
# HELP go_memstats_stack_sys_bytes Number of bytes obtained from system for stack allocator.
# TYPE go_memstats_stack_sys_bytes gauge
go_memstats_stack_sys_bytes 851968
# HELP go_memstats_sys_bytes Number of bytes obtained from system.
# TYPE go_memstats_sys_bytes gauge
go_memstats_sys_bytes 7.5580416e+07
# HELP go_threads Number of OS threads created.
# TYPE go_threads gauge
go_threads 13
# HELP process_cpu_seconds_total Total user and system CPU time spent in seconds.
# TYPE process_cpu_seconds_total counter
process_cpu_seconds_total 1.83
# HELP process_max_fds Maximum number of open file descriptors.
# TYPE process_max_fds gauge
process_max_fds 1.048576e+06
# HELP process_open_fds Number of open file descriptors.
# TYPE process_open_fds gauge
process_open_fds 10
# HELP process_resident_memory_bytes Resident memory size in bytes.
# TYPE process_resident_memory_bytes gauge
process_resident_memory_bytes 2.8770304e+07
# HELP process_start_time_seconds Start time of the process since unix epoch in seconds.
# TYPE process_start_time_seconds gauge
process_start_time_seconds 1.61549436213e+09
# HELP process_virtual_memory_bytes Virtual memory size in bytes.
# TYPE process_virtual_memory_bytes gauge
process_virtual_memory_bytes 1.564209152e+09
# HELP process_virtual_memory_max_bytes Maximum amount of virtual memory available in bytes.
# TYPE process_virtual_memory_max_bytes gauge
process_virtual_memory_max_bytes -1
# HELP promhttp_metric_handler_requests_in_flight Current number of scrapes being served.
# TYPE promhttp_metric_handler_requests_in_flight gauge
promhttp_metric_handler_requests_in_flight 1
# HELP promhttp_metric_handler_requests_total Total number of scrapes by HTTP status code.
# TYPE promhttp_metric_handler_requests_total counter
promhttp_metric_handler_requests_total{code="200"} 447
promhttp_metric_handler_requests_total{code="500"} 0
promhttp_metric_handler_requests_total{code="503"} 0
These metrics are great, but they are not very useful most of the time. Instead of low-level metrics, we now want to expose custom metrics that will expose our application’s internal information that we can later visualize or use in tests or health checks.
Let’s start with a rather basic metric: the total number of HTTP requests made to the server represented in a counter.
package mainimport ("fmt""github.com/gorilla/mux""github.com/prometheus/client_golang/prometheus""github.com/prometheus/client_golang/prometheus/promauto""github.com/prometheus/client_golang/prometheus/promhttp""log""net/http""strconv"
)var totalRequests = prometheus.NewCounterVec(prometheus.CounterOpts{Name: "http_requests_total",Help: "Number of get requests.",},[]string{"path"},
)func prometheusMiddleware(next http.Handler) http.Handler {return http.HandlerFunc(func(w http.ResponseWriter, r *http.Request) {rw := NewResponseWriter(w)next.ServeHTTP(rw, r)totalRequests.WithLabelValues(path).Inc()})
}func init() {prometheus.Register(totalRequests)
}func main() {router := mux.NewRouter()router.Use(prometheusMiddleware)// Prometheus endpointrouter.Path("/prometheus").Handler(promhttp.Handler())// Serving static filesrouter.PathPrefix("/").Handler(http.FileServer(http.Dir("./static/")))fmt.Println("Serving requests on port 9000")err := http.ListenAndServe(":9000", router)log.Fatal(err)
}
Let’s break the code changes down for better understanding:
- The metric needs to be created using the prometheus package. The NewCounterVec() method is used to create a new counter metric.
- To expose the created metric in the HTTP handler we must register the metric to Prometheus using the register() method.
- Lastly, we need to implement the functionality of the metric in our code. Here we created and registered a new HTTP middleware that runs every time the server receives an HTTP request and increases the metric counter using the Inc() method.
The following code block contains two more metrics with different metric types: response_status and response_time perspectively.
package mainimport ("fmt""github.com/gorilla/mux""github.com/prometheus/client_golang/prometheus""github.com/prometheus/client_golang/prometheus/promauto""github.com/prometheus/client_golang/prometheus/promhttp""log""net/http""strconv"
)type responseWriter struct {http.ResponseWriterstatusCode int
}func NewResponseWriter(w http.ResponseWriter) *responseWriter {return &responseWriter{w, http.StatusOK}
}func (rw *responseWriter) WriteHeader(code int) {rw.statusCode = coderw.ResponseWriter.WriteHeader(code)
}var totalRequests = prometheus.NewCounterVec(prometheus.CounterOpts{Name: "http_requests_total",Help: "Number of get requests.",},[]string{"path"},
)var responseStatus = prometheus.NewCounterVec(prometheus.CounterOpts{Name: "response_status",Help: "Status of HTTP response",},[]string{"status"},
)var httpDuration = promauto.NewHistogramVec(prometheus.HistogramOpts{Name: "http_response_time_seconds",Help: "Duration of HTTP requests.",
}, []string{"path"})func prometheusMiddleware(next http.Handler) http.Handler {return http.HandlerFunc(func(w http.ResponseWriter, r *http.Request) {route := mux.CurrentRoute(r)path, _ := route.GetPathTemplate()timer := prometheus.NewTimer(httpDuration.WithLabelValues(path))rw := NewResponseWriter(w)next.ServeHTTP(rw, r)statusCode := rw.statusCoderesponseStatus.WithLabelValues(strconv.Itoa(statusCode)).Inc()totalRequests.WithLabelValues(path).Inc()timer.ObserveDuration()})
}func init() {prometheus.Register(totalRequests)prometheus.Register(responseStatus)prometheus.Register(httpDuration)
}func main() {router := mux.NewRouter()router.Use(prometheusMiddleware)// Prometheus endpointrouter.Path("/prometheus").Handler(promhttp.Handler())// Serving static filesrouter.PathPrefix("/").Handler(http.FileServer(http.Dir("./static/")))fmt.Println("Serving requests on port 9000")err := http.ListenAndServe(":9000", router)log.Fatal(err)
}
2.5. Dockerizing the application
Now that the metrics are implemented in the application we can Dockerize the application to make running it with Prometheus easier.
FROM golang:1.15.0# Set the Current Working Directory inside the container
WORKDIR /appRUN export GO111MODULE=on# Copy go mod and sum files
COPY go.mod go.sum ./# Download all dependencies. Dependencies will be cached if the go.mod and go.sum files are not changed
RUN go mod downloadCOPY . .# Build the application
RUN go build -o main .# Expose port 9000 to the outside world
EXPOSE 9000# Command to run the executable
CMD ["./main"]
The Dockerfile will download the dependencies, copy all files and build the application. After completing the Dockerfile, we can put the container and Prometheus into a Docker-Compose file.
version: '3.1'services:golang:build:context: ./dockerfile: Dockerfilecontainer_name: golangrestart: alwaysports:- '9000:9000'prometheus:image: prom/prometheus:v2.24.0volumes:- ./prometheus/:/etc/prometheus/- prometheus_data:/prometheuscommand:- '--config.file=/etc/prometheus/prometheus.yml'- '--storage.tsdb.path=/prometheus'- '--web.console.libraries=/usr/share/prometheus/console_libraries'- '--web.console.templates=/usr/share/prometheus/consoles'ports:- 9090:9090restart: alwaysvolumes:prometheus_data:
The only thing that we need to do now before starting the applications is configuring the Prometheus endpoint. For that, we are going to create a configuration file:
mkdir prometheus
touch prometheus/prometheus.yml
Here we define the URL of the page that Prometheus should scrape the data from, which equals to ContainerIP:Port/prometheus for our application.
global:scrape_interval: 15sevaluation_interval: 15sscrape_configs:- job_name: prometheusstatic_configs:- targets: ['localhost:9090']- job_name: golang metrics_path: /prometheusstatic_configs:- targets:- golang:9000
After adding the configuration we can start the application using docker-compose:
docker-compose up -d
Now we can access Prometheus by visiting localhost:9090 in our browser.

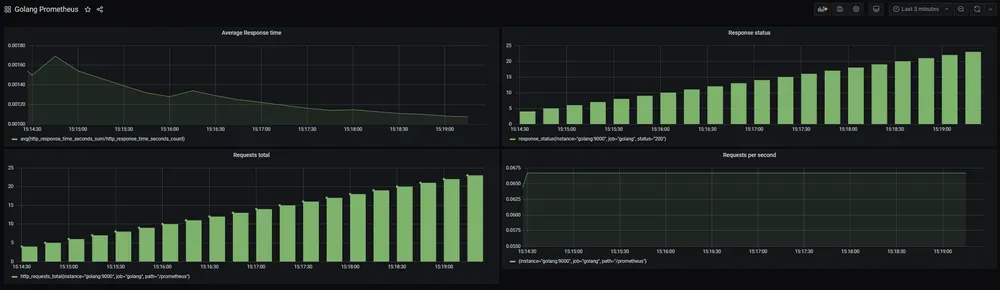
2.6. Visualizing metrics using Grafana
Now that Prometheus successfully collects the metrics, you’ll continue by visualizing the data using Grafana. For that, you’ll need to first start it by adding a Grafana container to your docker-compose file.
version: '3.1'services:grafana:image: grafana/grafana:latestcontainer_name: grafanaports:- "3000:3000"volumes:- grafana-storage:/var/lib/grafanagolang:build:context: ./dockerfile: Dockerfilecontainer_name: golangrestart: alwaysports:- '9000:9000'prometheus:image: prom/prometheus:v2.24.0volumes:- ./prometheus/:/etc/prometheus/- prometheus_data:/prometheuscommand:- '--config.file=/etc/prometheus/prometheus.yml'- '--storage.tsdb.path=/prometheus'- '--web.console.libraries=/usr/share/prometheus/console_libraries'- '--web.console.templates=/usr/share/prometheus/consoles'ports:- 9090:9090restart: alwaysvolumes:grafana-storage:prometheus_data:
After adding the Grafana container and a volume that will save the Grafana configurations and data you can restart docker-compose.
docker-compose up -d
Now that Grafana is started you can access it by visiting http://localhost:3000 in your browser. It will ask you to enter user credentials which defaults are admin as a username and password.

After logging in, you can create a new data source by navigating to Configuration>Data Source and clicking “Add data source”. After that, select Prometheus and then fill in the necessary information.

Once the data source has been successfully added, you can continue by creating a new dashboard to visualize your metrics.

The dashboard consists of panels that let you visualize metrics, so click “Add panel” to start.

Now you can select a metric by specifying it in the metric field: e.g. http_requests_total.

Your dashboard might not display as much data as mine since you have not accessed the application that often. The best way to get more data for testing is using a load testing tool.
I enjoy using the hey load testing tool, an open-source CLI application for load generation, but you can also use other tools. Once you downloaded hey you can generate traffic using the following command.
hey -z 5m -q 5 -m GET -H "Accept: text/html" http://127.0.0.1:9000
You can now experiment with the dashboard by adding other panels with metrics and customize it to your liking. If you want an example dashboard that visualizes all the metrics we have implemented, you can download it from Github and then import it.
相关文章:
使用 prometheus client SDK 暴露指标
目录 1. 使用 prometheus client SDK 暴露指标1.1. How Go exposition works1.2. Adding your own metrics1.3. Other Go client features 2. Golang Application monitoring using Prometheus2.1. Metrics and Labels2.2. Metrics Types2.2.1. Counters:2.2.2. Gauges:2.2.3. …...

Jmeter之BeanShell取出参数进行四则运算,并判断是否正确
首先调用余额接口,使用正则提取响应中的余额字段,记作变量acctBal1做支付交易再次调用余额接口,使用正则提取响应中的余额字段,记作变量acctBal2最后在结果树中可以看到断言错误的信息,断言正确时没有提示以下是beansh…...
)
PYTHON 斗地主发牌 (简易版)
利用方法: 1. random.randint( ) 随机抽取数字 方法 2.random.sample((抽取范围的参数),(抽取的个数)) 返回的是列表 所以用[0]可以输出里面的元素 import random# 1. 创建牌 # 花色 color ["\u2660", "\u2663", "\u2665", "\…...

CSS文本裁剪
对于单行文本裁剪: span {text-overflow:ellipsis;white-space:nowrap;overflow:hidden;display:block; } 对于多行文本裁剪: 在文本容器上定义 CSS Flexbox 属性 display: -webkit-box; 定义要显示的文本行数 -webkit-line-clamp: 4; 添加 -webkit-…...

ClickHouse常见的引擎和使用
1.日志引擎 日志引擎特点 1.数据存储在磁盘上 2.写入时将数据追加在文件末尾 3.不支持突变操作 4.不支持索引 5.非原子地写入数据 6.引擎不支持 ALTER UPDATE 和 ALTER DELETE 操作 建表语法示例 CREATE TABLE [IF NOT EXISTS] [db.]table_name [ON CLUSTER cluster] ( …...

构建之法 - 软件工程实践教学:一线教师的13问
福州大学单红老师的软工课程总结 2020春,不一样的学期不一样的软工实践 单红⽼师在总结中,提出了13条疑惑,《构建之法》的作者邹欣⽼师就单红⽼师提出的每⼀条疑惑,给出了⾃⼰的思考,与他进⾏探讨交流。欢迎你也来参与…...

联调 matlab 遇到的一些事儿
记录当时遇到的问题,因为平时不写 matlab,所以没有深入的理解。 版本兼容 当时遇到的第一个问题就是不同版本 matlab 带来的兼容性问题。同时开发使用的是 2021a 版本,而调试时使用的是 2022b 版本。在新版本中某些函数已被弃用,…...

时序预测 | Matlab实现基于GRNN广义回归神经网络的电力负荷预测模型
文章目录 效果一览文章概述源码设计参考资料效果一览 文章概述 时序预测 | Matlab实现基于GRNN广义回归神经网络的电力负荷预测模型 1.Matlab实现基于GRNN广义回归神经网络的电力负荷预测模型 2.单变量时间序列预测; 3.多指标评价,评价指标包括:R2、MAE、MBE等,代码质量极高…...
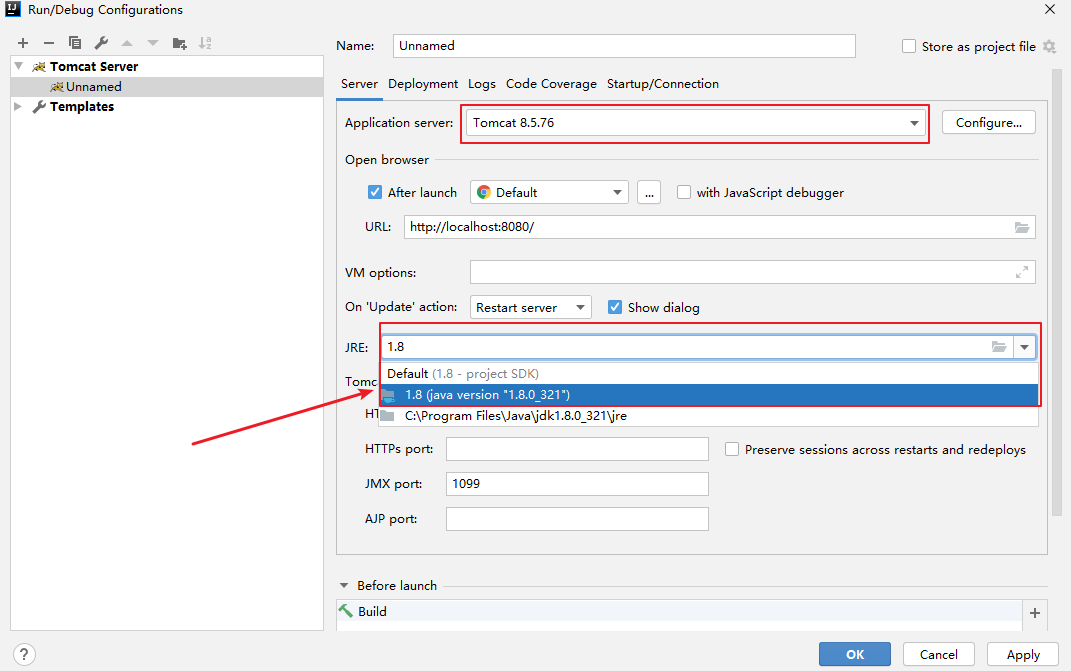
3.2 Tomcat基础
1. Tomcat概述 Tomcat 服务器是一个免费的开放源代码的Web 应用服务器,属于轻量级应用服务器。 Tomcat版本:apache-tomcat-8.5.76。 2.IDEA集成Tomcat 第一步 第二步 第三步 编辑切换为居中 添加图片注释,不超过 140 字࿰…...
认识http的方法、Header、状态码以及简单实现一个http的业务逻辑
文章目录 http的方法http状态码http重定向http常见Header实现简单业务逻辑Protocol.hppUtil.hppServer.hppServer.cc 效果 http的方法 方法说明支持的HTTP版本GET获取资源1.0/1.1POST传输实体主体1.0/1.1PUT传输文件1.0/1.1HEAD获得报文首部1.0/1.1DELETE删除文件1.0/1.1OPTIO…...

Faiss在windows下安装和使用
pip install faiss-cpu 直接安装可能出现问题: error: command swig.exe failed: No such file or directory 安装swig即可解决,安装方式...
【JavaEE进阶】SpringBoot项目的创建
文章目录 一. SpringBoot简介1. 什么是SpringBoot?2. SpringBoot的优点 二. SpringBoot项目创建1. 使用IDEA创建2. 使用网页创建SpringBoot项目 三. 运行SpringBoot项目 一. SpringBoot简介 1. 什么是SpringBoot? Spring Boot 是一个用于快速构建基于 Spring 框架的应用程序…...
)
c++二进制转化十进制代码(小数)
#include <bits/stdc.h> using namespace std; int mid; double er_shi(string a){int lena;double sum0;int p0;int q-1;int yn1;//判断是否小数 lenaa.length();//字符串长度 for(int i0;i<lena;i){if(a[i].){midi;yn0;break;} }if(yn0){for(int jmid-1;j>0;j--…...

07_ansible, 条件选择、加载客户事件、在roles和includes上面应用’when’语句、条件导入、基于变量选择文件和模版、注册变量
10.条件选择 10.1.When语句 10.2.加载客户事件 10.3.在roles和includes上面应用’when’语句 10.4.条件导入 10.5.基于变量选择文件和模版 10.6.注册变量 10.条件选择 转自:http://www.ansible.com.cn/docs/playbooks_conditionals.html#id3 常常来说,一个play的…...

4个简化IT服务台任务的ChatGPT功能
最近几个月,ChatGPT 风靡全球,这是一个 AI 聊天机器人,使用户能够生成脚本、文章、锻炼图表等。这项技术在各行各业都有无穷无尽的应用,在本文中,我们将研究这种现代技术如何帮助服务台团队增强服务交付和客户体验。 什…...
群晖7.X版安装cpolar内网穿透
群晖7.X版安装cpolar内网穿透套件 文章目录 群晖7.X版安装cpolar内网穿透套件前言1. 下载cpolar的群晖系统套件1.1 在“套件中心” 选择“手动安装”1.2 完成套件安装 2. 进入cpolar软件信息页3. 点击“免费注册”轻松获得cpolar账号 前言 随着群晖系统的更新换代,…...

[保研/考研机试] KY183 素数 北京航空航天大学复试上机题 C++实现
题目链接: 素数https://www.nowcoder.com/share/jump/437195121691718444910 描述 输入一个整数n(2<n<10000),要求输出所有从1到这个整数之间(不包括1和这个整数)个位为1的素数,如果没有则输出-1。 输入描述: 输入有多…...
Java基础入门篇——IDEA开发第一个入门程序(五)
目录 一、IDEA层级结构分类 二、IDEA层级结构介绍 三、IDEA层级关系 四、创建IDEA中的第一个代码 一、IDEA层级结构分类 IntelliJ IDEA的项目结构主要分为以下几个层级: Project: 项目Module: 模块Package: 包Class: 类 一个项目里面…...
系统学习Linux-Redis基础
一、redis概述 NoSQL(非关系型数据库、内存存储) 类型 文档型数据库(Document-oriented database)如MongoDB; 列族数据库(Column-family database)如HBase、Cassandra等; 图形数…...
)
实现缓存el-table分页大小,用户新建标签打开该页面需保持分页大小(考虑是否为嵌入式页面)
需求:每个表格的分页大小 以本地缓存的方式存到浏览器本地,然后用户下次打开的时候 获取这个本地存储的值 如果没有就用页面默认的值,如果有 则先判断是不是有效的(是) 无效用默认 有效就用这个缓存值,需要区分是否为嵌入式页面 分析…...
)
ZYNQ实战:手把手教你用LWIP实现UDP文件传输到DDR(附完整代码)
ZYNQ LWIP UDP文件传输实战:从协议栈配置到DDR存储的完整实现 在嵌入式系统开发中,网络通信功能已成为现代SoC设计的标配能力。Xilinx ZYNQ系列凭借其ARM处理器与可编程逻辑的完美结合,为开发者提供了灵活高效的网络通信解决方案。本文将深入…...
)
Vue3 + AntV X6 实战:从零封装一个可拖拽连线的关系图组件(附完整代码)
Vue3 AntV X6 实战:封装高可定制的关系图组件 在复杂业务系统中,可视化关系图谱正成为不可或缺的交互界面。本文将带你从零构建一个生产级的关系图组件,基于Vue3和AntV X6实现节点拖拽、动态连线、自动布局等核心功能,最终封装成…...
)
告别手写报告!手把手教你用LIS系统搞定医院检验科全流程条码管理(附实战避坑点)
告别手写报告!手把手教你用LIS系统搞定医院检验科全流程条码管理(附实战避坑点) 在三级医院检验科工作多年的张主任最近终于松了一口气——自从上线LIS系统的全流程条码管理功能后,科室的标本差错率从每月15例骤降到2例以内。这个…...
)
手把手教你用VSCode+MCUXpresso搭建i.MX RT1062开发环境(附RT-Thread Nano移植)
手把手教你用VSCodeMCUXpresso搭建i.MX RT1062开发环境(附RT-Thread Nano移植) 当你第一次拿到i.MX RT1062开发板时,可能会被它强大的性能所震撼——这颗600MHz主频的Cortex-M7内核MCU,性能直逼某些应用处理器。但随之而来的问题是…...

从Java转行大模型应用,基于 BLIP 的图生文实战案例
一、项目简介 BLIP 是 Salesforce 开源的多模态视觉语言模型,兼顾图像理解、图文检索、图像字幕(Image Caption)、VQA 视觉问答等能力。本案例实现:输入任意图片 → 自动生成精准自然的中文 / 英文描述文案,轻量化部署…...

**链路追踪实战:用Go语言打造分布式系统的“心跳图谱”**在微服务架构日益普及的今天,一
链路追踪实战:用Go语言打造分布式系统的“心跳图谱” 在微服务架构日益普及的今天,一个请求可能跨越多个服务、几十个中间件甚至上百个节点。当问题出现时,传统的日志排查方式早已力不从心。这时,链路追踪(Tracing&am…...

W25Q128 SPI Flash读写速度实测:对比标准、双线、四线模式,你的代码可能拖了后腿
W25Q128 SPI Flash读写速度实测:对比标准、双线、四线模式,你的代码可能拖了后腿 在嵌入式开发中,存储性能往往是制约系统整体效率的关键瓶颈。W25Q128作为一款128M-bit容量的SPI Flash芯片,凭借其出色的性价比和灵活性࿰…...

137. 集群或节点配置卡在节点污染“node.cloudprovider.kubernetes.io/uninitialized”
During the provisioning of RKE2 clusters, the machines are stuck with the status waiting for cluster agent. The rke2-server service is running and pods are being created, but a number of them are in a pending state due to scheduling errors. 在配置 RKE2 集…...

机器学习降维技术:原理、实践与优化指南
1. 降维技术概述:为什么我们需要压缩数据? 在机器学习项目中,我们常常会遇到成百上千个特征的数据集。想象你正在整理一个塞满各种工具的工具箱——螺丝刀、扳手、锤子散落各处,每次找工具都要翻遍整个箱子。降维技术就像是给这个…...

避开这些坑!S7-1200通过RS485读写RFID标签数据时的5个常见故障与解决方案
避开这些坑!S7-1200通过RS485读写RFID标签数据时的5个常见故障与解决方案 当S7-1200 PLC通过RS485接口与RFID读写器通信时,即使按照手册完成了硬件连接和软件配置,工程师们仍可能遇到各种"幽灵问题"。本文将从实际项目经验出发&…...