echart 3d立体颜色渐变柱状图
如果可以实现记得点赞分享,谢谢老铁~
1.需求描述
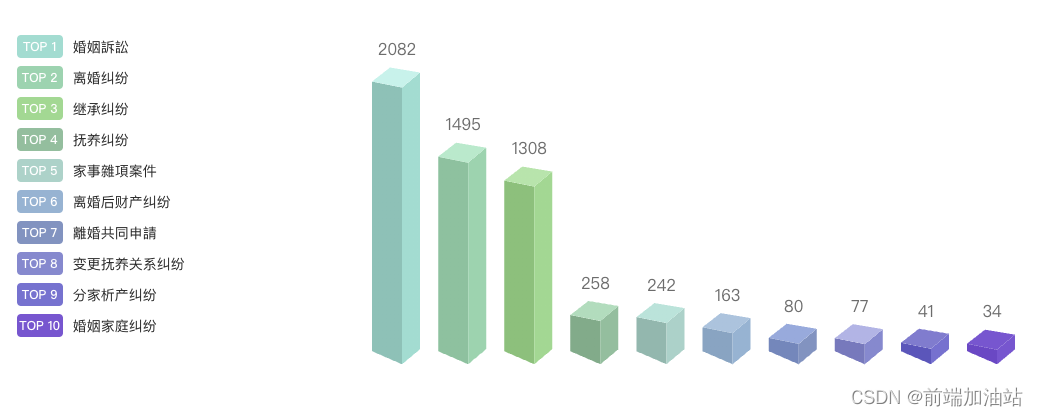
根据业务需求将不同的法律法规,展示不同的3d立体渐变柱状图。
2.先看下效果图
3. 确定三面的颜色,这里我是自定义的颜色
// 右面生成颜色const rightColorArr = ref(["#79DED1",...]);// 左面生成颜色const leftColorArr = ref(["#67C3B7", ...]);// 顶部生成颜色const topColorArr = ref(["#ADF4EB",...]);4.然后绘画三个面对应的函数,且注册
// 绘制左侧面const CubeLeft = echarts.graphic.extendShape({});// 绘制右侧面const CubeRight = echarts.graphic.extendShape({});// 绘制顶面const CubeTop = echarts.graphic.extendShape({});// 注册三个面图形echarts.graphic.registerShape("CubeLeft", CubeLeft);echarts.graphic.registerShape("CubeRight", CubeRight);echarts.graphic.registerShape("CubeTop", CubeTop);
5.重点在renderItem 自定义渲染函数上
series: [{type: "custom",renderItem: (params, api) => {let cubeLeftStyle: any = "";let cubeRightStyle: any = "";let cubeTopStyle: any = "";cubeLeftStyle = new echarts.graphic.LinearGradient(0, 0, 0, 1, [{offset: 0,color: leftColorArr.value[params.dataIndex],},{offset: 1,color: leftColorArr.value[params.dataIndex],},]);cubeRightStyle = new echarts.graphic.LinearGradient(0, 0, 0, 1, [{offset: 0,color: rightColorArr.value[params.dataIndex],},{offset: 1,color: rightColorArr.value[params.dataIndex],},]);cubeTopStyle = new echarts.graphic.LinearGradient(0, 0, 0, 1, [{offset: 0,color: topColorArr.value[params.dataIndex],},{offset: 1,color: topColorArr.value[params.dataIndex],},]);const location = api.coord([api.value(0), api.value(1)]);return {type: "group",children: [{type: "CubeLeft",shape: {api,xValue: api.value(0),yValue: api.value(1),x: location[0],y: location[1],xAxisPoint: api.coord([api.value(0), -80]),},style: {fill: cubeLeftStyle,},},{type: "CubeRight",shape: {api,xValue: api.value(0),yValue: api.value(1),x: location[0],y: location[1],xAxisPoint: api.coord([api.value(0), -80]),},style: {fill: cubeRightStyle,},},{type: "CubeTop",shape: {api,xValue: api.value(0),yValue: api.value(1),x: location[0],y: location[1],xAxisPoint: api.coord([api.value(0), -50]),},style: {fill: cubeTopStyle,},},],};},data: valList.value,},],
5.最后看全文吧,这个是vue3 的文件
<template><div class="topCon"><div class="tagList left"><div class="item" v-for="(item, index) in nameList" :key="index"><a-tag :color="rightColorArr[index]" class="tag">TOP {{ index + 1 }}</a-tag><span>{{ item }}</span></div></div><div class="right" id="AnalysisLegalTopBar" style="height: 400px"></div></div>
</template>
<script lang="ts">
import { onMounted, toRefs, ref, watch } from "vue";
import * as echarts from "echarts";
type EChartsOption = echarts.EChartsOption;
export default {props: {data: Array,},setup(props) {const { data } = toRefs<any>(props);const myChart = ref<any>(null);let valList = ref<any>([]);let nameList = ref<any>([]);// 右面生成颜色const rightColorArr = ref(["#79DED1","#75D5AF","#7FD991","#78BF9D","#95D3C9","#84B5D3","#7794C1","#828AD0","#7573D1","#8057D1",]);// 左面生成颜色const leftColorArr = ref(["#67C3B7","#68C39F","#68C27A","#65AD8A","#7BB8AE","#76A6C3","#6789BC","#737ABE","#5A58BC","#7349C6",]);// 顶部生成颜色const topColorArr = ref(["#ADF4EB","#9BEBCC","#9DE6AB","#98DEBD","#A1E5DA","#9DC5DE","#8CACDD","#B0B5E6","#7F7DD0","#8057D1",]);// 绘制左侧面const CubeLeft = echarts.graphic.extendShape({shape: {x: 0,y: 0,},buildPath: function (ctx: any, shape) {// 会canvas的应该都能看得懂,shape是从custom传入的const xAxisPoint = shape.xAxisPoint;const c0 = [shape.x + 7, shape.y];const c1 = [shape.x - 23, shape.y - 6];const c2 = [xAxisPoint[0] - 23, xAxisPoint[1] - 13];const c3 = [xAxisPoint[0] + 7, xAxisPoint[1]];ctx.moveTo(c0[0], c0[1]).lineTo(c1[0], c1[1]).lineTo(c2[0], c2[1]).lineTo(c3[0], c3[1]).closePath();},});// 绘制右侧面const CubeRight = echarts.graphic.extendShape({shape: {x: 0,y: 0,},buildPath: function (ctx: any, shape) {const xAxisPoint = shape.xAxisPoint;const c1 = [shape.x + 7, shape.y];const c2 = [xAxisPoint[0] + 7, xAxisPoint[1]];const c3 = [xAxisPoint[0] + 25, xAxisPoint[1] - 15];const c4 = [shape.x + 25, shape.y - 15];ctx.moveTo(c1[0], c1[1]).lineTo(c2[0], c2[1]).lineTo(c3[0], c3[1]).lineTo(c4[0], c4[1]).closePath();},});// 绘制顶面const CubeTop = echarts.graphic.extendShape({shape: {x: 0,y: 0,},buildPath: function (ctx: any, shape) {const c1 = [shape.x + 7, shape.y];const c2 = [shape.x + 25, shape.y - 15]; //右点const c3 = [shape.x - 5, shape.y - 20];const c4 = [shape.x - 23, shape.y - 6];ctx.moveTo(c1[0], c1[1]).lineTo(c2[0], c2[1]).lineTo(c3[0], c3[1]).lineTo(c4[0], c4[1]).closePath();},});// 注册三个面图形echarts.graphic.registerShape("CubeLeft", CubeLeft);echarts.graphic.registerShape("CubeRight", CubeRight);echarts.graphic.registerShape("CubeTop", CubeTop);const getOption = () => {return {backgroundColor: "transparent",title: {// text: "单位:个",textStyle: {color: "#79DED1",fontWeight: "800",fontSize: 16,},left: "18px",top: "1%",},tooltip: {trigger: "axis",axisPointer: {type: "shadow",},formatter: function (params, ticket, callback) {const item = params[1];return item.name + " : " + item.value;},},grid: {top: "12%",bottom: "3%",left: "left",containLabel: true,},xAxis: {type: "category",show: false,data: nameList.value,axisLine: {show: true,lineStyle: {color: "#7ebaf2",},},axisTick: {show: false,length: 9,alignWithLabel: true,lineStyle: {color: "#7DFFFD",},},axisLabel: {fontSize: 12,},},yAxis: {type: "value",show: false,min: 0,axisLine: {show: true,lineStyle: {color: "#7ebaf2",},},splitLine: {show: false,},splitArea: {show: true,areaStyle: {color: ["rgba(26,50,83,1)", "rgba(30,57,92,1)"],},},axisTick: {show: false,},axisLabel: {fontSize: 12,},boundaryGap: ["20%", "20%"],},series: [{type: "custom",renderItem: (params, api) => {let cubeLeftStyle: any = "";let cubeRightStyle: any = "";let cubeTopStyle: any = "";cubeLeftStyle = new echarts.graphic.LinearGradient(0, 0, 0, 1, [{offset: 0,color: leftColorArr.value[params.dataIndex],},{offset: 1,color: leftColorArr.value[params.dataIndex],},]);cubeRightStyle = new echarts.graphic.LinearGradient(0, 0, 0, 1, [{offset: 0,color: rightColorArr.value[params.dataIndex],},{offset: 1,color: rightColorArr.value[params.dataIndex],},]);cubeTopStyle = new echarts.graphic.LinearGradient(0, 0, 0, 1, [{offset: 0,color: topColorArr.value[params.dataIndex],},{offset: 1,color: topColorArr.value[params.dataIndex],},]);const location = api.coord([api.value(0), api.value(1)]);return {type: "group",children: [{type: "CubeLeft",shape: {api,xValue: api.value(0),yValue: api.value(1),x: location[0],y: location[1],xAxisPoint: api.coord([api.value(0), -80]),},style: {fill: cubeLeftStyle,},},{type: "CubeRight",shape: {api,xValue: api.value(0),yValue: api.value(1),x: location[0],y: location[1],xAxisPoint: api.coord([api.value(0), -80]),},style: {fill: cubeRightStyle,},},{type: "CubeTop",shape: {api,xValue: api.value(0),yValue: api.value(1),x: location[0],y: location[1],xAxisPoint: api.coord([api.value(0), -50]),},style: {fill: cubeTopStyle,},},],};},data: valList.value,},{type: "bar",label: {normal: {show: true,position: "top",fontSize: 16,color: "#6C6C6C",offset: [2, -25],},},itemStyle: {color: "transparent",},tooltip: {},data: valList.value,},],};};watch(() => data.value,(list) => {let option_bar: any = getOption();list.forEach((item, index) => {nameList.value.push(item.name);valList.value.push(item.value);});option_bar && myChart.value.setOption(option_bar);});onMounted(() => {// 基于准备好的dom,初始化echarts实例var chartDom: any = document.getElementById("AnalysisLegalTopBar");myChart.value = echarts.init(chartDom);window.addEventListener("resize", () => {myChart.value.resize();});});return {nameList,rightColorArr,};},
};
</script>
<style lang="less" scoped>
.topCon {display: flex;justify-content: center;align-items: center;.left {width: 30%;.item {display: flex;align-items: center;}}.right {width: 70%;}.tagList {.tag {width: 46px;height: 23px;border-radius: 4px;font-size: 10px;font-weight: 500;line-height: 20px;margin: 4px 0px;margin-right: 10px;color: #fff;background: rgba(121, 222, 209, 0.39);display: flex;justify-content: center;align-items: center;}}
}
</style>
收工!谢谢老铁们的点赞收藏~
相关文章:
echart 3d立体颜色渐变柱状图
如果可以实现记得点赞分享,谢谢老铁~ 1.需求描述 根据业务需求将不同的法律法规,展示不同的3d立体渐变柱状图。 2.先看下效果图 3. 确定三面的颜色,这里我是自定义的颜色 // 右面生成颜色const rightColorArr ref(["#79D…...

linux shell变量
linux shell变量 1、变量命名规则2、只读变量3、删除变量 1、变量命名规则 变量名不能加$命名只能使用英文字母、数字和下划线,首个字母不能以数字开头中间不能有空格。可以有下划线不能使用标点符号不能使用bash中的关键字 username"tom"引用 $userna…...
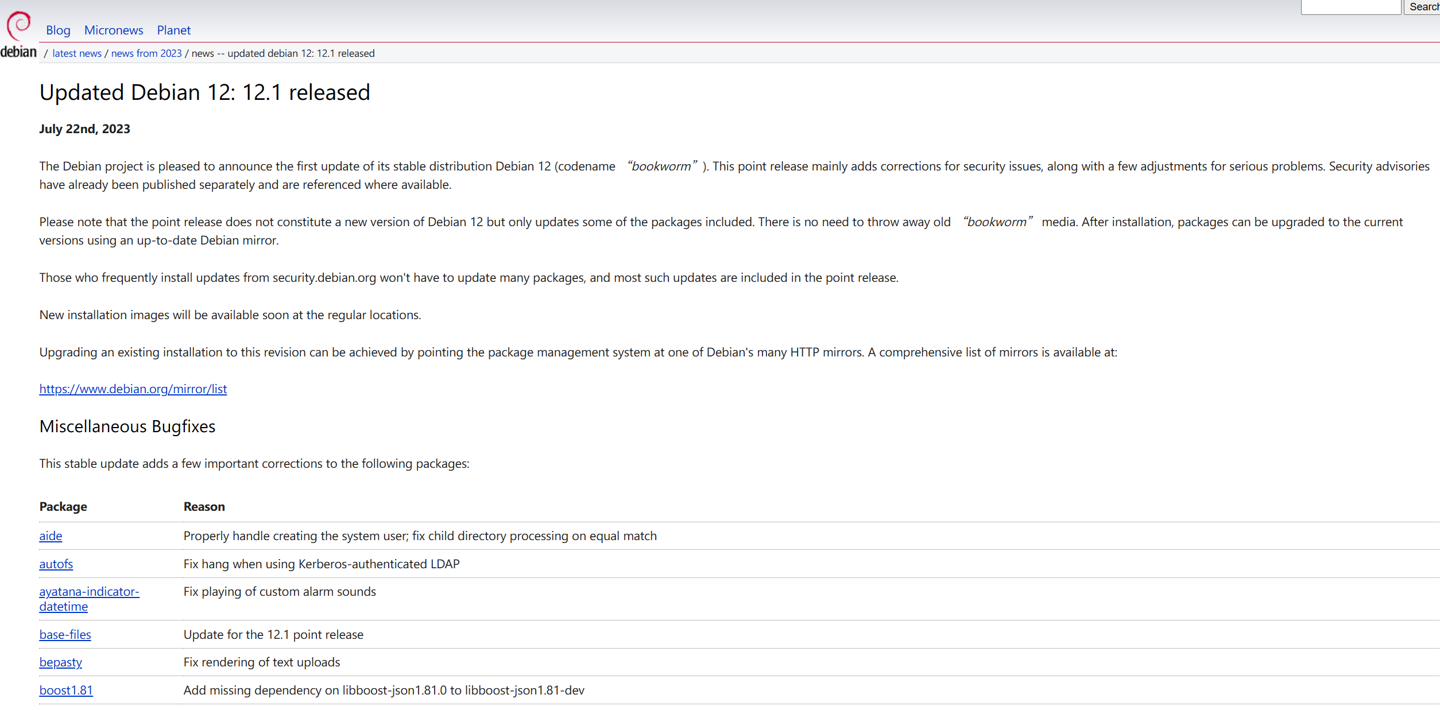
Linux 发行版 Debian 12.1 发布
在今年 6 月初,Debian 12“bookworm”发布,而日前 Debian 迎来了 12.1 版本,主要修复系统用户创建等多个安全问题。 Debian 是最古老的 GNU / Linux 发行版之一,也是许多其他基于 Linux 的操作系统的基础,包括 Ubuntu…...
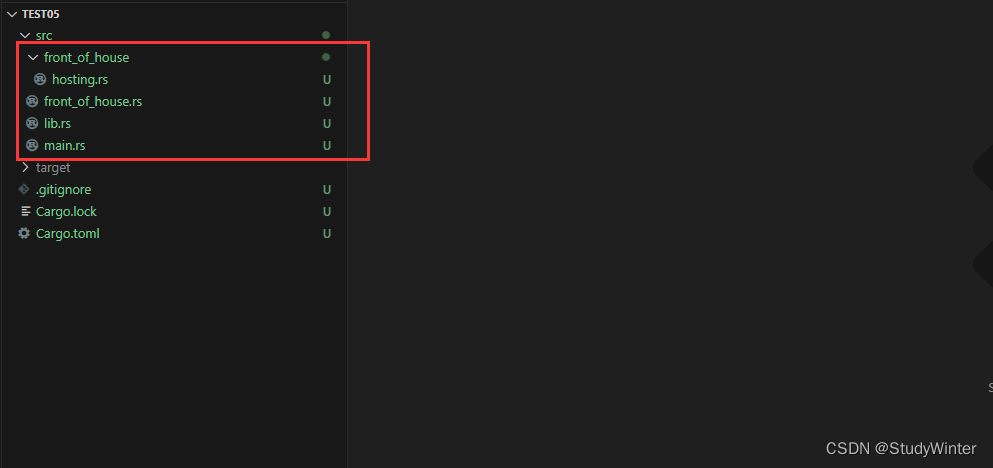
【Rust】Rust学习 第七章使用包、Crate和模块管理不断增长的项目
目前为止,我们编写的程序都在一个文件的一个模块中。伴随着项目的增长,你可以通过将代码分解为多个模块和多个文件来组织代码。一个包可以包含多个二进制 crate 项和一个可选的 crate 库。伴随着包的增长,你可以将包中的部分代码提取出来&…...

网站SSL安全证书是什么及其重要性
网站SSL安全证书具体来说是一个数字文件,是由受信任的数字证书颁发机构(CA机构)进行审核颁发的,其中包含CA发布的信息,该信息表明该网站已使用加密连接进行了安全保护。 网站SSL安全证书也被称为SSL证书、https证书和…...
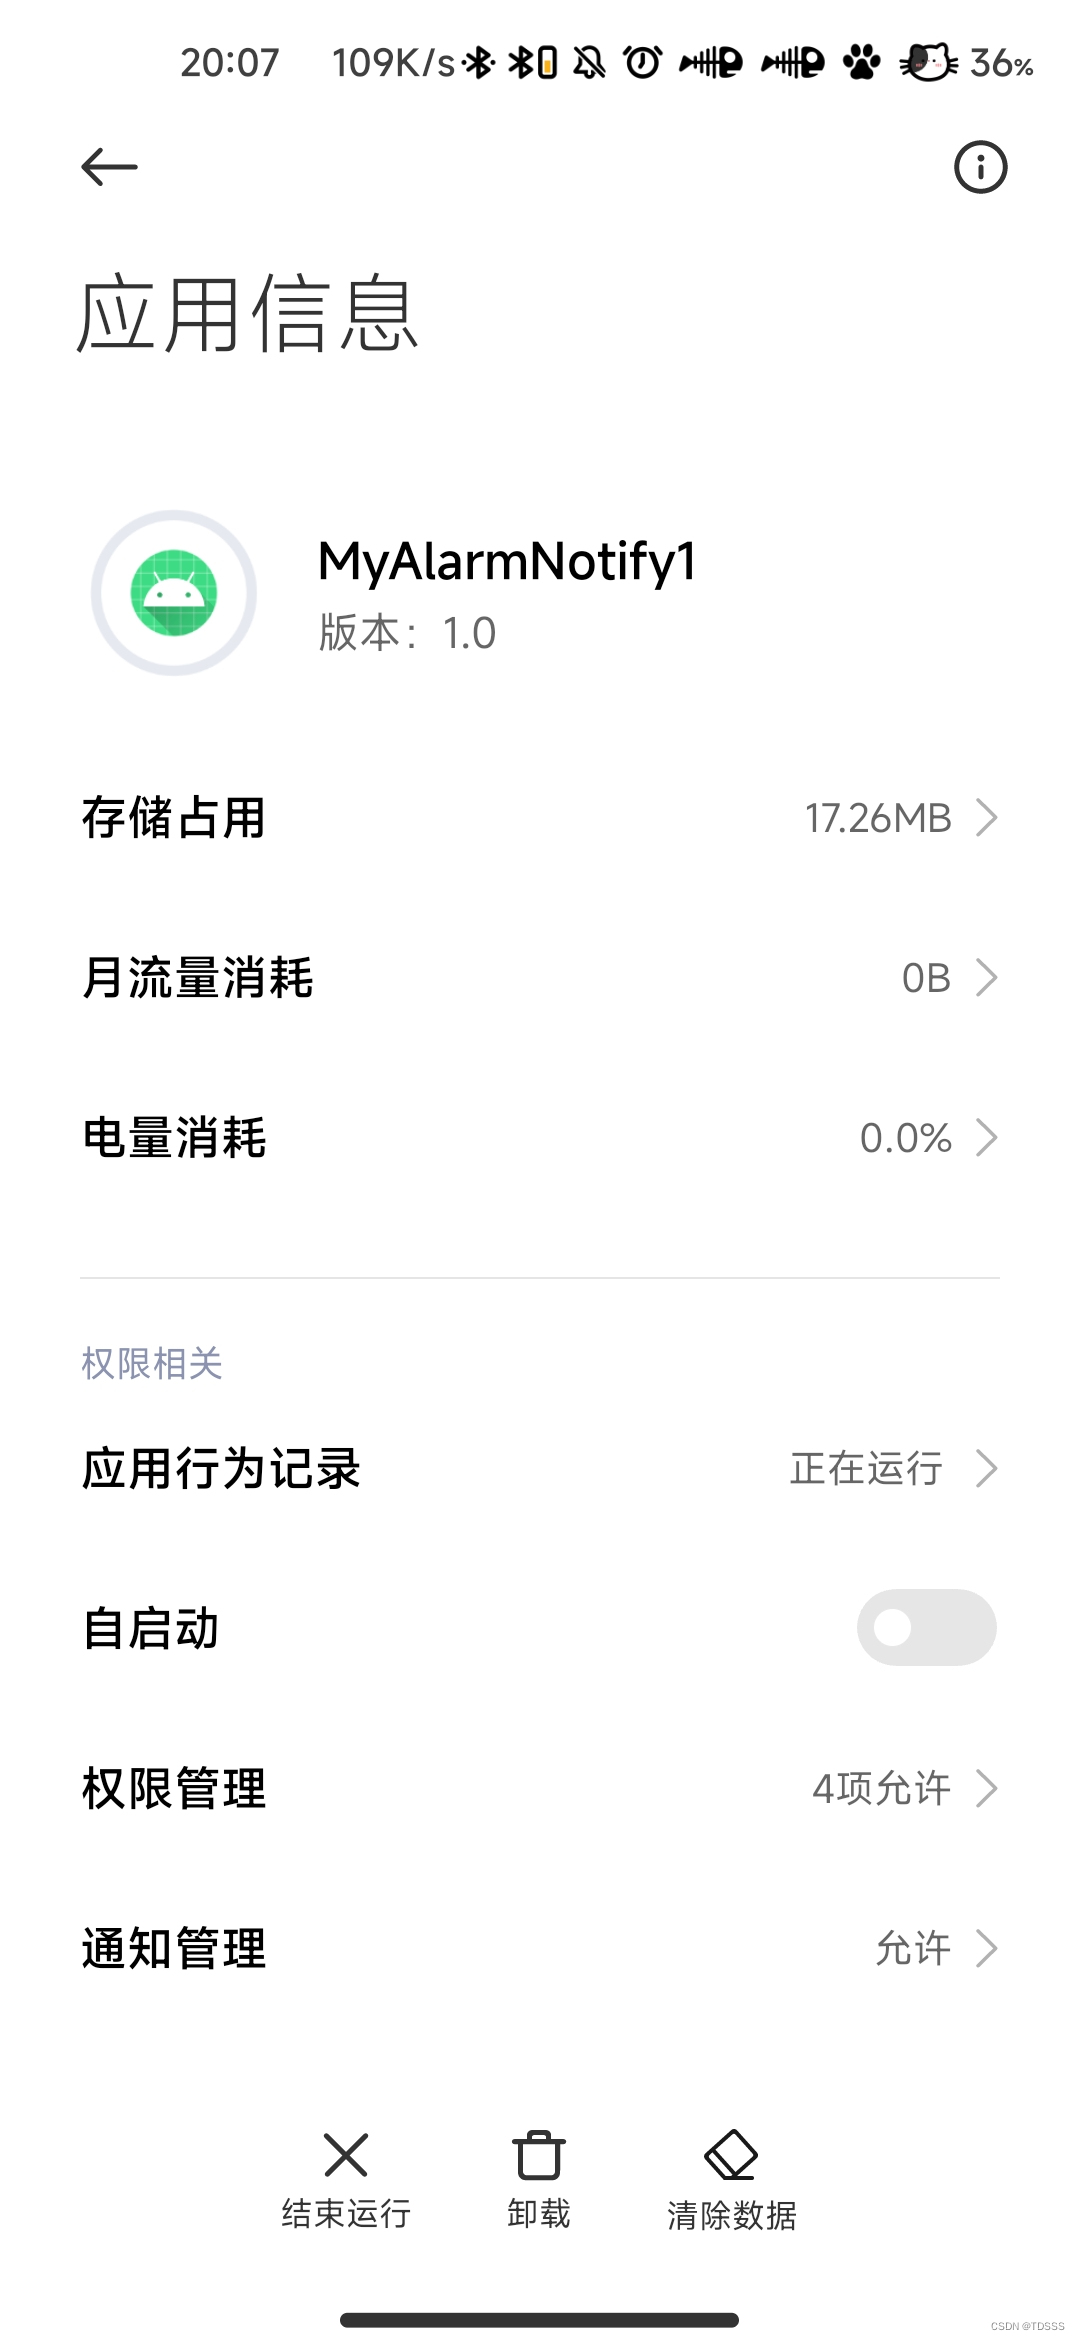
Android Alarm闹钟API使用心得
前言 有什么办法可以在不打开App的时候,也能够触发一些操作呢?比如说发送通知,解决这个需求的办法有很多种选择,比如说官方推荐的WorkManager API,可以在后台执行一次性、耗时、定时的任务,但WorkManager是…...

什么是业务敏捷,如何实现业务敏捷?
点击链接了解详情 作者介绍 前言 随着越来越多行业的企业开始关注敏捷,业务敏捷(Business Agility)成为一个新的热点。毕竟大部分的行业和组织与软件无关,但是依然要实现业务上的敏捷,所以这个系列会主要谈两点&#…...
ATF(TF-A)安全通告 TFV-7 (CVE-2018-3639)
安全之安全(security)博客目录导读 ATF(TF-A)安全通告汇总 目录 一、ATF(TF-A)安全通告 TFV-7 (CVE-2018-3639) 二、静态缓解(Static mitigation) 三、动态缓解(Dynamic mitigation) 一、ATF(TF-A)安全通告 TFV-7 (CVE-2018…...

第三天课程下
1.项目目录介绍和运行流程 工程化开发模式中:这里不再直接编写模板语法,通过 App.vue 提供结构渲染 main.js文件 // 文件核心作用:导入App.vue,基于App.vue创建结构渲染index.html // 1. 导入 Vue 核心包 import Vue from vue// …...
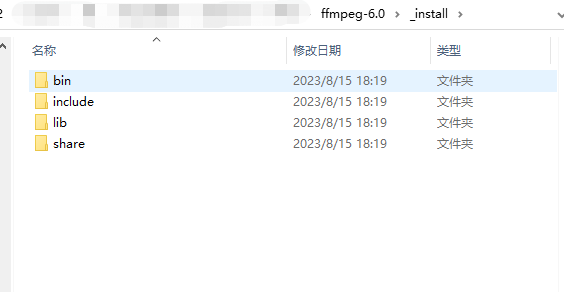
嵌入式编译FFmpeg6.0版本并且组合x264
下载直通车:我用的是6.0版本的 1.准备编译: 2.进入ffmpeg源码目录,修改Makefile,添加编译选项: CFLAGS -fPIC 不加会报错 3.使用命令直接编译 ./configure --cross-prefix/home/xxx/bin/arm-linux-gnueabihf- --enable-cross-compile --targ…...
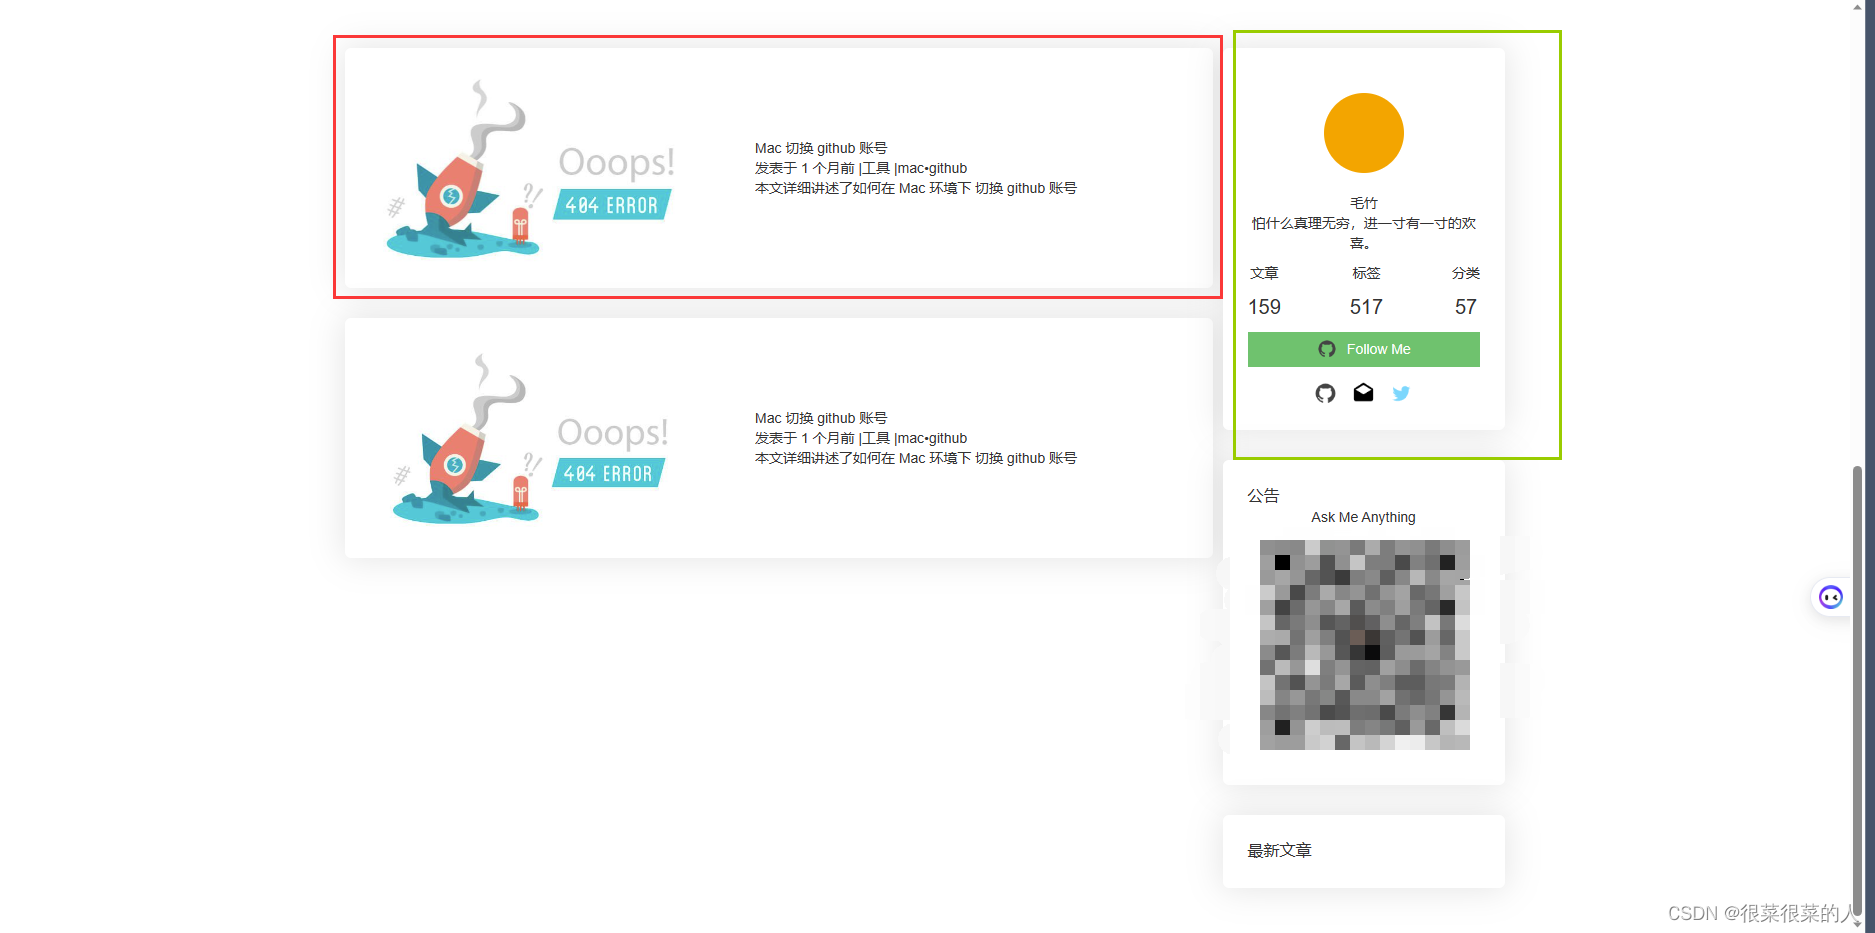
原子css 和 组件化css如何搭配使用
如果让你来实现下面这种页面,该怎么实现呢 原子化和css组件化方式写法,可以搭配起来使用,常用的css 原子css 比如 下面这些类似flex 布局,lstn curser-pointer 等常用的或者 具备一定规律性的padding margin 样式可以抽取为单独…...
)
Python 实现Selenium录屏的一种方法(图片整合成动态图)
由于UI层自动化的不稳定性,经常会遇到执行中断或用例失败的问题,以下是一些常见的措施。 1.详细的日志 2.定位出错时截图 3.Pytest的缓存机制(可以记录成功了哪些失败了哪些) 4.自动重试机制(如pytest-rerunfailures) 5.用例录像 用例录像是最直观的一…...

【设计模式——学习笔记】23种设计模式——策略模式Strategy(原理讲解+应用场景介绍+案例介绍+Java代码实现)
文章目录 案例引入传统方案实现实现分析 介绍基本介绍登场角色 案例实现案例一类图实现 案例二类图实现问答 策略模式在JDK源码中的使用总结文章说明 案例引入 有各种鸭子,比如野鸭、北京鸭、水鸭等。 鸭子有各种行为,比如走路、叫、飞行等。不同鸭子的…...

通讯商二要素Api接口验证真伪
随着互联网的普及和各种社交平台、电商平台、金融平台的发展,许多业务都需要用户进行实名认证,这也就涉及到了手机号码和姓名的验证问题。为了解决这个问题,现在有很多运营商提供的二要素API接口能够进行手机号码和姓名的验证,本文…...
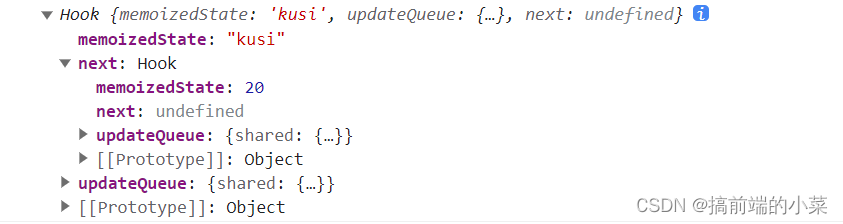
React源码解析18(6)------ 实现useState
摘要 在上一篇文章中,我们已经实现了函数组件。同时可以正常通过render进行渲染。 而通过之前的文章,beginWork和completeWork也已经有了基本的架子。现在我们可以去实现useState了。 实现之前,我们要先修改一下我们的index.js文件&#x…...
MongoDB的下载和安装
一、MongoDB下载 下载地址:https://www.mongodb.com/try/download/community 二、安装 因为选择下载的是 .zip 文件,直接跳过安装,一步到位。 选择在任一磁盘创建空文件夹(不要使用中文路径),解压之后把…...
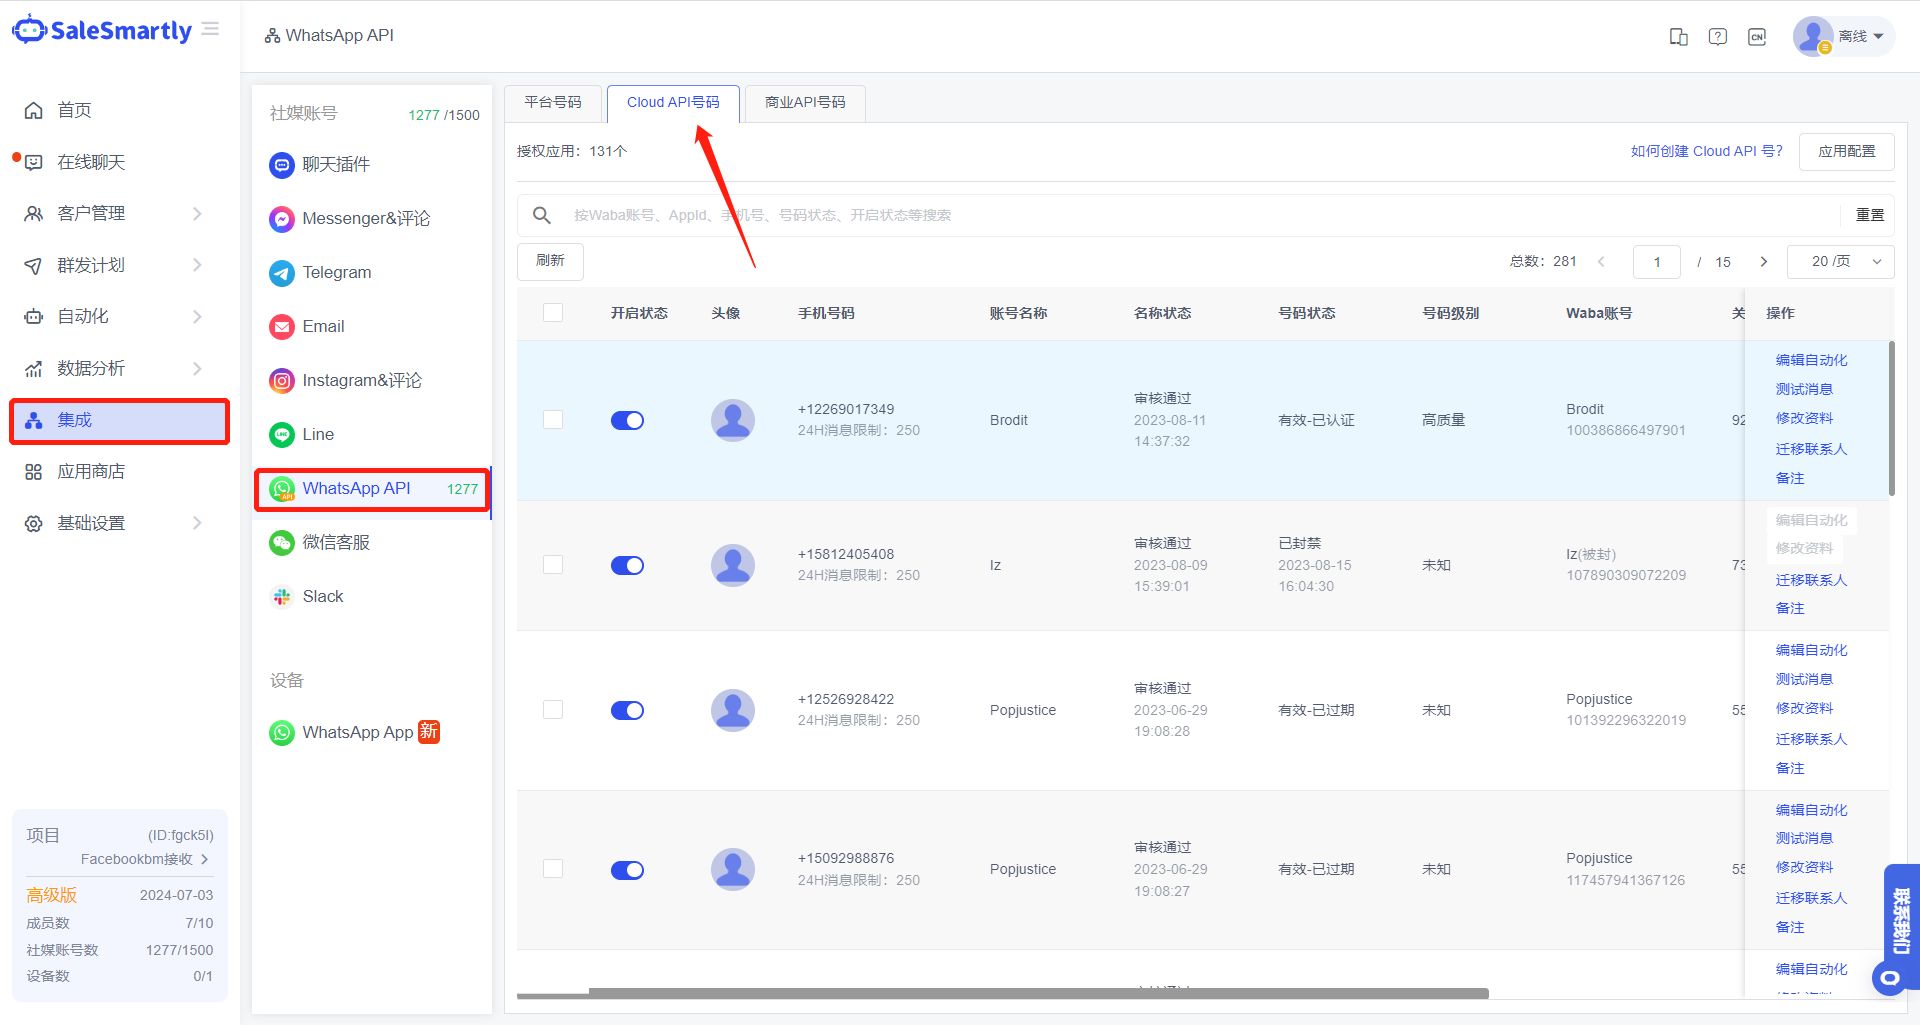
如何卖 Click to WhatsApp 广告最有效
2022年,大多数直接面向消费者的品牌都面临相同挑战—— Facebook 和 Instagram 的广告成本大幅增加。Business Insider 报导指出,2021年 Facebook 广告每次点击的平均成本(average cost per click)达到0.974美元,按年升…...
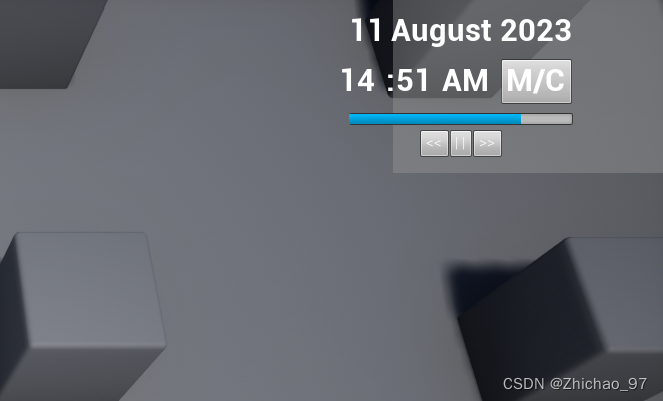
【UE4 RTS】10-RTS HUD Setup
前言 本篇博文主要制作了一个控件蓝图界面,用于显示当前的游戏时间 效果 步骤 1. 新建一个名为“Widgets”的文件夹 在该文件夹中新建一个控件蓝图,命名为“GameTime_HUD” 打开“GameTime_HUD”,添加如下控件 2. 打开玩家控制器“RTS_Pla…...

Python生成指定大小文件:txt/图片/视频/csv
如题,做测试的懂的都懂,不多解释 相比其他大佬,本脚本基于gpt编写后整理,生成的文件更真实,能够打开预览,看过其他人的生成脚本,只是一个符合大小,但是是空白或不能打开的文件。 话…...

Arcgis中影像图切片有白斑或者白点
效果 步骤 1、3dmax渲染或者其它原片 2、Arcgis中加载图片 原数据效果 3、定义投影和转换坐标系等等 我这边测试数据是EPSG:4326的坐标系 4、导出jp2(JPG2000)格式 转换后效果 5、发布服务 6、效果对比...

微信小程序161~200
收货地址实现删除收货地址删除滑块SwipeCell自动收起调用之前的swipeCell商品管理配置商品管理分包-封装商品模块接口import http from "../utils/http"/*** description 获取商品列表数据* param {Object} param {page,limit,categoryId,category2Id}* returns Prom…...

FastMamba:边缘计算中的Mamba2高效部署方案
1. FastMamba项目概述在深度学习领域,状态空间模型(State Space Models, SSMs)正逐渐成为处理长序列任务的新范式。Mamba2作为SSM家族的最新成员,通过状态空间对偶性框架和半可分离矩阵分解技术,在保持模型精度的同时&…...

宇树造的“阿凡达”机甲,掀翻具身智能行业的桌子
作者:Evin编辑:刘致呈审核:徐徐出品:互联网江湖宇树GD01载人变形机甲火了。上次机器人这么火,还是马年春晚。到今天,上马年春晚的几家具身智能厂商中,银河通用的官网首页,依然有马年…...

Super IO插件终极指南:Blender批量导入导出效率提升300%的完整实战方案
Super IO插件终极指南:Blender批量导入导出效率提升300%的完整实战方案 【免费下载链接】super_io blender addon for copy paste import / export 项目地址: https://gitcode.com/gh_mirrors/su/super_io 在3D创作工作流中,文件导入导出是每个设…...

MoE混合专家系统原理与工程实践:稀疏激活如何实现大模型高效推理
1. 项目概述:当“参数规模”不再等于“实际计算量”你可能已经看过不少标题党文章,比如“GPT-4参数量突破1.8万亿!”——但真正值得细品的,是后半句:“它每处理一个词(token),只动用…...

Skelerealms:Godot开放世界的数据驱动架构解析
1. 这不是又一个“Godot RPG模板”,而是一套为开放世界量身定制的底层骨架我第一次在GitHub上看到Skelerealms这个仓库时,没点开README就直接关掉了——标题里带“RPG框架”“Godot”“开放世界”的项目,过去三年我至少扫过四十七个ÿ…...

RDP Wrapper实用指南:三步解决[not supported]错误的高效方法
RDP Wrapper实用指南:三步解决[not supported]错误的高效方法 【免费下载链接】rdpwrap RDP Wrapper Library 项目地址: https://gitcode.com/gh_mirrors/rd/rdpwrap RDP Wrapper是一款让Windows家庭版支持多用户远程桌面连接的开源工具,但许多用…...

NTC与PTC热敏电阻选型实战:从原理到电路设计的深度解析
1. 项目概述:一次关于温度传感器选型的深度复盘在嵌入式系统、家电控制、电池管理乃至工业自动化领域,温度测量是基础得不能再基础,却又至关重要的一环。选对传感器,项目就成功了一半;选错,后续的校准、补偿…...

量子计算入门:从量子比特到量子退火的核心原理与实践
1. 项目概述:推开量子世界的大门最近几年,量子计算这个词的热度是越来越高,从科技新闻到投资风口,似乎无处不在。但说实话,很多朋友一听到“量子叠加”、“量子纠缠”这些词,第一反应可能就是“不明觉厉”&…...

【Feed 高并发架构实战】:雪花 ID + 三级缓存 + 计数旁路设计详解
🔥你好我是fengxin_rou这是我的个人主页fengxin_rou的主页 ❄️欢迎查看我的专栏我的专栏 《Java后端学习》、《JAVASE基础》、《JUC并发》、《redis》、《JVM虚拟机》、《MYSQL》、《黑马点评》、《rabbitmq》、《JavaWebAI的talis学习系统》、《苍穹外卖》 目录…...