prometheus部署及钉钉告警集成Grafana
1、准备工作
安装包
📎alertmanager-0.23.0.linux-amd64.tar.gz
📎node_exporter-1.3.1.linux-amd64.tar.gz
📎prometheus-webhook-dingtalk-1.4.0.linux-amd64.tar.gz
服务端口
| Prometheus | 9090 |
| node_exporter | 9100 |
| alertmanager | 9093 |
| prometheus-webhook-dingtalk | 8060 |
#修改配置文件之前先备份
systemctl stop firewalld
setenforce 0
2、安装go环境
/usr/local
curl -O https://storage.googleapis.com/golang/go1.8.3.linux-amd64.tar.gz  或者   wget -c https://storage.googleapis.com/golang/go1.8.3.linux-amd64.tar.gz
tar -C /usr/local -zxvf go1.8.3.linux-amd64.tar.gz
vim /etc/profile   #修改配置文件export PATH=$PATH:/usr/local/go/bin   #文件末添加
source /etc/profile  #保存配置文件
go version  #验证go环境是否安装成功
3、部署prometheus
(1)下载安装Prometheus
/usr/local
curl -O https://blockchain-sre.oss-cn-hangzhou.aliyuncs.com/prometheus-2.31.1.linux-amd64.tar.gz  或者  wget -c https://blockchain-sre.oss-cn-hangzhou.aliyuncs.com/prometheus-2.31.1.linux-amd64.tar.gz
tar -C /usr/local -zxvf prometheus-2.31.1.linux-amd64.tar.gz
cd /usr/local
mv prometheus-2.31.1.linux-amd64 prometheus   #为方便进入目录,修改目录名为prometheus
cd
useradd -M -s /sbin/nologin prometheus
mkdir -p /data/prometheus
chown -R prometheus:prometheus /usr/local/prometheus /data/prometheus    # 修改权限 新增配置文件之后最好也执行一下这步
cd /usr/local/prometheus
mkdir bin
mv promtool bin
vim /etc/profileexport PATH=$PATH:/sbin:/usr/bin:/usr/sbinexport PATH=$PATH:/usr/local/go/binexport PATH=/usr/local/prometheus/bin:$PATH:$HOME/bin
source /etc/profile
(2)修改配置文件
/usr/local/prometheus/prometheus.yml
cd /usr/local/prometheus
cp prometheus.yml prometheus.yml.bak   #修改配置文件前先进行备份vim prometheus.yml
修改添加
# my global config
global:scrape_interval: 15s # Set the scrape interval to every 15 seconds. Default is every 1 minute.evaluation_interval: 15s # Evaluate rules every 15 seconds. The default is every 1 minute.# scrape_timeout is set to the global default (10s).# Alertmanager configuration
alerting:alertmanagers:- static_configs:- targets:- localhost:9093# Load rules once and periodically evaluate them according to the global 'evaluation_interval'.
rule_files:- "first_rules.yml"# - "second_rules.yml"# A scrape configuration containing exactly one endpoint to scrape:
# Here it's Prometheus itself.
scrape_configs:# The job name is added as a label `job=<job_name>` to any timeseries scraped from this config.- job_name: "prometheus"# metrics_path defaults to '/metrics'# scheme defaults to 'http'.static_configs:- targets: ["localhost:9090"]- job_name: "node_exporter"static_configs:- targets: ["172.19.88.86:9100"]- job_name: "node2_exporter"static_configs:- targets: ["localhost:9100"]- job_name: "alertmanager"static_configs:- targets: ["localhost:9093"]#  - job_name: 'consul'
#    consul_sd_configs:
#      - server:   'localhost:8500'
#        services: ['test']#  - job_name: 'blackbox'
#    metrics_path: /probe
#    params:
#      module: [http_2xx]  # Look for a HTTP 200 response.
#    file_sd_configs:
#      - refresh_interval: 1m
#        files:
#          - "/usr/local/prometheus/conf/blackbox*.yml"
#    relabel_configs:
#      - source_labels: [__address__]
#        target_label: __param_target
#      - source_labels: [__param_target]
#        target_label: instance
#      - target_label: __address__
#        replacement: localhost:9115   # The blackbox exporter's real hostname:port.#检查配置文件
promtool check config /usr/local/prometheus/prometheus.yml
(3)配置服务启动脚本
/usr/lib/systemd/system/prometheus.service
cat >> /usr/lib/systemd/system/prometheus.service <<EOF
[Unit]
Description=Prometheus
After=network.target[Service]
Type=simple
Environment="GOMAXPROCS=4"
User=prometheus
Group=prometheus
ExecReload=/bin/kill -HUP $MAINPID
ExecStart=/usr/local/prometheus/prometheus \--config.file=/usr/local/prometheus/prometheus.yml \--storage.tsdb.path=/data/prometheus \--storage.tsdb.retention=30d \--web.console.libraries=/usr/local/prometheus/console_libraries \--web.console.templates=/usr/local/prometheus/consoles \--web.listen-address=0.0.0.0:9090 \--web.read-timeout=5m \--web.max-connections=10 \--query.max-concurrency=20 \--query.timeout=2m \--web.enable-lifecycle
PrivateTmp=true
PrivateDevices=true
ProtectHome=true
NoNewPrivileges=true
LimitNOFILE=infinity
ReadWriteDirectories=/data/prometheus
ProtectSystem=fullSyslogIdentifier=prometheus
Restart=always[Install]
WantedBy=multi-user.targetEOF#启动服务
systemctl daemon-reload
systemctl enable prometheus
systemctl start prometheus
systemctl status prometheusnetstat -ntlp | grep 9090#网页访问:localhost:9090  进入prometheus监控界面
4、部署node_exporter
(1)下载安装node_exporter
/usr/local
curl -O https://github.com/prometheus/node_exporter/releases/download/v1.3.1/node_exporter-1.3.1.linux-amd64.tar.gz 或者 wget -c https://github.com/prometheus/node_exporter/releases/download/v1.3.1/node_exporter-1.3.1.linux-amd64.tar.gzexit
scp C:\Users\wangdachu\Desktop\node_exporter-1.3.1.linux-amd64.tar.gz root@139.224.42.43:/root
Aldaba123!@#
ssh root@139.224.42.43tar -C /usr/local -zxvf node_exporter-1.3.1.linux-amd64.tar.gz
cd /usr/local
mv node_exporter-1.3.1.linux-amd64 node_exporter
chown -R root:root /usr/local/node_exporter
(2)配置服务启动脚本
/usr/lib/systemd/system/node_exporter.service
cat >> /usr/lib/systemd/system/node_exporter.service <<EOF
[Unit]
Description=node_exporter
After=network.target[Service]
Type=simple
User=root
Group=root
ExecStart=/usr/local/node_exporter/node_exporter \--collector.textfile.directory=/var/lib/node_exporter/textfile_collector--web.listen-address=0.0.0.0:9100 \--web.telemetry-path=/metrics \--log.level=info \--log.format=logfmt
Restart=always[Install]
WantedBy=multi-user.targetEOF#启动服务
systemctl daemon-reload
systemctl enable node_exporter
systemctl start node_exporter
systemctl status node_exporternetstat -ntlp | grep 9100#网页访问:localhost:9100
(3)被监控主机安装node_exporter及配置服务启动脚本
/usr/lib/systemd/system/node_exporter.service
tar -C /usr/local -zxvf node_exporter-1.3.1.linux-amd64.tar.gz
cd /usr/local
mv node_exporter-1.3.1.linux-amd64 node_exporter
chown -R prometheus:prometheus /usr/local/node_exportercat >> /usr/lib/systemd/system/node_exporter.service <<EOF
[Unit]
Description=node_export
Documentation=https://github.com/prometheus/node_exporter
After=network.target[Service]
Type=simple
User=prometheus
ExecStart=/usr/local/node_exporter/node_exporter --collector.textfile.directory=/var/lib/node_exporter/textfile_collector   #指定数据采集的路径
Restart=on-failure
[Install]
WantedBy=multi-user.target
EOF#启动服务
systemctl daemon-reload
systemctl enable node_exporter
systemctl start node_exporter
systemctl status node_exporternetstat -ntlp | grep 9100#网页访问:被监控主机IP:9100#localhost:9090进入监控界面 -> Graph -> 键入up -> Execute  查看监控状态
5、配置定时任务(采集目录)
cd /var/lib
mkdir -p node_exproter/textfile_collector
vim /etc/cron.d/directory_size
*/5 * * * * root du -sb /var/log /var/cache/apt /var/lib/prometheus | sed -ne 's/^\([0-9]\+\)\t\(.*\)$/node_directory_size_bytes{directory="\2"} \1/p' > /var/lib/node_exporter/textfile_collector/directory_size.prom.$$ && mv /var/lib/node_exporter/textfile_collector/directory_size.prom.$$ /var/lib/node_exporter/textfile_collector/directory_size.promcrontab -u root /etc/cron.d/directory_size
crontab -l修改node_exporter自启动脚本
cat /usr/lib/systemd/system/node_exporter.service
[Unit]
Description=node_export
Documentation=https://github.com/prometheus/node_exporter
After=network.target[Service]
Type=simple
User=prometheus
ExecStart=/usr/local/node_exporter/node_exporter --collector.textfile.directory=/var/lib/node_exporter/textfile_collector   #指定路径
Restart=on-failure
[Install]
WantedBy=multi-user.target表达式:node_directory_size_bytes{directory="/var/lib/prometheus"}
查看监控图形
6、部署alertmanager
(1)下载安装alertmanager
/usr/local
curl -O https://github.com/prometheus/alertmanager/releases/download/v0.23.0/alertmanager-0.23.0.linux-amd64.tar.gz 或者 wget -c https://github.com/prometheus/alertmanager/releases/download/v0.23.0/alertmanager-0.23.0.linux-amd64.tar.gz
tar -C /usr/local -zxvf alertmanager-0.23.0.linux-amd64.tar.gz
mv alertmanager-0.23.0.linux-amd64 alertmanager
mkdir /usr/local/alertmanager/data
chown -R prometheus:prometheus /usr/local/alertmanager
(2)修改配置文件
/usr/local/alertmanager/alertmanager.yml
cp alertmanager.yml alertmanager.yml.bak   #备份配置文件# 全局配置项
global:resolve_timeout: 5m # 处理超时时间,默认为5min# 定义路由树信息
route:group_by: [alertname]  # 报警分组依据receiver: ops_notify   # 设置默认接收人group_wait: 30s        # 最初即第一次等待多久时间发送一组警报的通知group_interval: 60s    # 在发送新警报前的等待时间repeat_interval: 1h    # 重复发送告警时间。默认1hroutes:- receiver: ops_notify  # 基础告警通知group_wait: 10smatch_re:alertname: 实例存活告警|磁盘使用率告警   # 匹配告警规则中的名称发送- receiver: info_notify  # 消息告警通知group_wait: 10smatch_re:alertname: 内存使用率告警|CPU使用率告警# 定义基础告警接收者
receivers:
- name: ops_notifywebhook_configs:- url: http://localhost:8060/dingtalk/webhook2/send        #prometheus-webhook-dingtalk的url地址send_resolved: true  # 警报被解决之后是否通知# 定义消息告警接收者
- name: info_notifywebhook_configs:- url: http://localhost:8060/dingtalk/webhook2/send          #prometheus-webhook-dingtalk的url地址send_resolved: true# 一个inhibition规则是在与另一组匹配器匹配的警报存在的条件下,使匹配一组匹配器的警报失效的规则。两个警报必须具有一组相同的标签。
inhibit_rules:- source_match:severity: 'critical'target_match:severity: 'warning'equal: ['alertname', 'dev', 'instance']
(3)配置服务启动脚本
/usr/lib/systemd/system/alertmanager.service
cat >> /usr/lib/systemd/system/alertmanager.service <<EOF
[Unit]
Description=Prometheus: the alerting system
Documentation=http://prometheus.io/docs/
After=prometheus.service[Service]
ExecStart=/usr/local/alertmanager/alertmanager --config.file=/usr/local/alertmanager/alertmanager.yml
Restart=always
StartLimitInterval=0
RestartSec=10[Install]
WantedBy=multi-user.target
EOF#启动服务
systemctl daemon-reload && systemctl enable alertmanager && systemctl start alertmanager
systemctl status alertmanagernetstat -natp | grep alertmanager#网页:localhost:9093
7、部署prometheus-webhook-dingtalk
(1)下载安装prometheus-webhook-dingtalk
/usr/local
curl -O https://github.com/timonwong/prometheus-webhook-dingtalk/releases/download/v2.0.0/prometheus-webhook-dingtalk-2.0.0.linux-amd64.tar.gz 或者 wget -c https://github.com/timonwong/prometheus-webhook-dingtalk/releases/download/v2.0.0/prometheus-webhook-dingtalk-2.0.0.linux-amd64.tar.gz
tar -C /usr/local -zxvf prometheus-webhook-dingtalk-2.0.0.linux-amd64.tar.gz
mv prometheus-webhook-dingtalk-2.0.0.linux-amd64 prometheus-webhook-dingtalk1\#修改配置文件     /usr/local/prometheus-webhook-dingtalk/config.yml
cp config.yml config.yml.baktargets:webhook2:url: https://oapi.dingtalk.com/robot/send?access_token=cec57e121cf51ffdcf108ac9218bb01591826ab16b535928b6a860c87eebc9e6        #修改url为钉钉机器人的token ,机器人的webhook地址# secret for signaturesecret: SEC000000000000000000000剩余注释#到message
(2)配置服务启动脚本
/usr/lib/systemd/system/prometheus-webhook-dingtalk.service
cat >> /usr/lib/systemd/system/prometheus-webhook-dingtalk.service <<EOF
[Unit]
Description='start prometheus-webhook-dingtalk service'
Documentation='https://github.com/timonwong/prometheus-webhook-dingtalk'
After=network.target[Service]
Type=simple
User=root
PIDFile=/var/run/prometheus-webhook-dingtalk.pid
ExecStart=/usr/local/prometheus-webhook-dingtalk/prometheus-webhook-dingtalk \--web.listen-address=:8060 \--web.enable-lifecycle \--web.enable-ui \--config.file=/usr/local/prometheus-webhook-dingtalk/config.yml
Restart=on-failure[Install]
WantedBy=multi-user.target
EOFsystemctl daemon-reload && systemctl enable prometheus-webhook-dingtalk && systemctl start prometheus-webhook-dingtalk
systemctl status prometheus-webhook-dingtalknetstat -natp | grep 8060
8、命令行测试机器人发送消息,验证是否可以发送成功
curl -H "Content-Type: application/json" -d '{"msgtype":"text","text":{"content":"prometheus alert test"}}' https://oapi.dingtalk.com/robot/send?access_token=cec57e121cf51ffdcf108ac9218bb01591826ab16b535928b6a860c87eebc9e6
#修改url为钉钉机器人的token ,机器人的webhook地址
curl -H "Content-Type: application/json" -d '{"msgtype":"text","text":{"content":"prometheus alert test"}}' https://oapi.dingtalk.com/robot/send?access_token=72405a3c5684584a2a13447cc58977fb34ae9c10e060696ef228c6daed1b6f61查看prometheus-webhook-dingtalk的url地址,altermanager会将通知像这个地址发送
journalctl -u prometheus-webhook-dingtalk -f可以看到url    urls=http://localhost:8060/dingtalk/webhook1/send
9、配置告警规则
/usr/local/prometheus/first_rules.yml
cat >> /usr/local/prometheus/first_rules.yml << EOF
groups:
# 实例存活报警
- name: 实例存活告警规则rules:- alert: 实例存活告警expr: up == 0for: 1mlabels:user: prometheusseverity: warningannotations:description: "{{ $labels.instance }} of job {{ $labels.job }} has been down for more than 1 minutes."# mem报警
- name: 内存报警规则rules:- alert: 内存使用率告警expr: (node_memory_MemTotal_bytes - (node_memory_MemFree_bytes+node_memory_Buffers_bytes+node_memory_Cached_bytes )) / node_memory_MemTotal_bytes * 100 > 80for: 1mlabels:user: prometheusseverity: warningannotations:description: "服务器: 内存使用超过80%!(当前值: {{ $value }}%)"# disk报警
- name: 磁盘报警规则rules:- alert: 磁盘使用率告警expr: (node_filesystem_size_bytes - node_filesystem_avail_bytes) / node_filesystem_size_bytes * 100 > 30for: 1mlabels:user: prometheusseverity: warningannotations:description: "服务器: 磁盘设备: 使用超过30%!(挂载点: {{ $labels.mountpoint }} 当前值: {{ $value }}%)"# cpu报警
- name: CPU报警规则rules:- alert: CPU使用率告警expr: 100 - (avg by (instance)(irate(node_cpu_seconds_total{mode="idle"}[1m]) )) * 100 > 30for: 1mlabels:user: prometheusseverity: warningannotations:description: "服务器: CPU使用超过30%!(当前值: {{ $value }}%)"#目录大小告警(复制前面规则不会出错)
- name: 目录报警规则rules:- alert:目录大小告警expr: node_directory_size_bytes > 10for: 1mlabels:user: prometheusseverity: warningannotations:description: "服务器: 目录大小超过0!(当前值: {{ $value }})"
EOF#检查规则配置文件语法是否正确
promtool check rules /usr/local/prometheus/first_rules.yml
10、告警规则模板
/usr/local/prometheus-webhook-dingtalk/contrib/templates/legacy/template.tmpl
11、部署grafana
(1)下载安装grafana
cd prometheus-1/
curl -O https://dl.grafana.com/oss/release/grafana-7.1.3.linux-amd64.tar.gz 或者 wget -c https://dl.grafana.com/oss/release/grafana-7.1.3.linux-amd64.tar.gz
tar -C /usr/local -zxvf grafana-7.1.3.linux-amd64.tar.gz
mv grafana-7.1.3 grafana
mkdir /usr/local/grafana/{data,log}
chown -R prometheus:prometheus /usr/local/grafana
(2)修改配置文件、
/usr/local/grafana/conf/
cd /usr/local/grafana/conf/
cp defaults.ini grafana.inivim grafana.ini# logs = data/loglogs = log
(3)配置服务启动脚本
/usr/lib/systemd/system/grafana-server.service
cat >> /usr/lib/systemd/system/grafana-server.service <<EOF
[Unit]
Description=Grafana instance
Documentation=http://docs.grafana.org
Wants=network-online.target
After=network-online.target
After=postgresql.service mariadb.service mysqld.service[Service]
Type=simple
User=prometheus
Group=prometheus
WorkingDirectory=/usr/local/grafana
ExecStart=/usr/local/grafana/bin/grafana-server \--config=/usr/local/grafana/conf/grafana.ini \--pidfile=/usr/local/grafana/grafana-server.pidRestart=on-failure
LimitNOFILE=10000
TimeoutStopSec=20[Install]
WantedBy=multi-user.target
EOF	systemctl daemon-reload && systemctl enable grafana-server && systemctl start grafana-server
systemctl status grafana-server
netstat -ntlp | grep 3000网页访问:139.224.12.165:3000
默认账号/密码:admin/adminURL:http://139.224.12.165:9090
相关文章:

prometheus部署及钉钉告警集成Grafana
1、准备工作 安装包 📎alertmanager-0.23.0.linux-amd64.tar.gz 📎node_exporter-1.3.1.linux-amd64.tar.gz 📎prometheus-webhook-dingtalk-1.4.0.linux-amd64.tar.gz 服务端口 Prometheus 9090 node_exporter 9100 alertmanager …...

Java百度提前批面试题
今天分享百度提前批的 Java 后端开发面经,整体上考察的点挺多的,主要重点考察了网络i/o、网络协议、linux系统、mysql,Java 问的不多,可能是百度的后端开发的语言不是主要以 Java 为主,所以重点看面试者的计算机基础是…...

Go语言中的Oop面向对象
Go In OOp 一、 Go是面向对象的吗?二、Structs Instead of Classes 结构体 - OOP in Go三、 Composition Instead of Inheritance 组合嵌套 - OOP in Go1.Composition by embedding structs2. Embedding slice of structs 四、Polymorphism 多态 - OOP in Go1. Polymorphism u…...

Duplicate keys detected: ‘1‘. This may cause an update error.
报错 Duplicate keys detected: ‘1’. This may cause an update error. 注释: 检测到重复密钥:‘1’。这可能会导致更新错误。 解决 首先判断是因为for循环导致的,检查是否出现重复。 笔者是同一个页面两处for循环导致...

C++(8.21)c++初步
1.斐波那契: #include <iostream> #include<iomanip>using namespace std;int main() {cout << "Hello World!" << endl;int a[10];for(int i0;i<10;i){if(0i||1i){a[i]1;}elsea[i]a[i-1]a[i-2];cout <<setw(4) <&l…...
【【Verilog典型电路设计之log函数的Verilog HDL设计】】
Verilog典型电路设计之log函数的Verilog HDL设计 log函数是一种典型的单目计算函数,与其相应的还有指数函数、三角函数等。对于单目计算函数的硬件加速器设计一般两种简单方法:一种是查找表的方式;一种是使用泰勒级数展开成多项式进行近似计算。这两种方式在设计方…...
)
数字放大(C++)
系列文章目录 1.进阶的卡沙_睡觉觉觉得的博客-CSDN博客 2. 数1的个数_睡觉觉觉得的博客-CSDN博客 3. 双精度浮点数的输入输出_睡觉觉觉得的博客-CSDN博客 4. 足球联赛积分_睡觉觉觉得的博客-CSDN博客 5. 大减价(一级)_睡觉觉觉得的博客-CSDN博客 6. 小写字母的判断_睡觉觉觉得…...
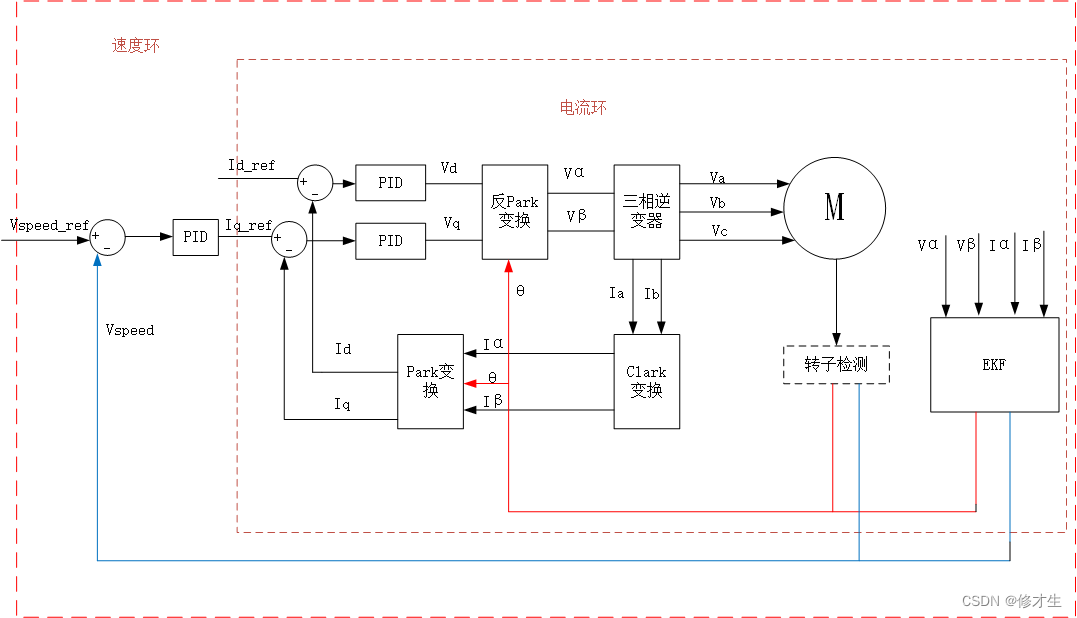
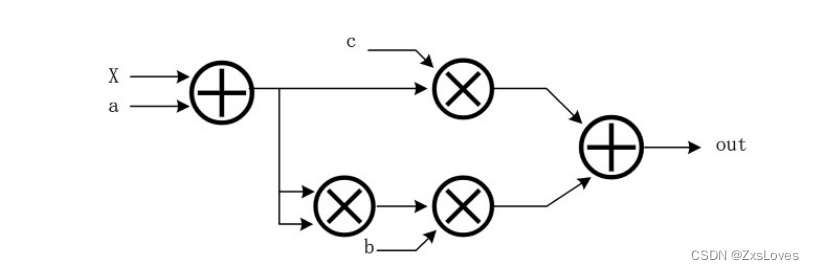
FOC控制框架图
pmsm电机数学模型以及FOC控制框图(开源小项目FOC控制BLDC电机)_foc 框图_栋哥爱做饭的博客-CSDN博客 电机控制----FOC框架讲解_foc电机控制_修才生的博客-CSDN博客...
)
Spring工具类(获取bean,发布事件)
spring-beans-5.3.1.jar Component public final class SpringUtils implements BeanFactoryPostProcessor{/*** Spring应用上下文环境*/private static ConfigurableListableBeanFactory beanFactory;//初始化成员变量Overridepublic void postProcessBeanFactory(Configurab…...
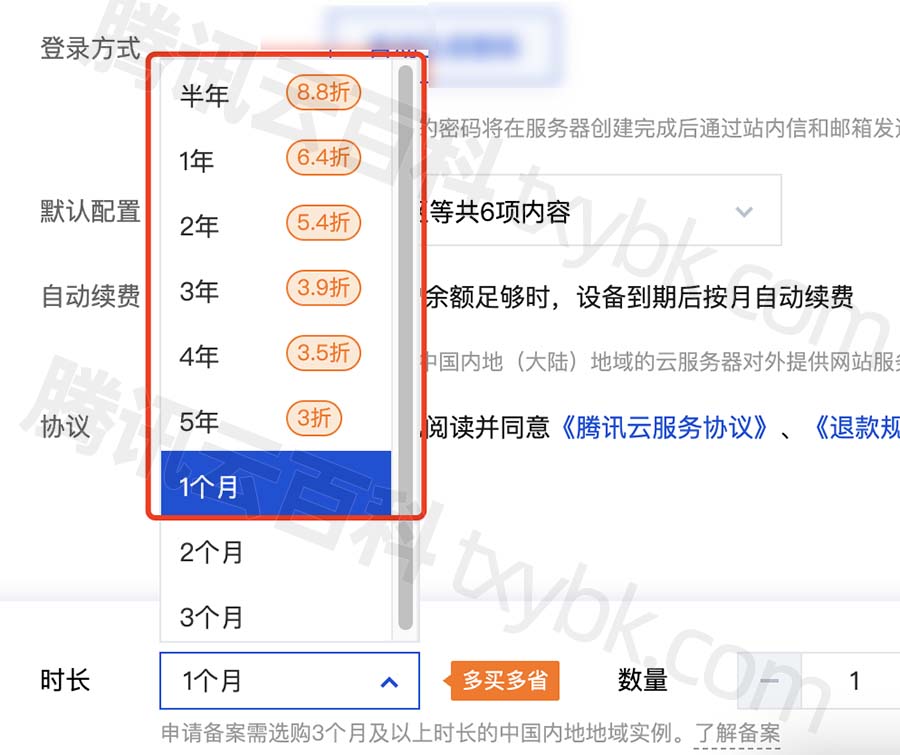
腾讯云和阿里云服务器折扣对比_看看哪家划算?
阿里云服务器和腾讯云服务器根据购买时长可以享受一定的优惠折扣,综合对比下来腾讯云折扣更低,阿腾云来对比下阿里云和腾讯云的云服务器根据购买时长可以享受的常规折扣对比: 目录 阿里云和腾讯云折扣对比 阿里云服务器常规折扣 腾讯云服…...

GO语言中的Defer与Error异常报错详细教程
目录标题 一、Defer1. Example2. Deferred methods 延迟方法3. Arguments evaluation 延迟参数4. Stack of defers 延迟程序堆栈5. Practical use of defer 实际使用 二、Error1. Example2. PathError3. DNSError4. Direct Comparison 直接比较5. Do not ignore errors 不要忽略…...

AP6315 DC单节锂电池充电IC 同步2A锂电芯片
概述 是一款面向5V交流适配器的2A锂离子电池充电器。它是采用1.5MHz固定频率的同步降压型转换器,因此具有高达90%以上的充电效率,自身发热量极小。包括完整的充电终止电路、自动再充电和一个达1%的4.2V预设充电电压,内部集成了防反灌保护、输…...

PDF校对工具正式上线,为用户提供卓越的文档校对解决方案
为满足当下对数字化文档校对的精准需求,我们今日正式发布全新的PDF校对工具。经过深入的技术研发与细致的测试,该工具旨在为企业和个人用户带来一个高效且准确的PDF文档校对平台。 PDF校对工具的主要特性: 1.全面性校对:工具支持…...

WSL 配置 Oracle 19c 客户端
Windows WSL 登陆后显示如下: Welcome to Ubuntu 20.04.4 LTS (GNU/Linux 4.4.0-19041-Microsoft x86_64)* Documentation: https://help.ubuntu.com* Management: https://landscape.canonical.com* Support: https://ubuntu.com/advantageSystem information as…...
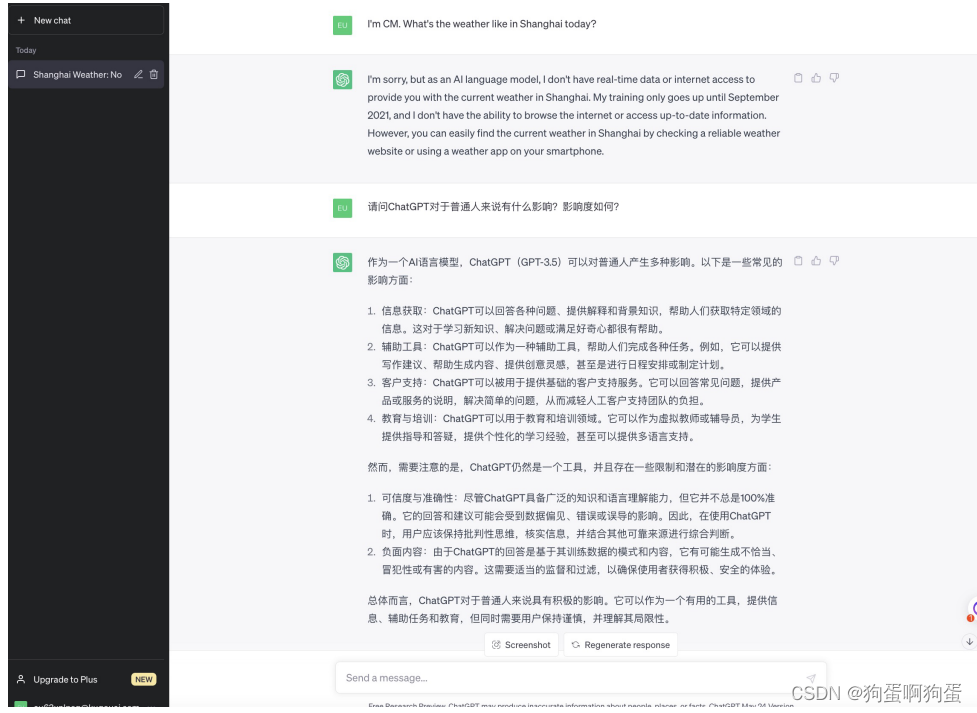
ChatGPT⼊门到精通(1):ChatGPT 是什么
⼀、直观感受 1、公司 OpenAI(美国) 2、官⽅⽹站 3、登录ChatGPT 
idea启动正常,打成jar包时,启动报错
背景 自己写了个小程序,在idea中启动正常,达成jar包发布时,启动报错。 Caused by: java.sql.SQLException: unknown jdbc driver : at com.alibaba.druid.util.JdbcUtils.getDriverClassName(JdbcUtils.java:517) at com.alibaba.druid.pool…...

软考高级系统架构设计师系列论文八十九:论软件需求分析方法和工具的选用
软考高级系统架构设计师系列论文八十九:论软件需求分析方法和工具的选用 一、软件需求相关知识点二、摘要三、正文四、总结一、软件需求相关知识点 软考高级系统架构设计师:论软件需求管理...

java八股文面试[JVM]——类加载器
一、类加载器的概念 类加载器是Java虚拟机用于加载类文件的一种机制。在Java中,每个类都由类加载器加载,并在运行时被创建为一个Class对象。类加载器负责从文件系统、网络或其他来源中加载类的字节码,并将其转换为可执行的Java对象。类加载器…...

CSS中如何实现元素之间的间距(Margin)合并效果?
聚沙成塔每天进步一点点 ⭐ 专栏简介⭐ 外边距合并的示例:⭐ 如何控制外边距合并:⭐ 写在最后 ⭐ 专栏简介 前端入门之旅:探索Web开发的奇妙世界 记得点击上方或者右侧链接订阅本专栏哦 几何带你启航前端之旅 欢迎来到前端入门之旅ÿ…...

【实操干货】如何开始用Qt Widgets编程?(三)
Qt 是目前最先进、最完整的跨平台C开发工具。它不仅完全实现了一次编写,所有平台无差别运行,更提供了几乎所有开发过程中需要用到的工具。如今,Qt已被运用于超过70个行业、数千家企业,支持数百万设备及应用。 在本文中࿰…...

Qt实战:手把手教你优化QCustomPlot曲线图,解决坐标轴覆盖数据点的坑
Qt实战:深度优化QCustomPlot曲线图显示效果 在Qt应用开发中,数据可视化是提升用户体验的关键环节。QCustomPlot作为Qt生态中最受欢迎的2D绘图库之一,以其轻量级和高性能著称,被广泛应用于工业控制、科学研究和金融分析等领域。然而…...

❌别再硬拆QA了!谷歌SEO最大的坑你还在踩
2026年5月7日,谷歌在官方开发者文档悄然更新了一则重磅公告:FAQ 富摘要(FAQ Rich Results)正式全面下线,即日起不再搜索结果中展示。这不是临时调整,而是持续三年收紧后的终极收尾 —— 从 2023 年仅对政府、医疗站开放,到 2026 年 3 月大幅缩减展示量,再到如今彻底关闭…...

3步从图表图片中提取精确数据:WebPlotDigitizer完全指南
3步从图表图片中提取精确数据:WebPlotDigitizer完全指南 【免费下载链接】WebPlotDigitizer Computer vision assisted tool to extract numerical data from plot images. 项目地址: https://gitcode.com/gh_mirrors/we/WebPlotDigitizer 你是否曾经面对科研…...
:RISCV虚拟版卡初始化)
QEMU理解与分析系列(5):RISCV虚拟版卡初始化
文章目录 1、QOM简介 `register_module_init` 的实现 Machine 类型注册 Machine 类定义 MachineClass 结构体定义 MachineState 结构体定义 virt 机器初始化流程 自定义设备初始化 1、QOM简介 QEMU Object Model (QOM) 是 QEMU 中的一种对象系统,用于实现 QEMU 设备模型和设备…...

React Fiber vs Vue 响应式:从调用栈到依赖图,前端两大架构的底层对决
写在前面 前端框架之争吵了快十年。但坦白说,大多数争论卡在"React 好用还是 Vue 好用"的层面,很少有人真正追问:这两个框架为什么从根上就是两套东西? 它们的差异不是 API 设计喜好不同,而是对"UI 的…...

Apollo2 BLE自定义服务开发指南:GATT数据库配置与回调实现
1. 项目概述与核心价值最近在折腾一个基于Apollo2 Blue的低功耗蓝牙项目,需要自定义一个服务(Service)来实现特定的数据交互功能。如果你也在用Ambiq Micro的Apollo2或Apollo3 Blue系列芯片做BLE开发,大概率会遇到类似的需求&…...

鲲鹏面对Agentic沙箱的思考与能力布局
Agent在今年迎来爆发式增长,传统云原生架构在Agent沙箱场景下面临启动慢、弹性差、资源冗余、隔离不足等五大痛点。鲲鹏沙箱以快照快启、共享Rootfs、超节点共享内存三大核心技术破局——将沙箱启动从分钟级压缩至毫秒级,通过写时复制(CoW&am…...

单片机代码优化实战:从数据类型到算法与数据结构的效率提升
1. 项目概述:为什么单片机代码需要“斤斤计较”?如果你是从PC端或者服务器端开发转过来的朋友,第一次接触单片机编程,可能会觉得处处掣肘。在PC上,我们习惯了动辄几个G的内存,上百G的硬盘,CPU频…...

避坑指南:Teamcenter 13四层架构安装中,Weblogic域创建与部署的那些“坑”
Teamcenter 13四层架构部署实战:Weblogic域创建与部署全流程避坑指南 在工业PLM领域,Teamcenter的四层架构部署一直是系统管理员的技术试金石。特别是Weblogic中间件层的配置,往往成为项目推进道路上的"拦路虎"。我曾参与过多个汽…...

别再傻傻用FFT了!用MATLAB的czt函数5分钟搞定频谱细化,精准定位98Hz和99Hz信号
别再被FFT分辨率坑了!MATLAB工程师的频谱细化实战指南 当你在分析一段包含98Hz和99Hz混合信号的频谱时,是否遇到过这样的尴尬:明明知道有两个频率成分存在,但FFT给出的结果却像被打了马赛克,两个峰值糊成一团…...