Prometheus+Grafana监控
1、简介
1.1 Prometheus
官网地址:https://prometheus.io/
Prometheus是一个开源的监控系统,起源于SoundCloud。它由以下几个核心组件构成:
数据爬虫: 根据配置的时间定期的通过HTTP抓去metrics数据。
time-series 数据库: 存储所有的metrics数据。
简单的用户交互接口: 可视化、查询和监控所有的metrics。

1.2 Grafana
官网地址:https://grafana.com/
Grafana使你能够把来自不同数据源比如Elasticsearch, Prometheus, Graphite, influxDB等多样的数据以绚丽的图标展示出来。它也能基于你的metrics数据发出告警。当一个告警状态改变时,它能通知你通过email,slack或者其他途径。
Grafana是一个开源的度量分析与可视化套件,纯JavaScript开发的前端工具,通过访问库(如InfluxDB),展示自定义报表、显示图表等。它的UI十分灵活,有丰富的插件和模板,功能强大。一般用在时序数据的监控方面。
2、项目
2.1 引入依赖
<dependency><groupId>org.springframework.boot</groupId><artifactId>spring-boot-starter-actuator</artifactId>
</dependency><dependency><groupId>io.micrometer</groupId><artifactId>micrometer-registry-prometheus</artifactId><scope>runtime</scope>
</dependency>
2.2 配置文件
management:metrics:tags:application: ${spring.application.name}export:prometheus:enabled: true#开启暴露webendpoints:web:exposure:include: prometheus2.3 访问地址
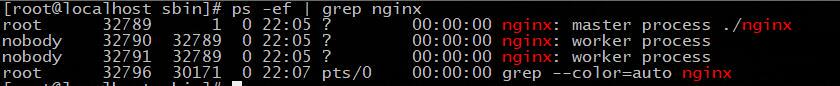
http://localhost:8080/actuator/prometheus
# HELP jvm_gc_memory_promoted_bytes_total Count of positive increases in the size of the old generation memory pool before GC to after GC
# TYPE jvm_gc_memory_promoted_bytes_total counter
jvm_gc_memory_promoted_bytes_total{application="prometheus-demo",} 3765576.0
# HELP executor_queue_remaining_tasks The number of additional elements that this queue can ideally accept without blocking
# TYPE executor_queue_remaining_tasks gauge
executor_queue_remaining_tasks{application="prometheus-demo",name="applicationTaskExecutor",} 2.147483647E9
# HELP jvm_gc_pause_seconds Time spent in GC pause
# TYPE jvm_gc_pause_seconds summary
jvm_gc_pause_seconds_count{action="end of minor GC",application="prometheus-demo",cause="Allocation Failure",} 1.0
jvm_gc_pause_seconds_sum{action="end of minor GC",application="prometheus-demo",cause="Allocation Failure",} 0.012
jvm_gc_pause_seconds_count{action="end of major GC",application="prometheus-demo",cause="Ergonomics",} 1.0
jvm_gc_pause_seconds_sum{action="end of major GC",application="prometheus-demo",cause="Ergonomics",} 0.078
# HELP jvm_gc_pause_seconds_max Time spent in GC pause
# TYPE jvm_gc_pause_seconds_max gauge
jvm_gc_pause_seconds_max{action="end of minor GC",application="prometheus-demo",cause="Allocation Failure",} 0.012
jvm_gc_pause_seconds_max{action="end of major GC",application="prometheus-demo",cause="Ergonomics",} 0.078
# HELP tomcat_sessions_active_current_sessions
# TYPE tomcat_sessions_active_current_sessions gauge
tomcat_sessions_active_current_sessions{application="prometheus-demo",} 0.0
# HELP jvm_threads_daemon_threads The current number of live daemon threads
# TYPE jvm_threads_daemon_threads gauge
jvm_threads_daemon_threads{application="prometheus-demo",} 15.0
# HELP process_files_max_files The maximum file descriptor count
# TYPE process_files_max_files gauge
process_files_max_files{application="prometheus-demo",} 65535.0
# HELP http_server_requests_seconds Duration of HTTP server request handling
# TYPE http_server_requests_seconds summary
http_server_requests_seconds_count{application="prometheus-demo",exception="None",method="GET",outcome="SUCCESS",status="200",uri="/actuator",} 1.0
http_server_requests_seconds_sum{application="prometheus-demo",exception="None",method="GET",outcome="SUCCESS",status="200",uri="/actuator",} 0.017622173
http_server_requests_seconds_count{application="prometheus-demo",exception="None",method="GET",outcome="SUCCESS",status="200",uri="/actuator/prometheus",} 8.0
http_server_requests_seconds_sum{application="prometheus-demo",exception="None",method="GET",outcome="SUCCESS",status="200",uri="/actuator/prometheus",} 0.14188689
http_server_requests_seconds_count{application="prometheus-demo",exception="None",method="GET",outcome="CLIENT_ERROR",status="404",uri="/**",} 2.0
http_server_requests_seconds_sum{application="prometheus-demo",exception="None",method="GET",outcome="CLIENT_ERROR",status="404",uri="/**",} 0.020303186
# HELP http_server_requests_seconds_max Duration of HTTP server request handling
# TYPE http_server_requests_seconds_max gauge
http_server_requests_seconds_max{application="prometheus-demo",exception="None",method="GET",outcome="SUCCESS",status="200",uri="/actuator",} 0.017622173
http_server_requests_seconds_max{application="prometheus-demo",exception="None",method="GET",outcome="SUCCESS",status="200",uri="/actuator/prometheus",} 0.093066747
http_server_requests_seconds_max{application="prometheus-demo",exception="None",method="GET",outcome="CLIENT_ERROR",status="404",uri="/**",} 0.017153903
# HELP jvm_gc_memory_allocated_bytes_total Incremented for an increase in the size of the (young) heap memory pool after one GC to before the next
# TYPE jvm_gc_memory_allocated_bytes_total counter
jvm_gc_memory_allocated_bytes_total{application="prometheus-demo",} 8.0216064E7
# HELP jvm_threads_live_threads The current number of live threads including both daemon and non-daemon threads
# TYPE jvm_threads_live_threads gauge
jvm_threads_live_threads{application="prometheus-demo",} 19.0
# HELP tomcat_sessions_active_max_sessions
# TYPE tomcat_sessions_active_max_sessions gauge
tomcat_sessions_active_max_sessions{application="prometheus-demo",} 0.0
# HELP jvm_threads_states_threads The current number of threads
# TYPE jvm_threads_states_threads gauge
jvm_threads_states_threads{application="prometheus-demo",state="runnable",} 5.0
jvm_threads_states_threads{application="prometheus-demo",state="new",} 0.0
jvm_threads_states_threads{application="prometheus-demo",state="timed-waiting",} 2.0
jvm_threads_states_threads{application="prometheus-demo",state="blocked",} 0.0
jvm_threads_states_threads{application="prometheus-demo",state="waiting",} 12.0
jvm_threads_states_threads{application="prometheus-demo",state="terminated",} 0.0
# HELP jvm_classes_loaded_classes The number of classes that are currently loaded in the Java virtual machine
# TYPE jvm_classes_loaded_classes gauge
jvm_classes_loaded_classes{application="prometheus-demo",} 7335.0
# HELP process_uptime_seconds The uptime of the Java virtual machine
# TYPE process_uptime_seconds gauge
process_uptime_seconds{application="prometheus-demo",} 134.962
# HELP executor_queued_tasks The approximate number of tasks that are queued for execution
# TYPE executor_queued_tasks gauge
executor_queued_tasks{application="prometheus-demo",name="applicationTaskExecutor",} 0.0
# HELP process_files_open_files The open file descriptor count
# TYPE process_files_open_files gauge
process_files_open_files{application="prometheus-demo",} 28.0
# HELP process_cpu_usage The "recent cpu usage" for the Java Virtual Machine process
# TYPE process_cpu_usage gauge
process_cpu_usage{application="prometheus-demo",} 0.003040668947168377
# HELP disk_total_bytes Total space for path
# TYPE disk_total_bytes gauge
disk_total_bytes{application="prometheus-demo",path="/root/project/prometheus/share/prometheus/prometheus-demo/target/.",} 8.4416294912E10
# HELP application_started_time_seconds Time taken (ms) to start the application
# TYPE application_started_time_seconds gauge
application_started_time_seconds{application="prometheus-demo",main_application_class="com.ybw.PrometheusDemoApplication",} 3.1
# HELP system_load_average_1m The sum of the number of runnable entities queued to available processors and the number of runnable entities running on the available processors averaged over a period of time
# TYPE system_load_average_1m gauge
system_load_average_1m{application="prometheus-demo",} 0.04
# HELP disk_free_bytes Usable space for path
# TYPE disk_free_bytes gauge
disk_free_bytes{application="prometheus-demo",path="/root/project/prometheus/share/prometheus/prometheus-demo/target/.",} 6.4089042944E10
# HELP process_start_time_seconds Start time of the process since unix epoch.
# TYPE process_start_time_seconds gauge
process_start_time_seconds{application="prometheus-demo",} 1.676960826636E9
# HELP application_ready_time_seconds Time taken (ms) for the application to be ready to service requests
# TYPE application_ready_time_seconds gauge
application_ready_time_seconds{application="prometheus-demo",main_application_class="com.ybw.PrometheusDemoApplication",} 3.135
# HELP jvm_memory_used_bytes The amount of used memory
# TYPE jvm_memory_used_bytes gauge
jvm_memory_used_bytes{application="prometheus-demo",area="heap",id="PS Survivor Space",} 522208.0
jvm_memory_used_bytes{application="prometheus-demo",area="heap",id="PS Old Gen",} 1.1626216E7
jvm_memory_used_bytes{application="prometheus-demo",area="nonheap",id="Metaspace",} 3.7158344E7
jvm_memory_used_bytes{application="prometheus-demo",area="nonheap",id="Code Cache",} 9744256.0
jvm_memory_used_bytes{application="prometheus-demo",area="heap",id="PS Eden Space",} 8.0009112E7
jvm_memory_used_bytes{application="prometheus-demo",area="nonheap",id="Compressed Class Space",} 5006064.0
# HELP jvm_gc_live_data_size_bytes Size of long-lived heap memory pool after reclamation
# TYPE jvm_gc_live_data_size_bytes gauge
jvm_gc_live_data_size_bytes{application="prometheus-demo",} 1.1626216E7
# HELP jvm_buffer_count_buffers An estimate of the number of buffers in the pool
# TYPE jvm_buffer_count_buffers gauge
jvm_buffer_count_buffers{application="prometheus-demo",id="mapped",} 0.0
jvm_buffer_count_buffers{application="prometheus-demo",id="direct",} 10.0
# HELP jvm_memory_committed_bytes The amount of memory in bytes that is committed for the Java virtual machine to use
# TYPE jvm_memory_committed_bytes gauge
jvm_memory_committed_bytes{application="prometheus-demo",area="heap",id="PS Survivor Space",} 2621440.0
jvm_memory_committed_bytes{application="prometheus-demo",area="heap",id="PS Old Gen",} 1.6252928E7
jvm_memory_committed_bytes{application="prometheus-demo",area="nonheap",id="Metaspace",} 4.0108032E7
jvm_memory_committed_bytes{application="prometheus-demo",area="nonheap",id="Code Cache",} 1.015808E7
jvm_memory_committed_bytes{application="prometheus-demo",area="heap",id="PS Eden Space",} 9.2274688E7
jvm_memory_committed_bytes{application="prometheus-demo",area="nonheap",id="Compressed Class Space",} 5505024.0
# HELP tomcat_sessions_created_sessions_total
# TYPE tomcat_sessions_created_sessions_total counter
tomcat_sessions_created_sessions_total{application="prometheus-demo",} 0.0
# HELP executor_pool_size_threads The current number of threads in the pool
# TYPE executor_pool_size_threads gauge
executor_pool_size_threads{application="prometheus-demo",name="applicationTaskExecutor",} 0.0
# HELP executor_completed_tasks_total The approximate total number of tasks that have completed execution
# TYPE executor_completed_tasks_total counter
executor_completed_tasks_total{application="prometheus-demo",name="applicationTaskExecutor",} 0.0
# HELP system_cpu_usage The "recent cpu usage" of the system the application is running in
# TYPE system_cpu_usage gauge
system_cpu_usage{application="prometheus-demo",} 0.01596351197263398
# HELP executor_pool_core_threads The core number of threads for the pool
# TYPE executor_pool_core_threads gauge
executor_pool_core_threads{application="prometheus-demo",name="applicationTaskExecutor",} 8.0
# HELP jvm_memory_max_bytes The maximum amount of memory in bytes that can be used for memory management
# TYPE jvm_memory_max_bytes gauge
jvm_memory_max_bytes{application="prometheus-demo",area="heap",id="PS Survivor Space",} 2621440.0
jvm_memory_max_bytes{application="prometheus-demo",area="heap",id="PS Old Gen",} 1.32120576E9
jvm_memory_max_bytes{application="prometheus-demo",area="nonheap",id="Metaspace",} -1.0
jvm_memory_max_bytes{application="prometheus-demo",area="nonheap",id="Code Cache",} 2.5165824E8
jvm_memory_max_bytes{application="prometheus-demo",area="heap",id="PS Eden Space",} 6.53787136E8
jvm_memory_max_bytes{application="prometheus-demo",area="nonheap",id="Compressed Class Space",} 1.073741824E9
# HELP executor_pool_max_threads The maximum allowed number of threads in the pool
# TYPE executor_pool_max_threads gauge
executor_pool_max_threads{application="prometheus-demo",name="applicationTaskExecutor",} 2.147483647E9
# HELP jvm_buffer_memory_used_bytes An estimate of the memory that the Java virtual machine is using for this buffer pool
# TYPE jvm_buffer_memory_used_bytes gauge
jvm_buffer_memory_used_bytes{application="prometheus-demo",id="mapped",} 0.0
jvm_buffer_memory_used_bytes{application="prometheus-demo",id="direct",} 81920.0
# HELP system_cpu_count The number of processors available to the Java virtual machine
# TYPE system_cpu_count gauge
system_cpu_count{application="prometheus-demo",} 2.0
# HELP jvm_classes_unloaded_classes_total The total number of classes unloaded since the Java virtual machine has started execution
# TYPE jvm_classes_unloaded_classes_total counter
jvm_classes_unloaded_classes_total{application="prometheus-demo",} 1.0
# HELP jvm_gc_overhead_percent An approximation of the percent of CPU time used by GC activities over the last lookback period or since monitoring began, whichever is shorter, in the range [0..1]
# TYPE jvm_gc_overhead_percent gauge
jvm_gc_overhead_percent{application="prometheus-demo",} 6.81195699160739E-4
# HELP jvm_buffer_total_capacity_bytes An estimate of the total capacity of the buffers in this pool
# TYPE jvm_buffer_total_capacity_bytes gauge
jvm_buffer_total_capacity_bytes{application="prometheus-demo",id="mapped",} 0.0
jvm_buffer_total_capacity_bytes{application="prometheus-demo",id="direct",} 81920.0
# HELP tomcat_sessions_alive_max_seconds
# TYPE tomcat_sessions_alive_max_seconds gauge
tomcat_sessions_alive_max_seconds{application="prometheus-demo",} 0.0
# HELP jvm_threads_peak_threads The peak live thread count since the Java virtual machine started or peak was reset
# TYPE jvm_threads_peak_threads gauge
jvm_threads_peak_threads{application="prometheus-demo",} 19.0
# HELP executor_active_threads The approximate number of threads that are actively executing tasks
# TYPE executor_active_threads gauge
executor_active_threads{application="prometheus-demo",name="applicationTaskExecutor",} 0.0
# HELP jvm_gc_max_data_size_bytes Max size of long-lived heap memory pool
# TYPE jvm_gc_max_data_size_bytes gauge
jvm_gc_max_data_size_bytes{application="prometheus-demo",} 1.32120576E9
# HELP tomcat_sessions_expired_sessions_total
# TYPE tomcat_sessions_expired_sessions_total counter
tomcat_sessions_expired_sessions_total{application="prometheus-demo",} 0.0
# HELP logback_events_total Number of events that made it to the logs
# TYPE logback_events_total counter
logback_events_total{application="prometheus-demo",level="info",} 6.0
logback_events_total{application="prometheus-demo",level="trace",} 0.0
logback_events_total{application="prometheus-demo",level="warn",} 0.0
logback_events_total{application="prometheus-demo",level="debug",} 0.0
logback_events_total{application="prometheus-demo",level="error",} 0.0
# HELP tomcat_sessions_rejected_sessions_total
# TYPE tomcat_sessions_rejected_sessions_total counter
tomcat_sessions_rejected_sessions_total{application="prometheus-demo",} 0.0
# HELP jvm_memory_usage_after_gc_percent The percentage of long-lived heap pool used after the last GC event, in the range [0..1]
# TYPE jvm_memory_usage_after_gc_percent gauge
jvm_memory_usage_after_gc_percent{application="prometheus-demo",area="heap",pool="long-lived",} 0.008799701266818576
3、安装
3.1 Prometheus安装
我们使用docker进行安装。
首先拉去镜像
# 拉取docker镜像
docker pull prom/prometheus准备配置文件prometheus.yml,${host1}、${host2}为变量,例如可以替换为localhost:8080
scrape_configs:
# 可随意指定
- job_name: 'spring'# 多久采集一次数据scrape_interval: 15s# 采集时的超时时间scrape_timeout: 10s# 采集的路径metrics_path: '/actuator/prometheus'# 采集服务的地址,设置成Springboot应用所在服务器的具体地址static_configs:- targets: ['${host1}','${host2}']
启动
--log.level=debug:日志以debug输出
--storage.tsdb.retention.time=3d,数据保留3天
--config.file=/etc/prometheus/prometheus.yml:容器里面的默认路径
docker run -d -p 9090:9090 -v /root/docker-images/prometheus/prometheus.yml:/etc/prometheus/prometheus.yml --name prometheus prom/prometheus:latest --log.level=debug --storage.tsdb.retention.time=3d --config.file=/etc/prometheus/prometheus.yml或者启动脚本
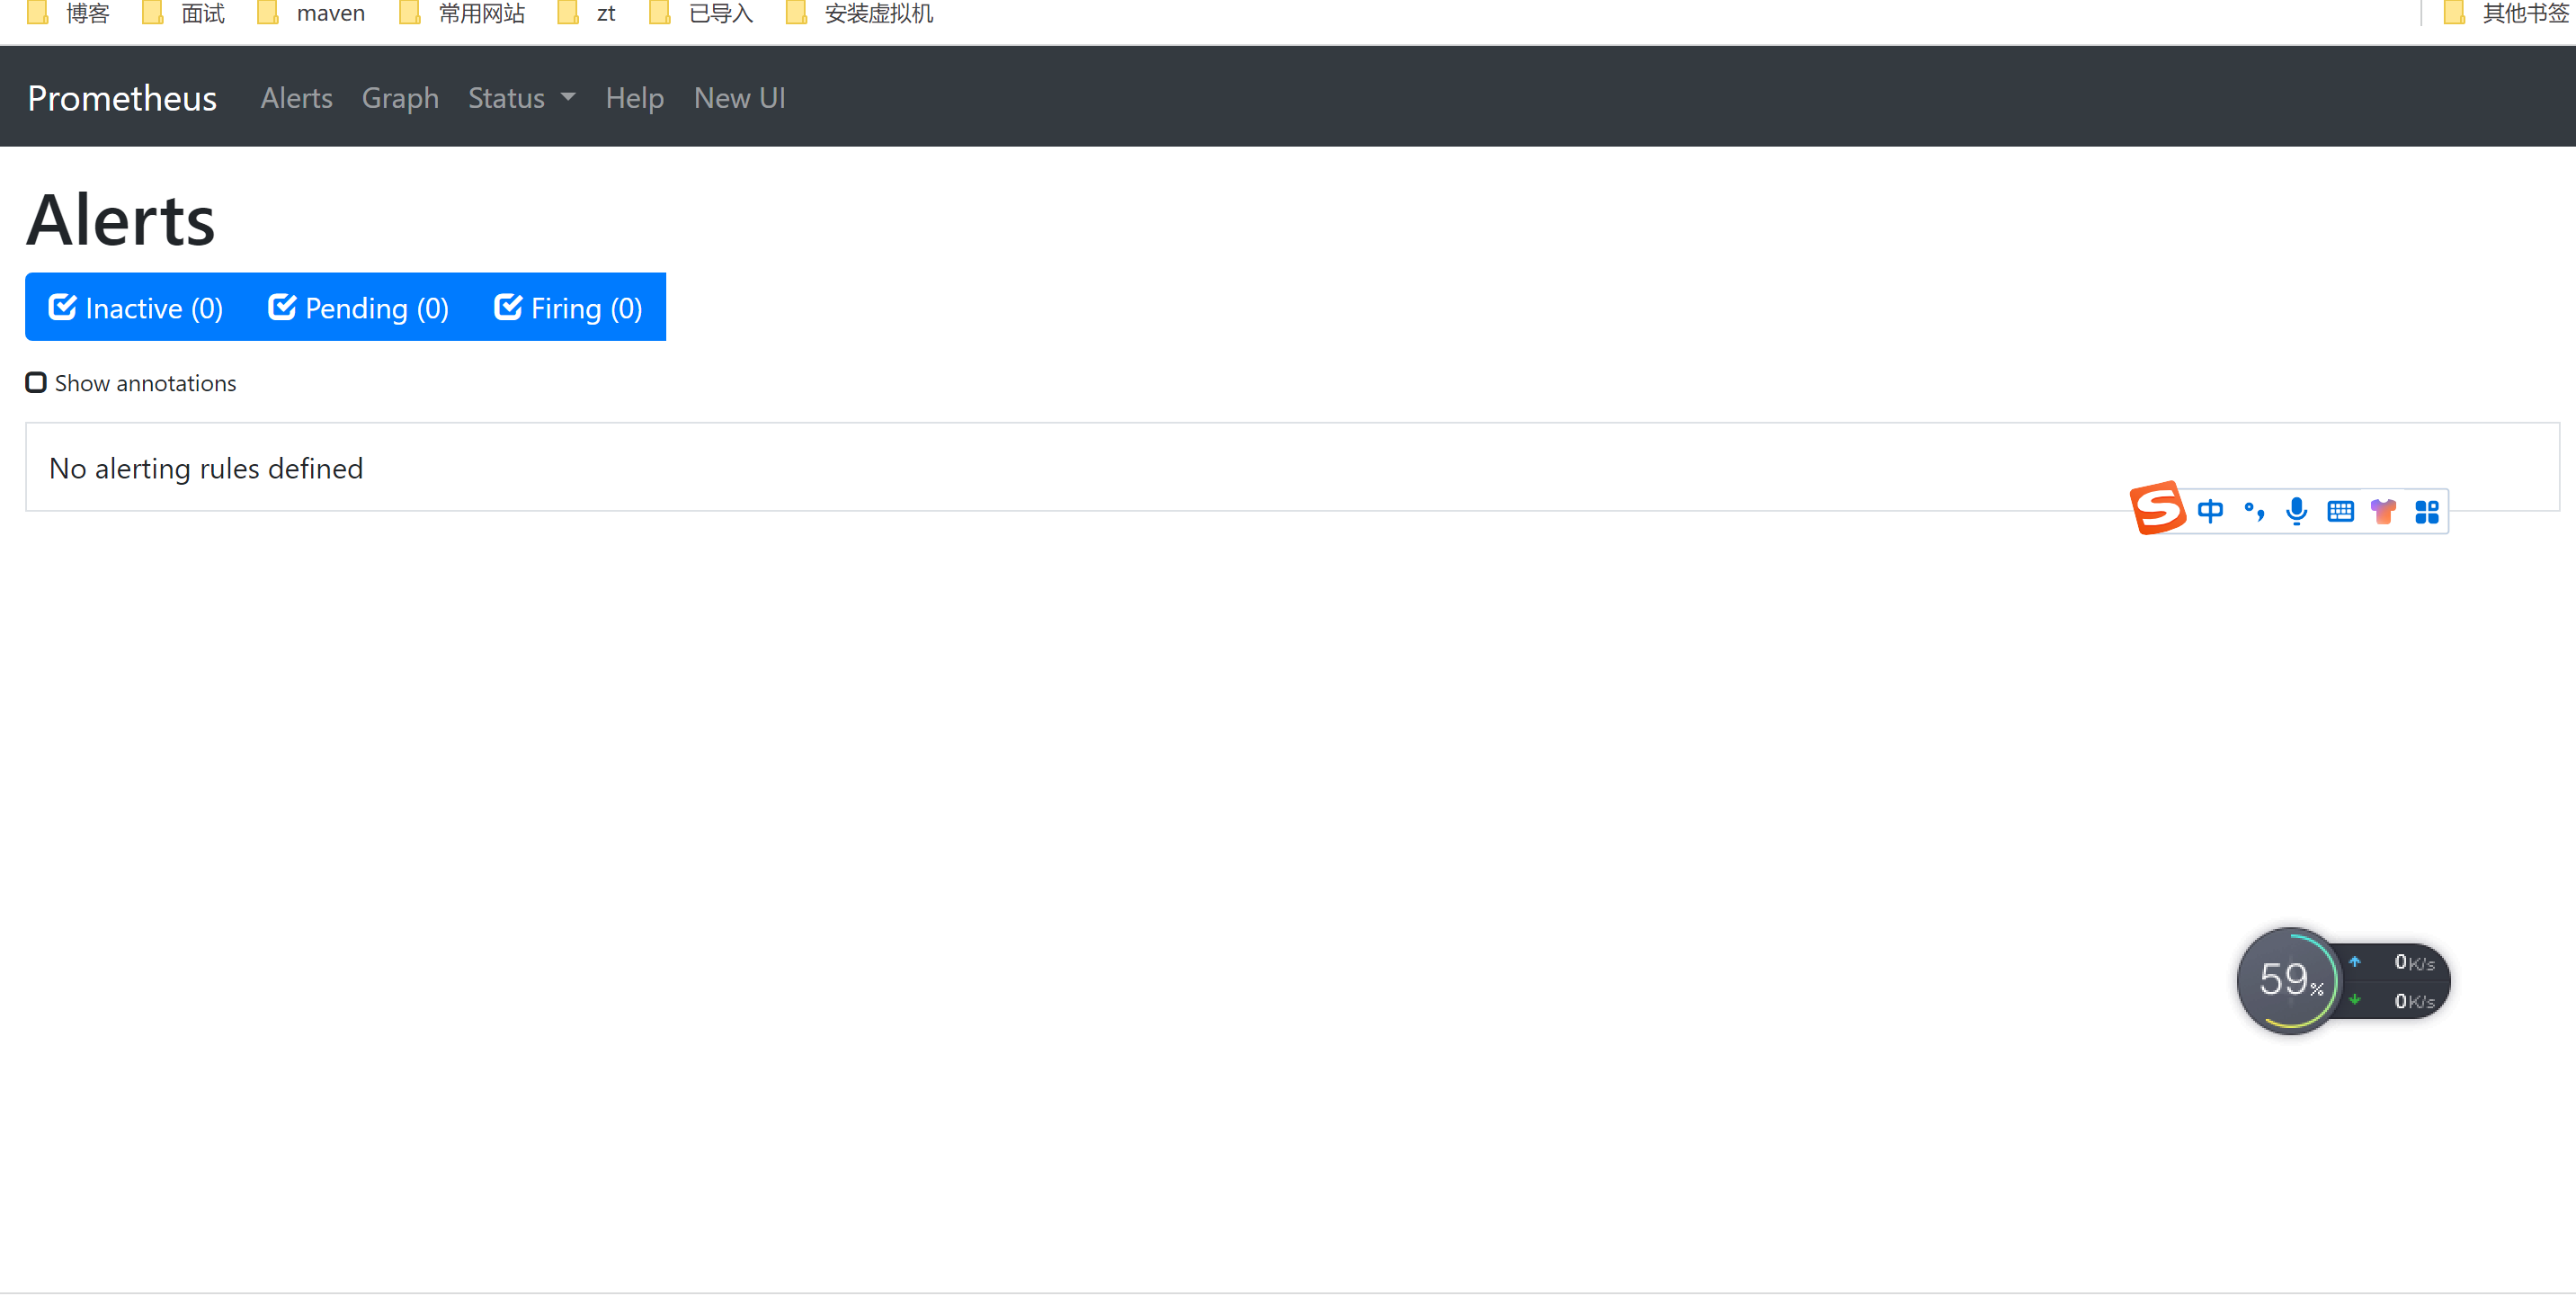
docker run -d -p 9090:9090 -v /root/docker-images/prometheus/prometheus.yml:/etc/prometheus/prometheus.yml --name prometheus prom/prometheus:latest --config.file=/etc/prometheus/prometheus.yml启动成功后,访问地址:http://${ip}:9090/,页面展示
3.2 Grafana安装
拉去镜像
docker pull grafana/grafana运行示例
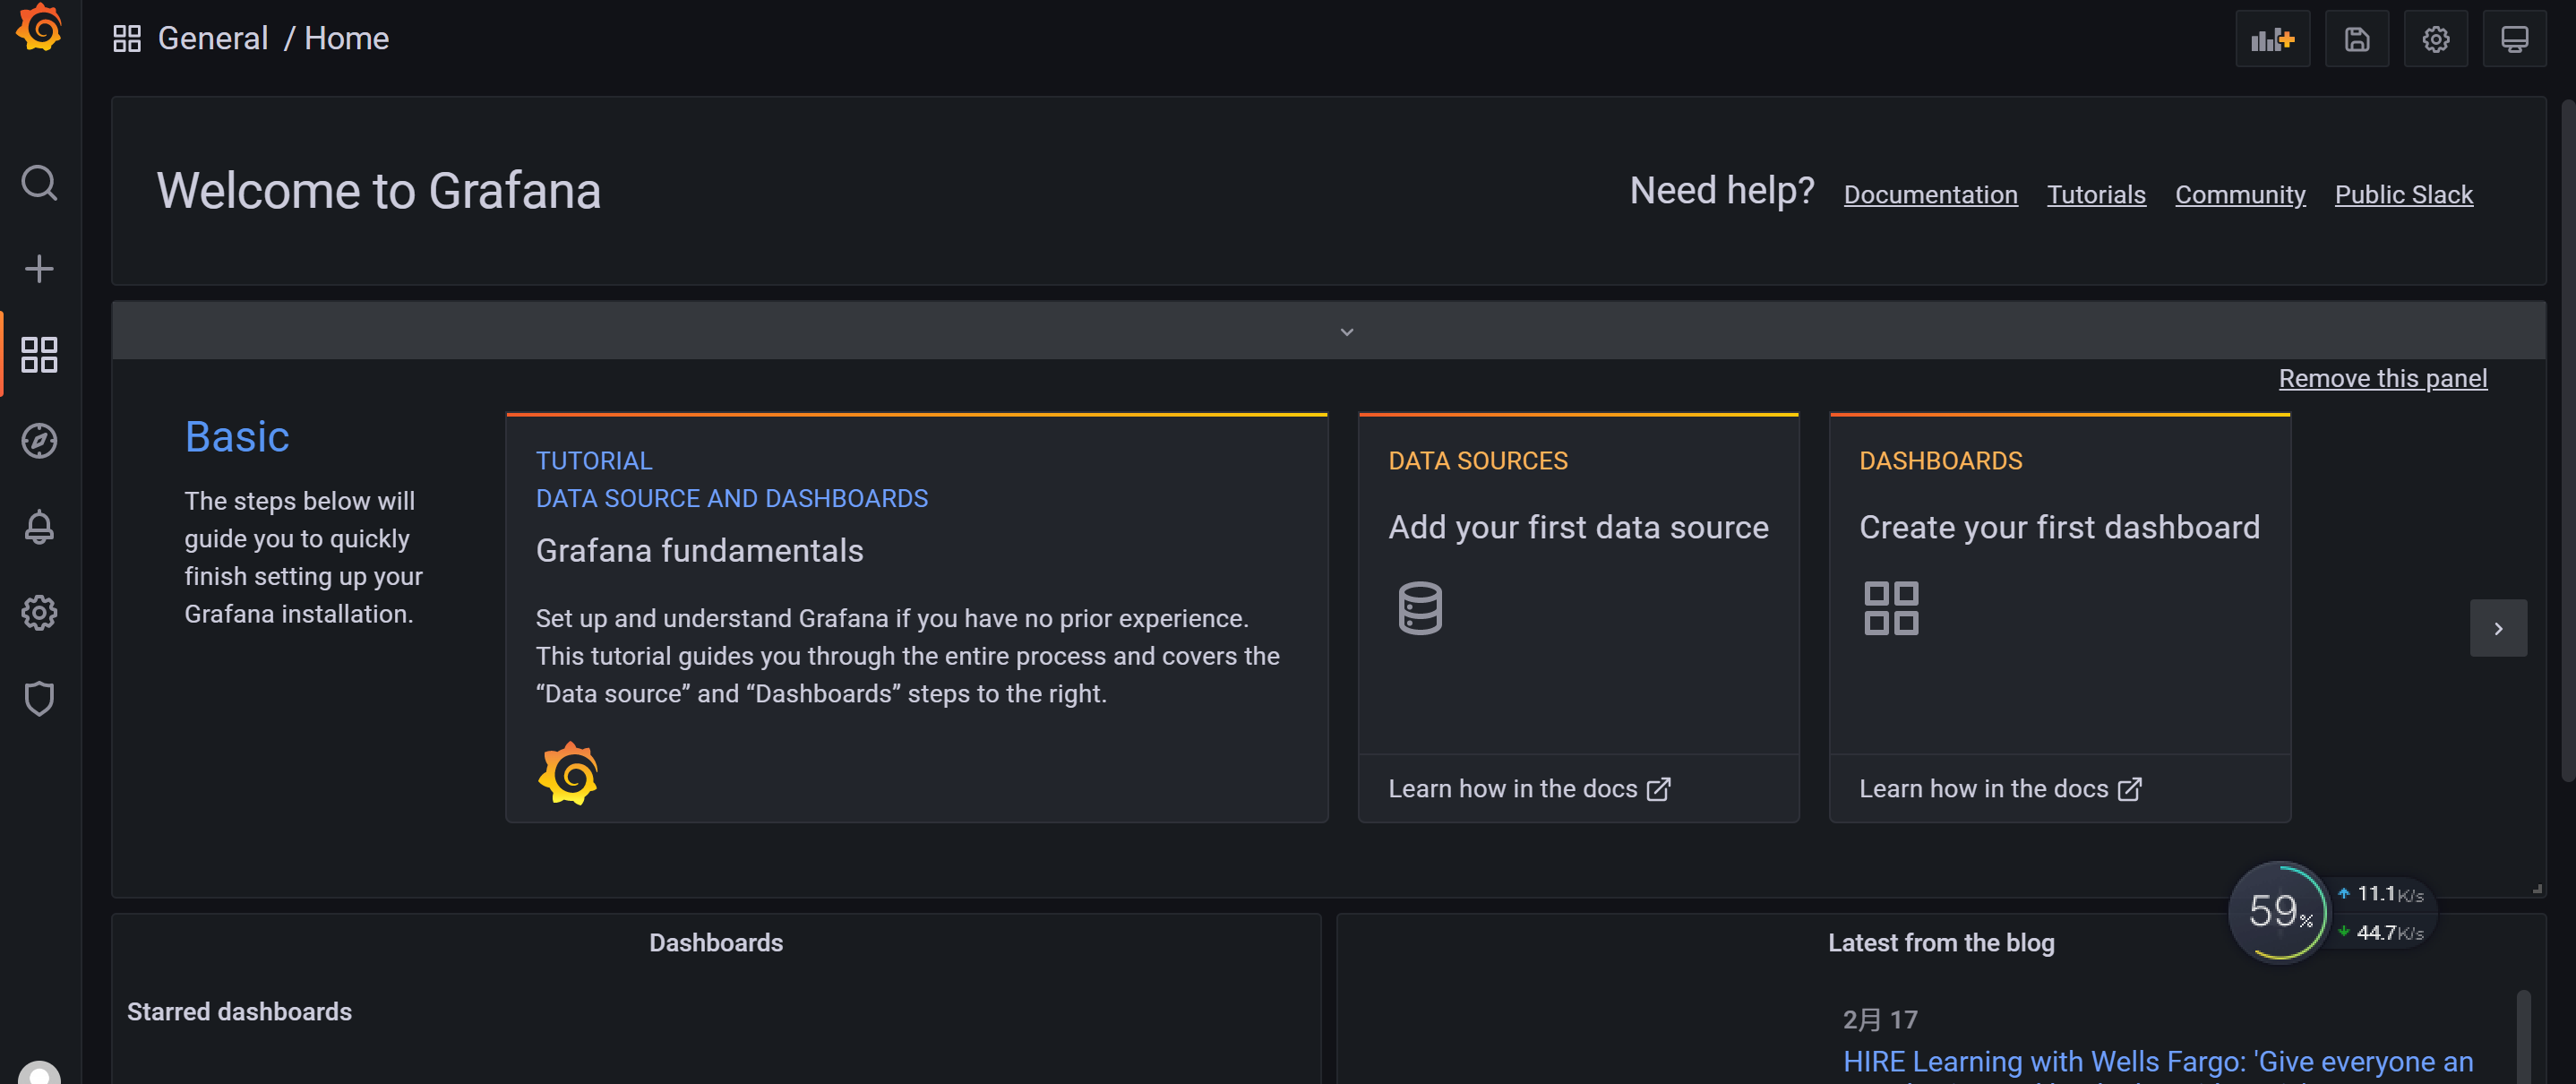
docker run -d -p 3000:3000 grafana/grafana访问地址:http://localhost:3000
账号:admin
密码:admin
页面展示
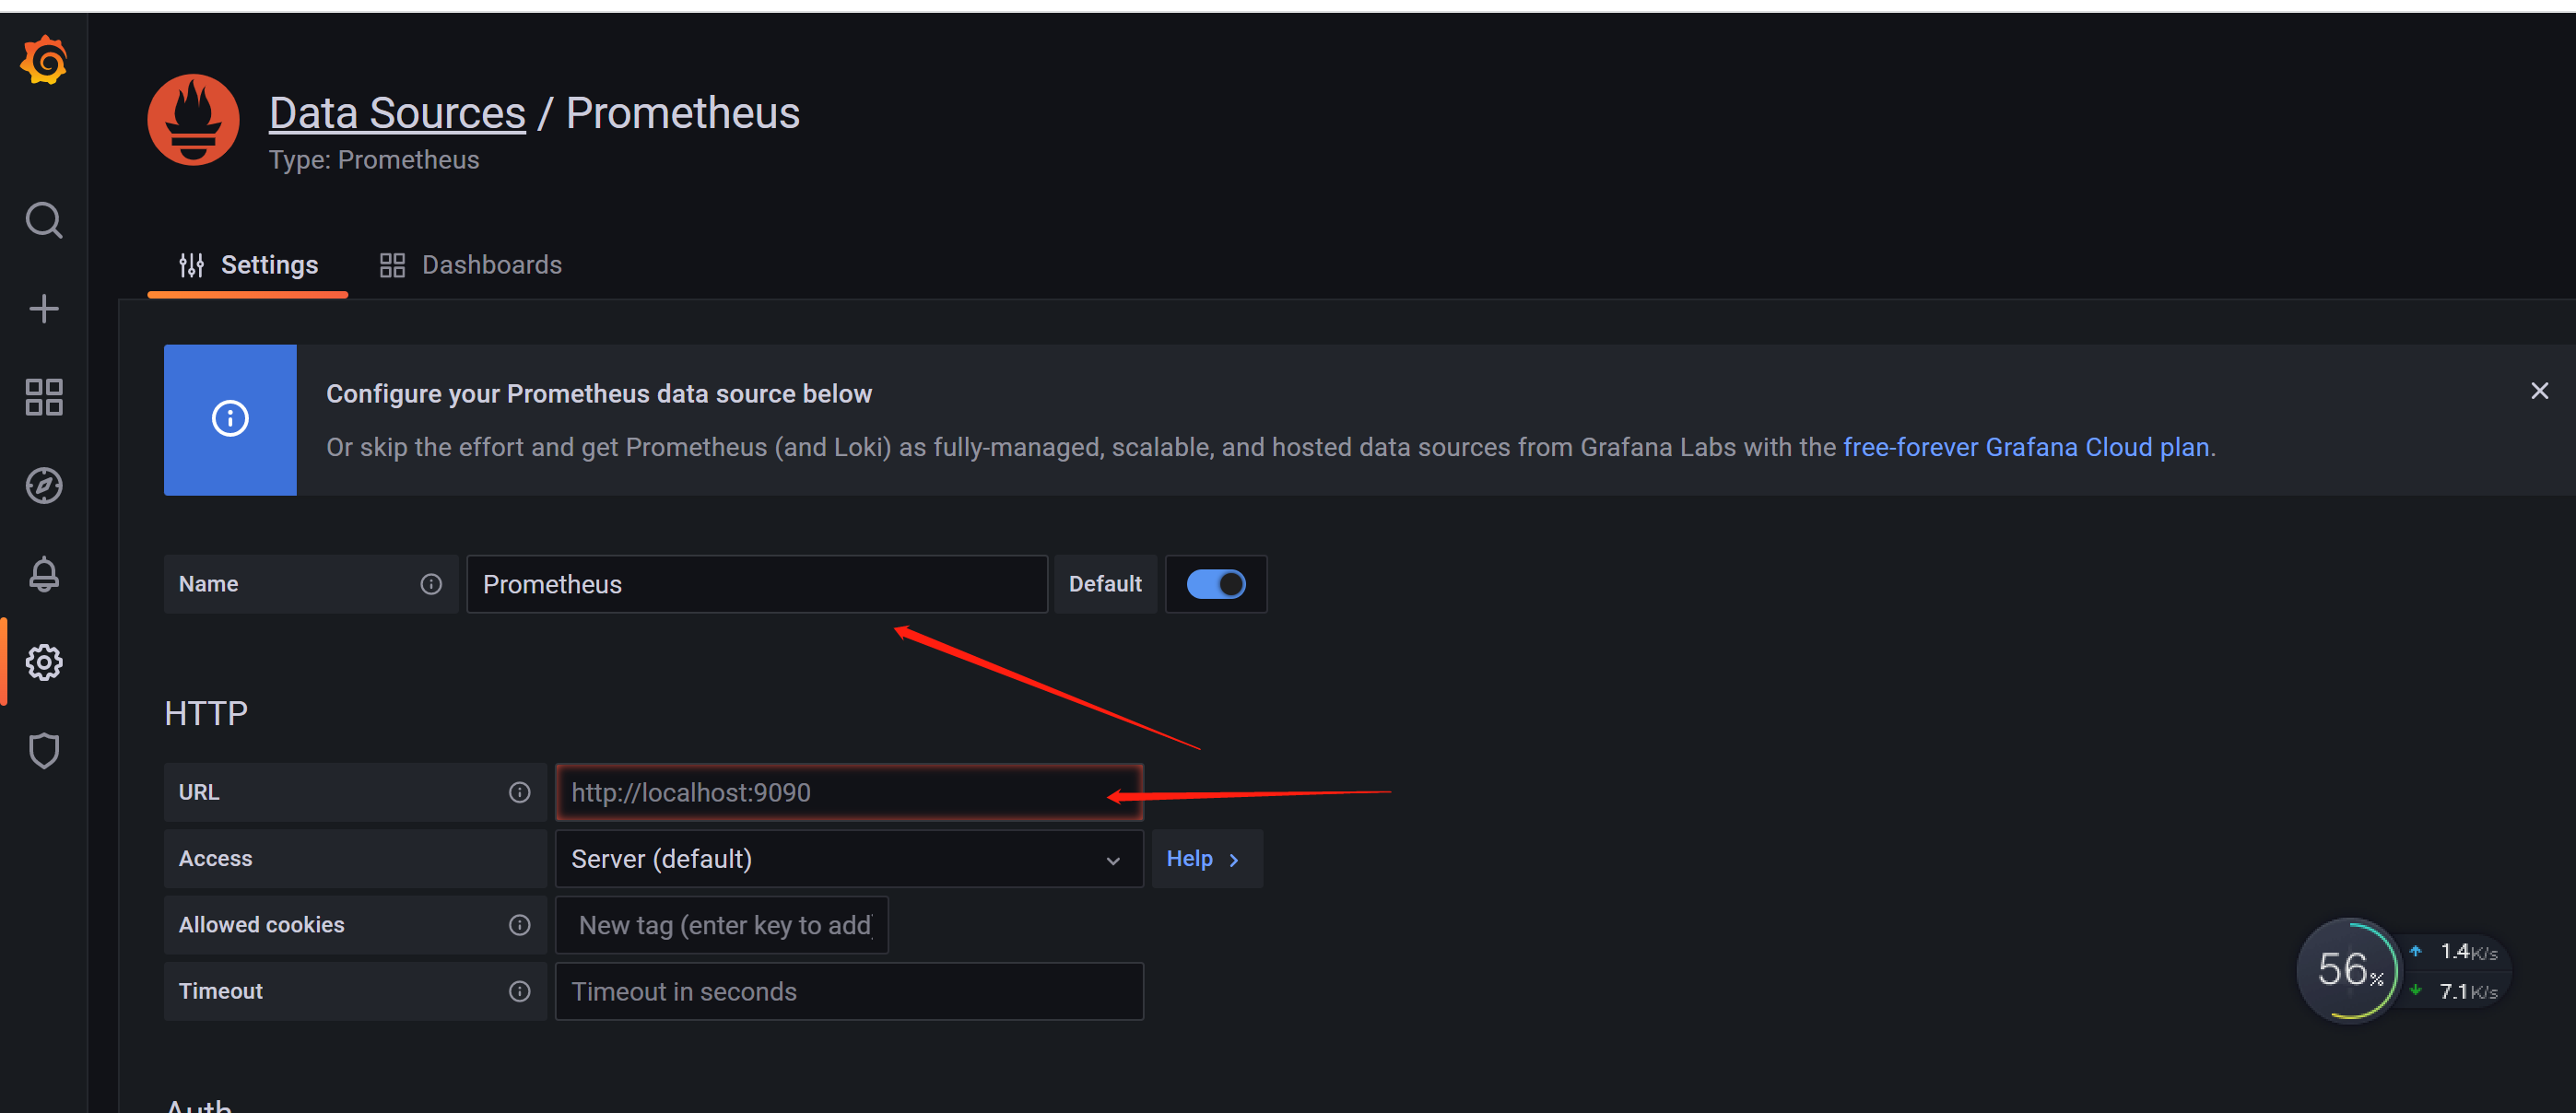
3.3 Grafana配置Prometheus数据源
(1)Date Sources--> 选择 Prometheus,配置 Name 和 URL,注意:Name必须为首字母大写Prometheus,不能全写成小写的prometheus。因为Prometheus和Grafana都是docker安装,所以url需要写外网地址。


(2)新建 Dashboard
Create Dashboard

配置title、description

配置Data Source

选择指标


保存

3.4 模板套用
Grafana提供了许多优秀的模板,可以网页https://grafana.com/grafana/dashboards 查找。

导入模板id


复制模板id


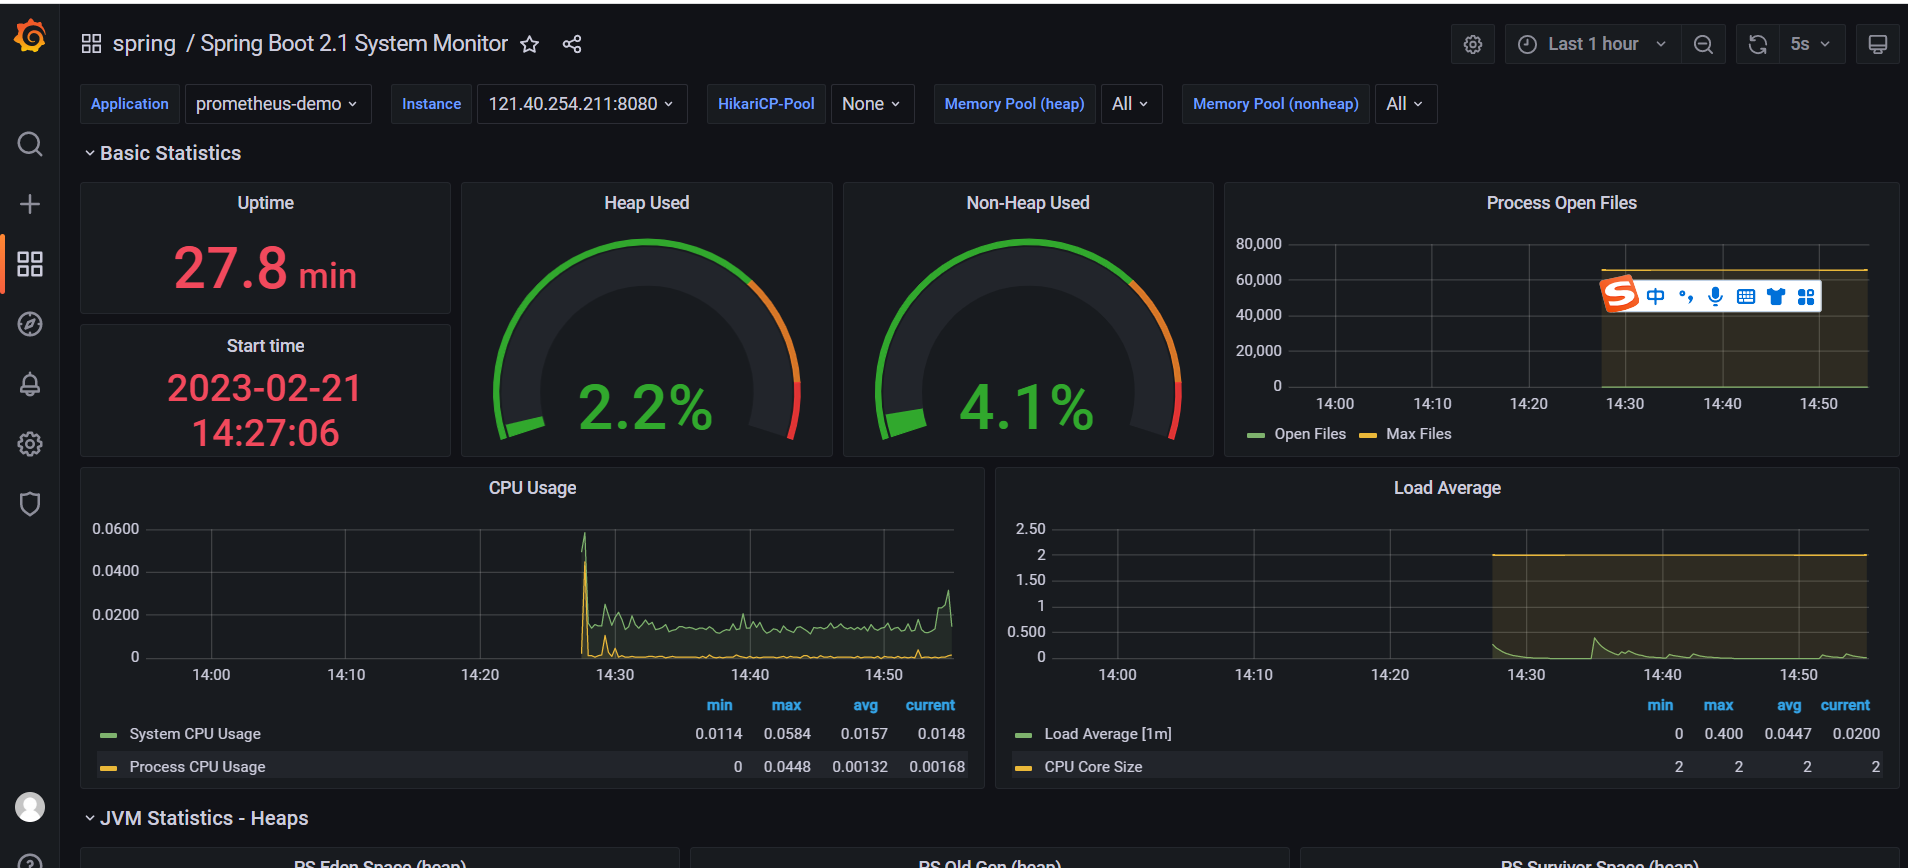
导入

导入后,可以看到监控效果了
相关文章:
Prometheus+Grafana监控
1、简介1.1 Prometheus官网地址:https://prometheus.io/Prometheus是一个开源的监控系统,起源于SoundCloud。它由以下几个核心组件构成:数据爬虫: 根据配置的时间定期的通过HTTP抓去metrics数据。time-series 数据库: …...

【JUC2022】第三章 线程中断与 LockSupport
【JUC2022】第三章 线程中断与 LockSupport 文章目录【JUC2022】第三章 线程中断与 LockSupport一、线程中断1.什么是中断机制2.中断 API3.代码实现4.Thread.sleep()二、LockSupport1.什么是 LockSupport2.代码实现3.总结一、线程中断 1.什么是中断机制 首先,一个…...
:202快乐数、1两数之和、454四数相加II、15三数之和、18四树之和)
数据结构刷题(七):202快乐数、1两数之和、454四数相加II、15三数之和、18四树之和
1.快乐数题目链接思路:使用set,当set中出现相同元素时,返回false注意:while循环中语句顺序; 除数取余。解法:public boolean isHappy(int n){Set<Integer> res new HashSet<>();int[] arr ne…...
)
华为机试题:HJ80 整型数组合并(python)
文章目录知识点详解1、input():获取控制台(任意形式)的输入。输出均为字符串类型。 1.1、int(input()) 与 map(int, input().spilt()) 的区别 1.2、input() 与 list(input()) 的区别、及其相互转换方法2、print() :打印输出…...
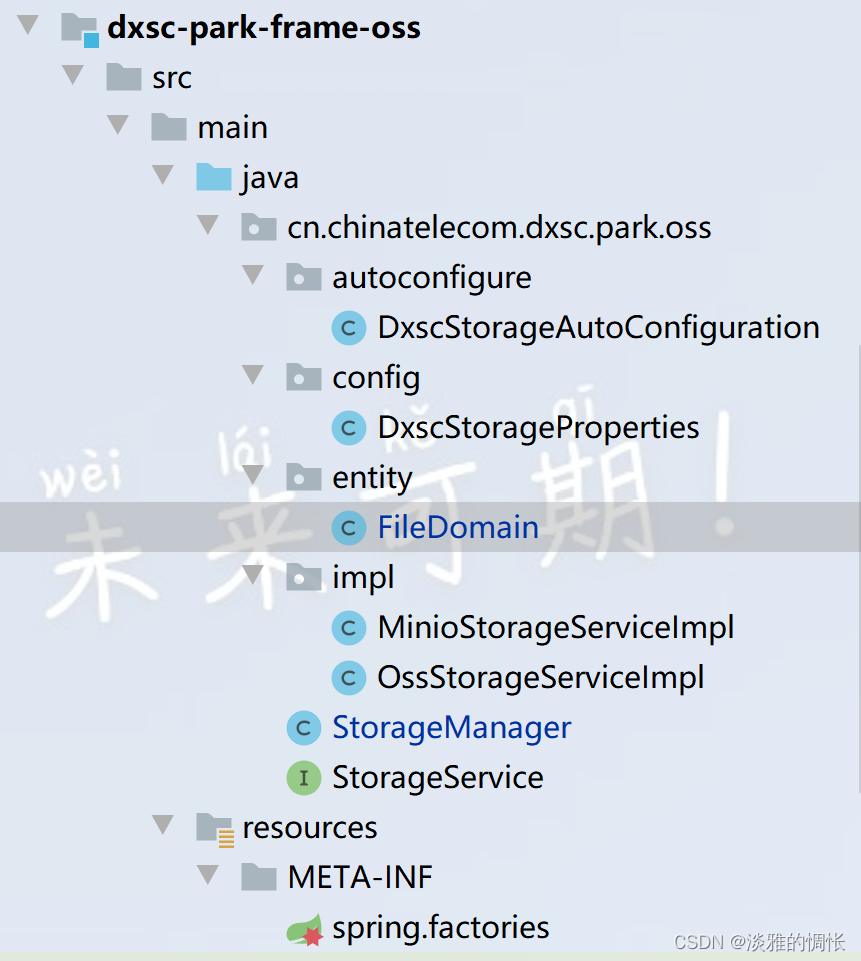
spring boot——自定义依赖实现自动配置
需求 要实现的功能是:实现一个可以支持miniooss两种方式,上传下载文件的自定义依赖。其中还包括一些创建桶、删除桶、删除文件等功能,但是最主要的是实现自动配置。 如果对spring理解很深的话,自动配置这些东西很容易理解&#…...
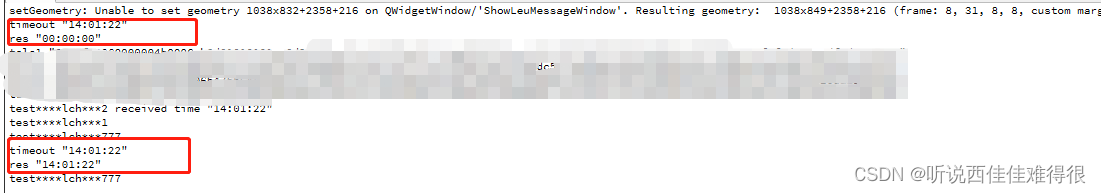
QMap 判断是否value是否已经存在,结合Sleep函数测试
网上查了资料,基本说的都是通过.value判断是否已经之前的key值,但是尝试.了一下发现有.key的函数,对比着来就感觉这个函数是用来判断是否已经存在value值,于是开始百度也几乎没有找到相关资料,只好自己看官方文档&…...
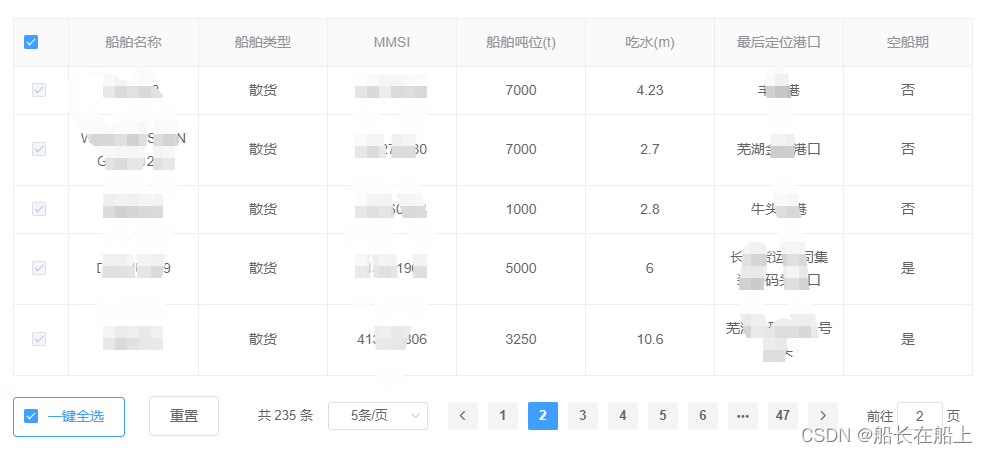
vue后台管理系统项目-table选择多行数据分页列表、一键全选重置功能
table选择多行数据 功能介绍: 1.列表分页功能; 2.一键全选,选中列表所有数据; 3.全选,选中当前页数据; 4.重置,清除选中状态; 5.列表搜索查询; 效果: 1.列表分…...
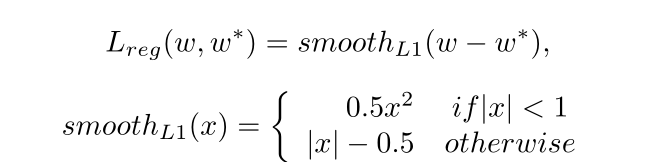
论文解读 | [CVPR2019] 基于自适应文本区域表示的任意形状场景文本检测
目录 1 研究背景及意义 2 总体设计 3 方法论 3.1 自适应文本区域表示 3.2 文本建议 3.3 建议改进 4 损失函数 5 实验及结果 1 研究背景及意义 现有的场景文本检测方法使用固定点数的多边形来 表示文本区域。例如,水平文本使用2个点(左上/右下)表示文本区域&…...

2月编程语言排行榜谁还没有看?
近日,TIOBE公布了2023年2月编程语言排行榜,本月各个语言表现如何?谁又摘得桂冠?一起来看看吧! TIOBE 2月Top15编程语言: 详细榜单查看TIOBE官网 https://www.tiobe.com/tiobe-index/ 关注IT行业的小伙伴们…...
nginx.conf配置方法详细介绍
从前面的内容学习中,我们知道Nginx的核心配置文件默认是放在/usr/local/nginx/conf/nginx.conf,这一节,我们就来学习下nginx.conf的内容和基本配置方法。读取Nginx自带的Nginx配置文件,我们将其中的注释部分【学习一个技术点就是在…...

【微信小程序】一文带你吃透开发中的常用组件
写在前面 小程序中的组件也是由宿主环境提供的,开发者可以基于组件快速搭建出漂亮的页面结构。 官方把小程序的组件分为了9大类,分别是: 1.视图容器 2.基础内容 3.表单组件 4.导航组件 5.媒体组件 6.地图组件 7.画布组件 …...
Nginx 部署 Vue 项目以及 Vue 项目刷新出现 404 的问题(完整步骤)(亲测有效)
Nginx 部署 Vue 项目以及 Vue 项目刷新出现 404 的问题(完整步骤)(亲测有效) 1.流程步骤(本教程下载的是1.20.2版本,放在D盘) 1-1. 首先去官方下载 nginx ,然后在当前目录下创建ht…...
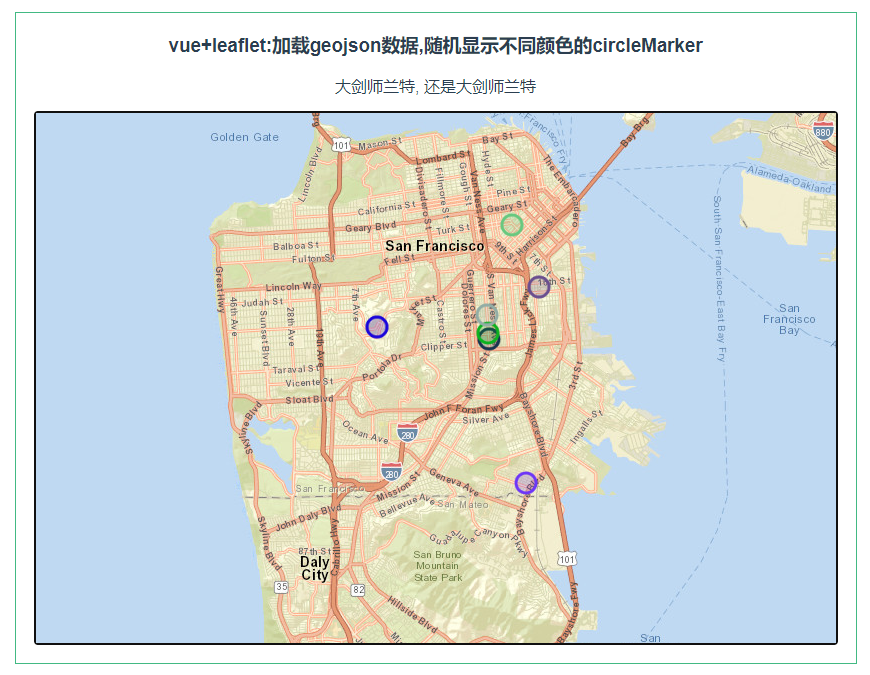
leaflet 加载geojson数据,随机显示不同颜色的circleMarker
第086个 点击查看专栏目录 本示例的目的是介绍演示如何在vue+leaflet项目中加载geojson数据,随机显示不同颜色的circleMarker. 直接复制下面的 vue+leaflet源代码,操作2分钟即可运行实现效果 文章目录 示例效果配置方式示例源代码(共89行)相关API专栏目标示例效果 配置方式…...
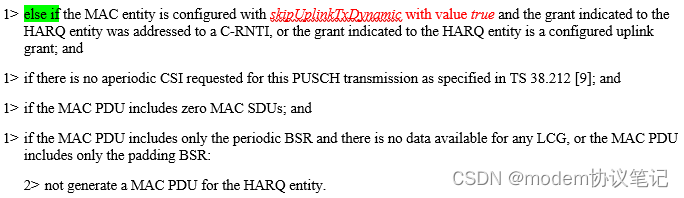
UL grant的分配(LCP)
欢迎关注同名微信公众号“modem协议笔记”。 UE有UL data时,会发送BSR的告知网络侧自己详细的请求,期望网络能够如期下发UL grant,正常情况下网络侧会给UE足够的UL grant去发送UL data,整个过程都会比较顺利。UE收到UL grant后&a…...
真我air笔记本电脑怎么重装Win10系统?
真我air笔记本电脑怎么重装Win10系统?最近真我air笔记本电脑挺多用户购买的,因为这款电脑性价比比较高,适合学生和一些办公人员来使用。但是系统预制了Win11系统,有用户想要将系统重装到Win10来使用。那么如何去进行系统的重装呢&…...
【闲聊杂谈】深入剖析SpringCloud Alibaba之Nacos源码
Nacos核心功能点 服务注册 Nacos Client会通过发送REST请求的方式向Nacos Server注册自己的服务,提供自身的元数据,比如ip地址、端口等信息。Nacos Server接收到注册请求后,就会把这些元数据信息存储在一个双层的内存Map中; 服…...

MySQL删除或清空表内数据的方法
MySQL删除或清空表内数据的方法 一、使用MySQL清空表数据命令:truncate SQL语法为: truncate table 表名注意: truncate该命令会直接将数据表内数据清空;truncate该命令删除数据后会重置Identity(标识列、自增字段…...
: 动态权限讲解)
Android 权限(二): 动态权限讲解
1. 前言 继上一篇文章说到Android权限汇总, 请移步笔者的文章Android 权限(一):权限大全_broadview_java的博客-CSDN博客_android 仅使用中允许权限 先要理清楚权限分类和定义,本篇文章继续说一下动态权限的申请和框架层的实现流程, 以及如何实现赋予系统应用默认的…...
【C++】2.类和对象(上)
1.面向过程和面向对象 C语言是面向过程的,关注的是过程,分析出求解问题的步骤,通过函数调用逐步解决问题。C是基于面向对象的,关注的是对象,将一件事情拆分成不同的对象,靠对象之间的交互完成。 2.类的引入…...

扬帆优配|3300点半日游!上证指数冲高回落;再迎重磅利好!
今天早盘,A股冲高回落,上证指数3300点得而复失,深证成指也于12000点无功而返。 盘面上,煤炭、钢铁、房地产、才智政务等板块涨幅居前,酿酒、酒店餐饮、日用化工、IT设备等板块跌幅居前。北上资金净流入7.77亿元。 房地…...
实战选型指南)
别再乱用分支了!Flowable四种网关(排他/并行/包容/事件)实战选型指南
Flowable四大网关实战选型:从混乱到精准的决策艺术当你在设计一个请假审批流程时,是否遇到过这样的困惑:部门经理审批后需要同时通知HR和财务,但某些特殊情况下又需要跳过财务直接归档?这种看似简单的业务需求…...

DeepSeek代码质量评估实战手册:7步完成从混沌到可度量的质变跃迁
更多请点击: https://kaifayun.com 第一章:DeepSeek代码质量评估的底层逻辑与核心价值 DeepSeek代码质量评估并非简单地统计行数或检测语法错误,而是基于多维语义理解构建的推理系统。其底层逻辑融合了静态分析、符号执行与大语言模型生成式…...

航空航天为什么离不开高强镁合金?国产替代到哪一步了
飞机每减重一千克,全年大约节省四千两百美元的燃油费用——这是航空工程师熟悉的经验值。在商业航空领域,这个数字还只是财务账;在战斗机、导弹和卫星的世界里,减重的收益被换算成更远的航程、更大的载荷、更高的机动性࿰…...
)
Postgresql基础实践教程(九)
⭐️⭐️⭐️⭐️⭐️ 完整数据详见 练习数据免费 ⭐️⭐️⭐️⭐️⭐️ 七十二、WITH查询(公用表表达式CTE) 1. SELECT 中的 WITH 2. 递归查询 3. 公用表表达式的物化 4. WITH中的数据修改语句 WITH提供了一种在主查询中写辅助语句的方法。这些语…...

Taotoken的审计日志功能为企业API安全与合规管理提供支持
🚀 告别海外账号与网络限制!稳定直连全球优质大模型,限时半价接入中。 👉 点击领取海量免费额度 Taotoken的审计日志功能为企业API安全与合规管理提供支持 当企业决定将大模型能力集成到内部业务流程中时,IT管理员和安…...

基于SMD与贝壳的微型音频装置:从电路设计到嵌入式开发的完整实践
1. 项目概述:一个藏在贝壳里的声音世界你小时候有没有捡起一个海螺壳,把它贴在耳边,然后听到里面传来“呜呜”的海风声?那个瞬间,仿佛整个海洋都被装进了小小的贝壳里。今天这个项目,就是把那个童年的魔法&…...
3分钟搞定专业短视频!Pixelle-Video终极AI创作指南
3分钟搞定专业短视频!Pixelle-Video终极AI创作指南 【免费下载链接】Pixelle-Video 🚀 AI 全自动短视频引擎 | AI Fully Automated Short Video Engine 项目地址: https://gitcode.com/GitHub_Trending/pi/Pixelle-Video 还在为视频制作发愁吗&am…...

DIY智能USB充电器:基于电流检测与双稳态继电器的零功耗节能方案
1. 项目概述:打造一款智能、节能的USB手机充电器作为一名电子爱好者,我经常折腾各种电源项目。市面上很多手机充电器,包括一些原装货,都存在一个通病:手机充满电后,充电器依然插在插座上,内部电…...

Godot 4.2 + C# 避坑指南:手把手教你打包发布你的第一个2D游戏到Steam
Godot 4.2 C# 避坑指南:从开发到Steam发布的完整实战手册当你终于完成心爱的2D游戏开发,准备向全世界展示你的作品时,打包发布这个看似简单的环节往往会成为独立开发者最大的噩梦。特别是使用Godot 4.2搭配C#的项目,从导出设置到…...

为内部知识库问答机器人集成taotoken多模型能力的架构设计
🚀 告别海外账号与网络限制!稳定直连全球优质大模型,限时半价接入中。 👉 点击领取海量免费额度 为内部知识库问答机器人集成taotoken多模型能力的架构设计 应用场景类,探讨为企业内部知识库构建智能问答机器人时&…...