Qt 画自定义饼图统计的例子
先给出结果图,这个例子是将各种事件分类然后统计的其比例,然后画饼图显示出来
这个是我仿照官方给的例子,让后自己理解后,修改的,要生成饼图,需要QT的 charts 支持,安装QT 没有选择这个的,需要下载这个模块,然后在.pro文件中年添加
QT += charts
首先重写饼图块,让鼠标悬浮在某个饼图块时,让这个块弹出来,然后显示块的信息,这个比较简单,如下所示
//头文件
#include <QtCharts/QPieSlice>QT_CHARTS_USE_NAMESPACEclass CustomSlice : public QPieSlice
{Q_OBJECTpublic:CustomSlice(QString label, qreal value);public Q_SLOTS:void showHighlight(bool show);};//cpp文件#include "customslice.h"QT_CHARTS_USE_NAMESPACECustomSlice::CustomSlice(QString label, qreal value): QPieSlice(label, value)
{connect(this, &CustomSlice::hovered, this, &CustomSlice::showHighlight);
}void CustomSlice::showHighlight(bool show)
{setLabelVisible(show);//显示标签setExploded(show); // 弹出
}
主体代码如下,主要是初始化饼图,创建饼图,为饼图块随机上色,为饼图数据的显示做排序,只需要调用接口函数把相应的数据塞进去即可生成可视化的饼图
statisticwindow.h
#ifndef STATISTICCHARTSWINDOW_H
#define STATISTICCHARTSWINDOW_H#include <QWidget>
#include <QVBoxLayout>
#include <QtCharts/QPieSeries>
#include <QtCharts/QBarCategoryAxis>
#include <QtCharts/QValueAxis>
#include <QtCharts/QChartView>class QPushButton;
class CustomSlice;
QT_CHARTS_USE_NAMESPACEclass StatisticChartsWindow : public QWidget
{Q_OBJECT
public:explicit StatisticChartsWindow(QWidget *parent = nullptr);~StatisticChartsWindow();//创建一个饼图1void createPie1(QMap<QString, int> data, QString title);//创建一个饼图2void createPie2(QMap<QString, int> data, QString title);// 为饼图1添加块信息void appendSlice1(QString lable, int value);// 为饼图2添加块信息void appendSlice2(QString lable, int value);// 移除所有块信息void removeAllSlice();// 获取随机颜色为饼图的每个块上色Qt::GlobalColor getRandomColor();//获取排序后的数据QList<QMap<QString, int>> getsortListByValue(QMap<QString, int> &data);QVBoxLayout *VBoxLayout;QPieSeries *series1;QPieSeries *series2;QChart *chart1;QChart *chart2;QChartView *chartView1;QChartView *chartView2;QPushButton *closeButton;QList<CustomSlice*> CustomSlice1List;QList<CustomSlice*> CustomSlice2List;QList<Qt::GlobalColor> colorList;signals:void closeSig();public slots:
};#endif // STATISTICCHARTSWINDOW_H
statisticwindow.cpp
#include "statisticwindow.h"
#include <QtCharts/QBarSeries>
#include <QtCharts/QBarSet>
#include <QtCharts/QLegend>
#include <QtCharts/QPieSeries>
#include <QtCharts/QBarCategoryAxis>
#include <QtCharts/QValueAxis>
#include <QtCharts/QChartView>
#include <QVBoxLayout>
#include <QHBoxLayout>
#include <QSpacerItem>
#include <QRandomGenerator>
#include "customslice.h"
#include <QPushButton>
#include "pushbutton.h"StatisticChartsWindow::StatisticChartsWindow(QWidget *parent) : QWidget(parent)
{VBoxLayout = new QVBoxLayout(this);series1 = new QPieSeries(this);// 饼图一chart1 = new QChart();chart1->setAnimationOptions(QChart::AllAnimations);chart1->legend()->setVisible(true);chart1->legend()->setAlignment(Qt::AlignRight);//设置标签在右侧chartView1 = new QChartView(chart1);series2 = new QPieSeries(this);// 饼图一chart2 = new QChart();chart2->setAnimationOptions(QChart::AllAnimations);chart2->legend()->setVisible(true);chart2->legend()->setAlignment(Qt::AlignRight);//设置标签在右侧chartView2 = new QChartView(chart2);//底部添加关闭按钮closeButton = new QPushButton("关闭", this);QHBoxLayout *hlayout = new QHBoxLayout();hlayout->addItem(new QSpacerItem(20, 20, QSizePolicy::Expanding, QSizePolicy::Minimum));hlayout->addWidget(closeButton);hlayout->addItem(new QSpacerItem(20, 20, QSizePolicy::Expanding, QSizePolicy::Minimum));//SC3C::Valwell::PushButton::initStyle(closeButton);QPalette palette = closeButton->palette();QColor color(19, 46, 74); // RGB红色palette.setColor(QPalette::Button, color);closeButton->setPalette(palette);closeButton->setStyleSheet("color: white;");colorList<<Qt::red<<Qt::white<<Qt::darkGray<<Qt::gray<<Qt::lightGray<<Qt::red<<Qt::green<<Qt::blue<<Qt::cyan<<Qt::magenta<<Qt::yellow<<Qt::darkRed<<Qt::darkGreen<<Qt::darkBlue<<Qt::darkCyan;chartView1->chart()->setTheme(QChart::ChartThemeBlueCerulean);chartView2->chart()->setTheme(QChart::ChartThemeBlueCerulean);VBoxLayout->addWidget(chartView1);VBoxLayout->addWidget(chartView2);VBoxLayout->addLayout(hlayout);VBoxLayout->layout()->setSpacing(1);//底部添加关闭connect(closeButton, &QPushButton::clicked, [=]() {this->hide();emit closeSig();});this->setWindowFlags(this->windowFlags() | Qt::WindowCloseButtonHint);this->setStyleSheet("background-color: rgb(19, 46, 74);");
}StatisticChartsWindow::~StatisticChartsWindow()
{if(chart1) {delete  chart1;}if(chart2) {delete  chart2;}
}void StatisticChartsWindow::createPie1(QMap<QString, int> data, QString title)
{// 创建一个饼图系列series1->clear();int count=0; //计算总数QMap<int, QList<QString>> map;for(auto it=data.begin(); it!=data.end(); it++) {count += it.value();}QList<QMap<QString, int>> sortList = getsortListByValue(data);// 根据条数比例排序,从大到小for(QMap<QString, int> map: sortList) {QString keyLable = map.firstKey();int num = map.value(keyLable);double ratio = num/1.0/count*100;QString ratioStr = QString::number(ratio, 'f', 1);QString lable = QString("%1,条数:%2,占比,%3%").arg(keyLable).arg(num).arg(ratioStr);appendSlice1(lable, num); // 添加到饼图中}// 创建一个新的图表并添加系列chart1->setTitle(title);//chart1->removeAllSeries();chart1->addSeries(series1);
}void StatisticChartsWindow::createPie2(QMap<QString, int> data, QString title)
{// 创建一个饼图系列series2->clear();int count=0; //计算总数QMap<int, QList<QString>> map;for(auto it=data.begin(); it!=data.end(); it++) {count += it.value();}QList<QMap<QString, int>> sortList = getsortListByValue(data);for(QMap<QString, int> map: sortList) {QString keyLable = map.firstKey();int num = map.value(keyLable);double ratio = num/1.0/count*100;QString ratioStr = QString::number(ratio, 'f', 1);QString lable = QString("%1,条数:%2,占比,%3%").arg(keyLable).arg(num).arg(ratioStr);appendSlice2(lable, num);}// 创建一个新的图表并添加系列chart2->setTitle(title);//chart2->removeAllSeries();chart2->addSeries(series2);
}void StatisticChartsWindow::appendSlice1(QString lable, int value)
{CustomSlice *customSlice = new  CustomSlice(lable, value);customSlice->setBrush(QBrush(getRandomColor())); //设置填充颜色//customSlice->setPen(QPen(Qt::black)); //设置线条颜色CustomSlice1List.append(customSlice);*series1 << customSlice;
}void StatisticChartsWindow::appendSlice2(QString lable, int value)
{CustomSlice *customSlice = new  CustomSlice(lable, value);customSlice->setBrush(QBrush(getRandomColor())); //设置填充颜色CustomSlice2List.append(customSlice);*series2 << customSlice;}void StatisticChartsWindow::removeAllSlice()
{for(CustomSlice* custom: CustomSlice1List) {series1->remove(custom);}for(CustomSlice* custom: CustomSlice2List) {series2->remove(custom);}qDeleteAll(CustomSlice1List);qDeleteAll(CustomSlice2List);CustomSlice1List.clear();CustomSlice2List.clear();
}Qt::GlobalColor StatisticChartsWindow::getRandomColor()
{int randomValue = QRandomGenerator::global()->bounded(0, colorList.size()-1);return colorList.takeAt(randomValue);
}QList<QMap<QString, int>> StatisticChartsWindow::getsortListByValue(QMap<QString, int> &data)
{QList<QMap<QString, int>> sortList;QList<int> valueList;for(auto it=data.begin(); it!=data.end(); it++) {if(!valueList.contains(it.value())) {valueList.append(it.value());}}//根据值逆序排序std::sort(valueList.begin(), valueList.end(), std::greater<int>());for(int value: valueList) {for(QString key: data.keys(value)) {QMap<QString, int> map;map.insert(key, value);sortList.append(map);}}return sortList;
}
我的这个例子是,点击统计按钮之后,获取相应的数据,然后生成相应的饼图
QObject::connect(ui.statisticsBtn, &QPushButton::clicked, [=]() {g_dataCache->setSystemLog(SC3C::eSystemLogType::QUERY_SYSTEMLOG, QString("成功"),"查看日志统计");StatisticChartsWindow window;if(StatisticWindow) {tableView->hide();StatisticWindow->show();return;}StatisticWindow = new StatisticChartsWindow(q);QObject::connect(StatisticWindow, &StatisticChartsWindow::closeSig, q, [=]() {tableView->show();});// 标签名, 数量QMap<QString, int> map1 = { };QMap<QString, int> map2 = { };int logType = ui.logType->currentData().toInt();int eventType = ui.eventType->currentData().toInt();QString Name = ui.operatorName->currentText();tableModel.second->setFilterOperator("所有");// 获取数据,map1表示饼图一需要的数据getEventTypeStatisticHash(map1, map2);//恢复之前显示的tableModel.second->setFilterType(logType, eventType);tableModel.second->setFilterOperator(Name);//SC3C::Valwell::Widget::setBackgroundCommon2WithMargins(window);StatisticWindow->setFixedSize(q->size());//StatisticWindow->setStyleSheet("background-color: transparent;");StatisticWindow->createPie1(map1, "事件类型统计");StatisticWindow->createPie2(map2, "日志类型统计");StatisticWindow->show();tableView->hide();});只需要把map放入创建饼图的函数即可,map中对应的是QMap<标签名,数量>,也就是饼图右侧的标签
StatisticWindow->createPie1(map1, "事件类型统计");StatisticWindow->createPie2(map2, "日志类型统计");这样就可以出饼图了
相关文章:
Qt 画自定义饼图统计的例子
先给出结果图,这个例子是将各种事件分类然后统计的其比例,然后画饼图显示出来 这个是我仿照官方给的例子,让后自己理解后,修改的,要生成饼图,需要QT的 charts 支持,安装QT 没有选择这个的&#…...
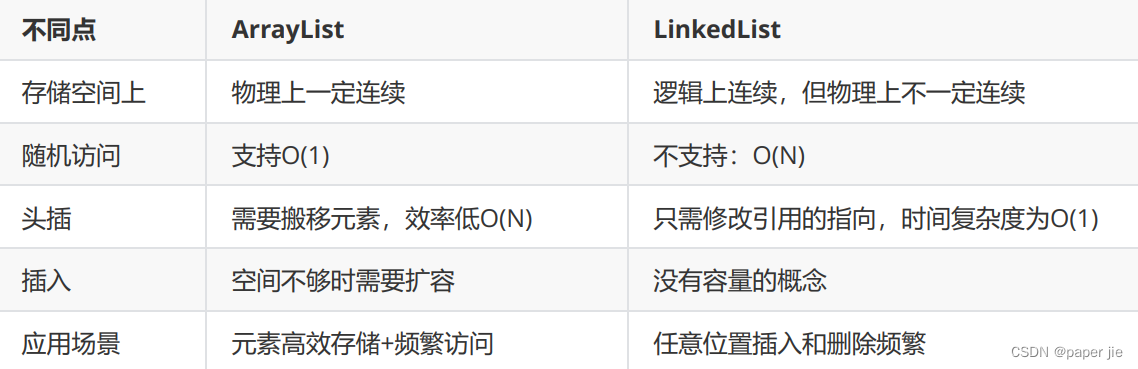
【数据结构】链表与LinkedList
作者主页:paper jie 的博客 本文作者:大家好,我是paper jie,感谢你阅读本文,欢迎一建三连哦。 本文录入于《JAVA数据结构》专栏,本专栏是针对于大学生,编程小白精心打造的。笔者用重金(时间和精…...

Flink RoaringBitmap去重
1、RoaringBitmap的依赖 <!-- 去重大哥--> <dependency><groupId>org.roaringbitmap</groupId><artifactId>RoaringBitmap</artifactId><version>0.9.21</version> </dependency> 2、Demo去重 package com.gwm.driver…...
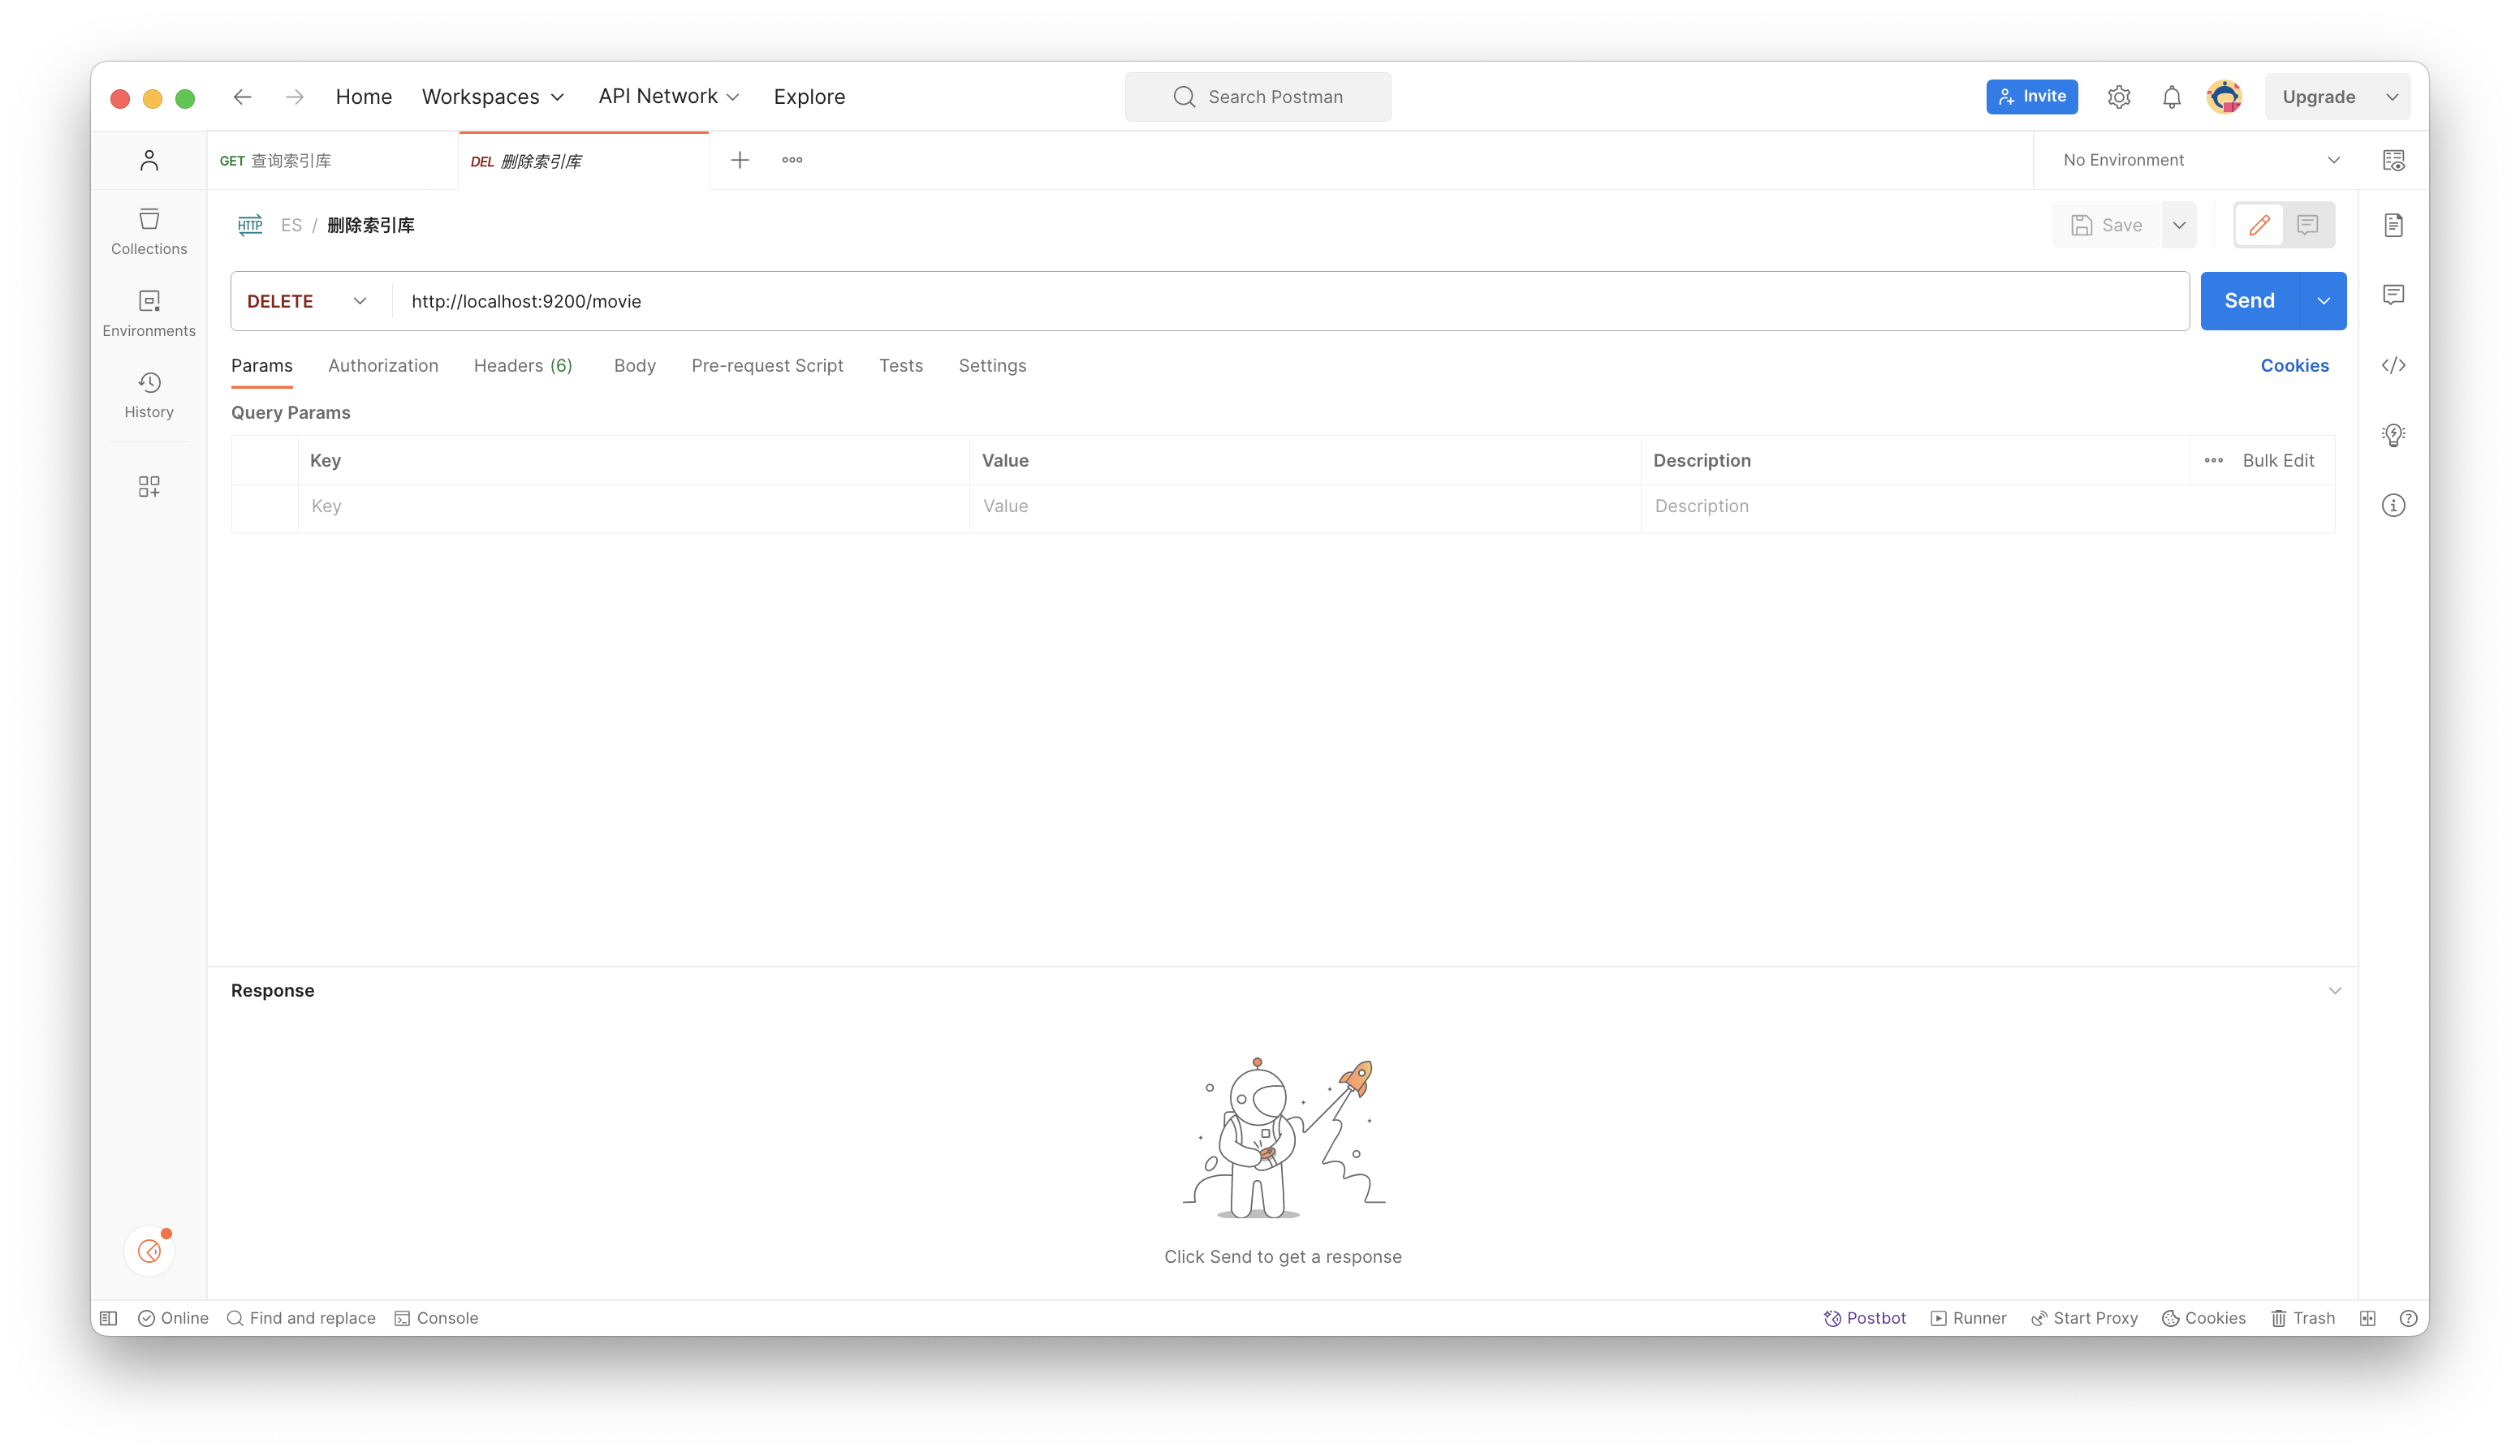
Elasticsearch—(MacOs)
1⃣️环境准备 准备 Java 环境:终端输入 java -version 命令来确认版本是否符合 Elasticsearch 要求下载并解压 Elasticsearch:前往(https://www.elastic.co/downloads/elasticsearch)选择适合你的 Mac 系统的 Elasticsearch 版本…...

插入排序与希尔排序
个人主页:Lei宝啊 愿所有美好如期而遇 前言: 这两个排序在思路上有些相似,所以有人觉得插入排序和希尔排序差别不大,事实上,他们之间的差别不小,插入排序只是希尔排序的最后一步。 目录 前言:…...
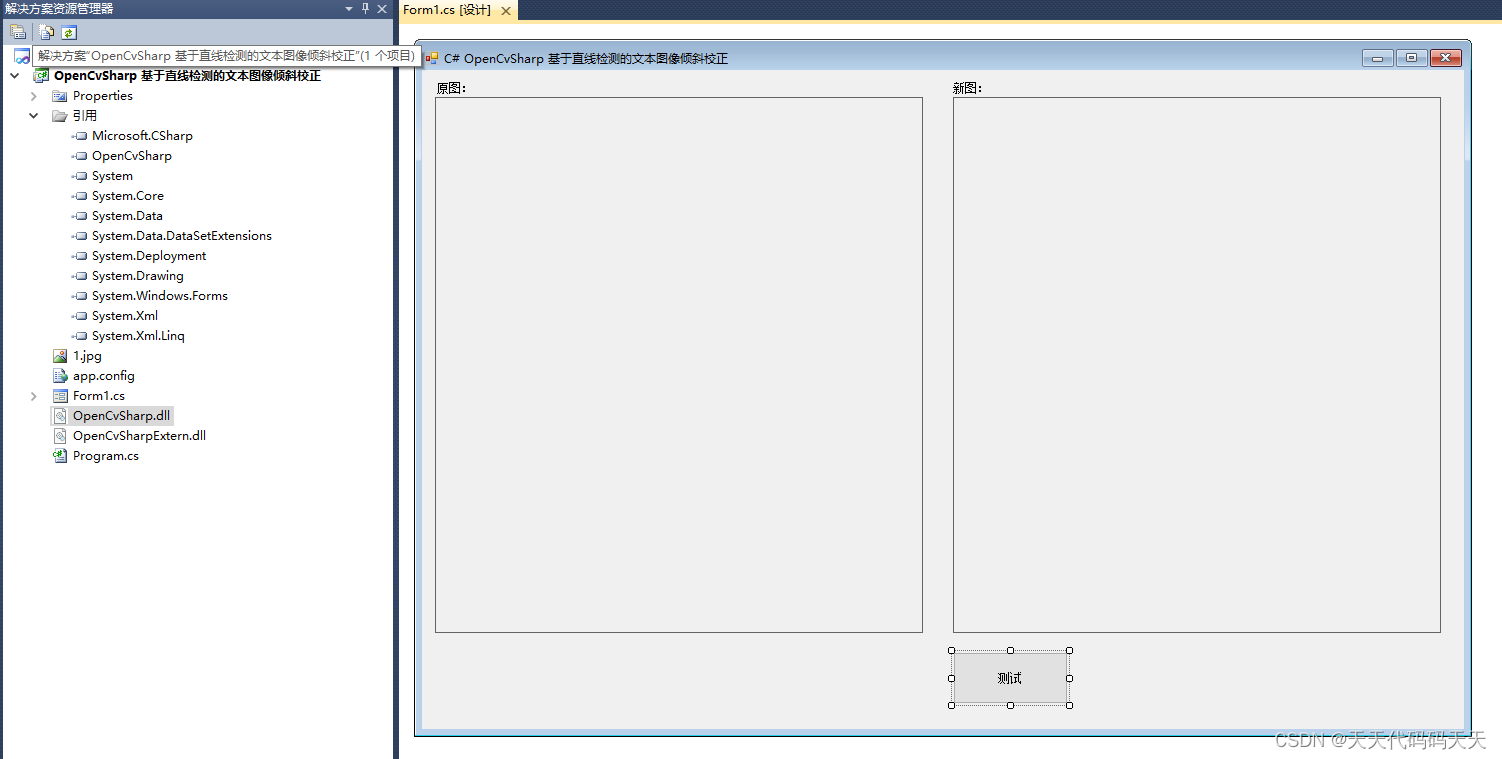
C# OpenCvSharp 基于直线检测的文本图像倾斜校正
效果 项目 代码 using System; using System.Collections.Generic; using System.ComponentModel; using System.Data; using System.Drawing; using System.Linq; using System.Text; using System.Windows.Forms; using OpenCvSharp;namespace OpenCvSharp_基于直线检测的文…...

“智慧时代的引领者:探索人工智能的无限可能性“
目录 一.背景 二.应用 2.1金融领域 2.2医疗领域 2.3教育领域 三.发展 四.总结: 一.背景 人工智能(Artificial Intelligence,简称AI),是指通过计算机程序模拟人类智能的一种技术。它是计算机科学、工程学、语言学、哲学等多…...
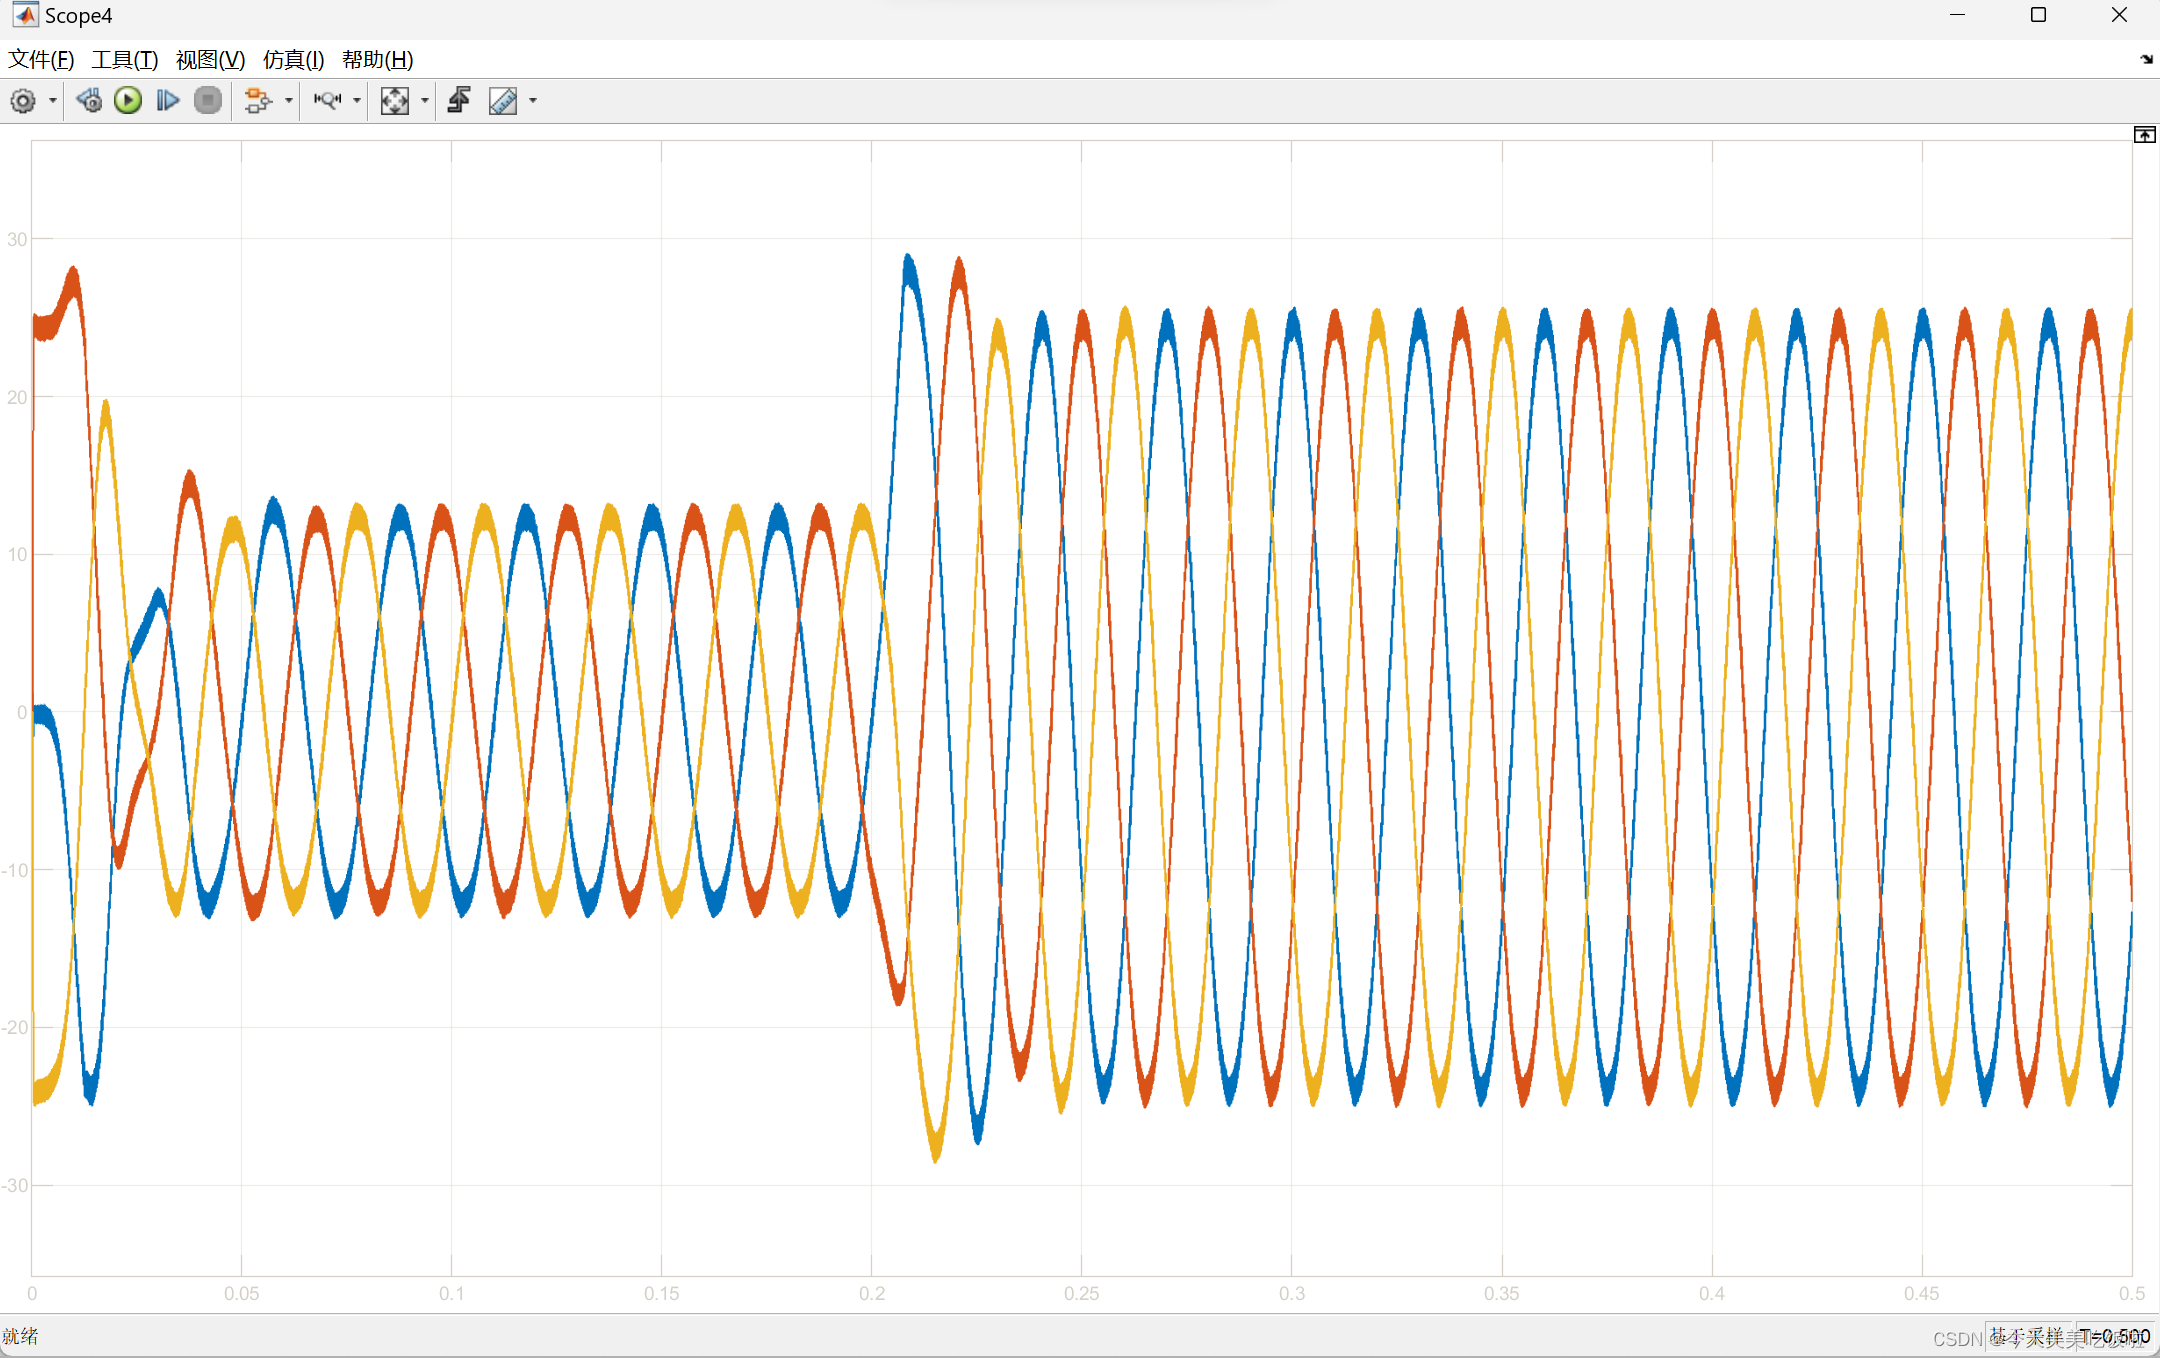
PMSM——转子位置估算基于QPLL
文章目录 前言仿真模型观测器速度观测位置观测转矩波形电流波形 前言 今后是电机控制方向的研究生的啦,期待有同行互相交流。 仿真模型 观测器 速度观测 位置观测 转矩波形 电流波形...

Android Studio之Gradle和Gradle插件的区别
解释的很详细 Android Studio之Gradle和Gradle插件的区别...
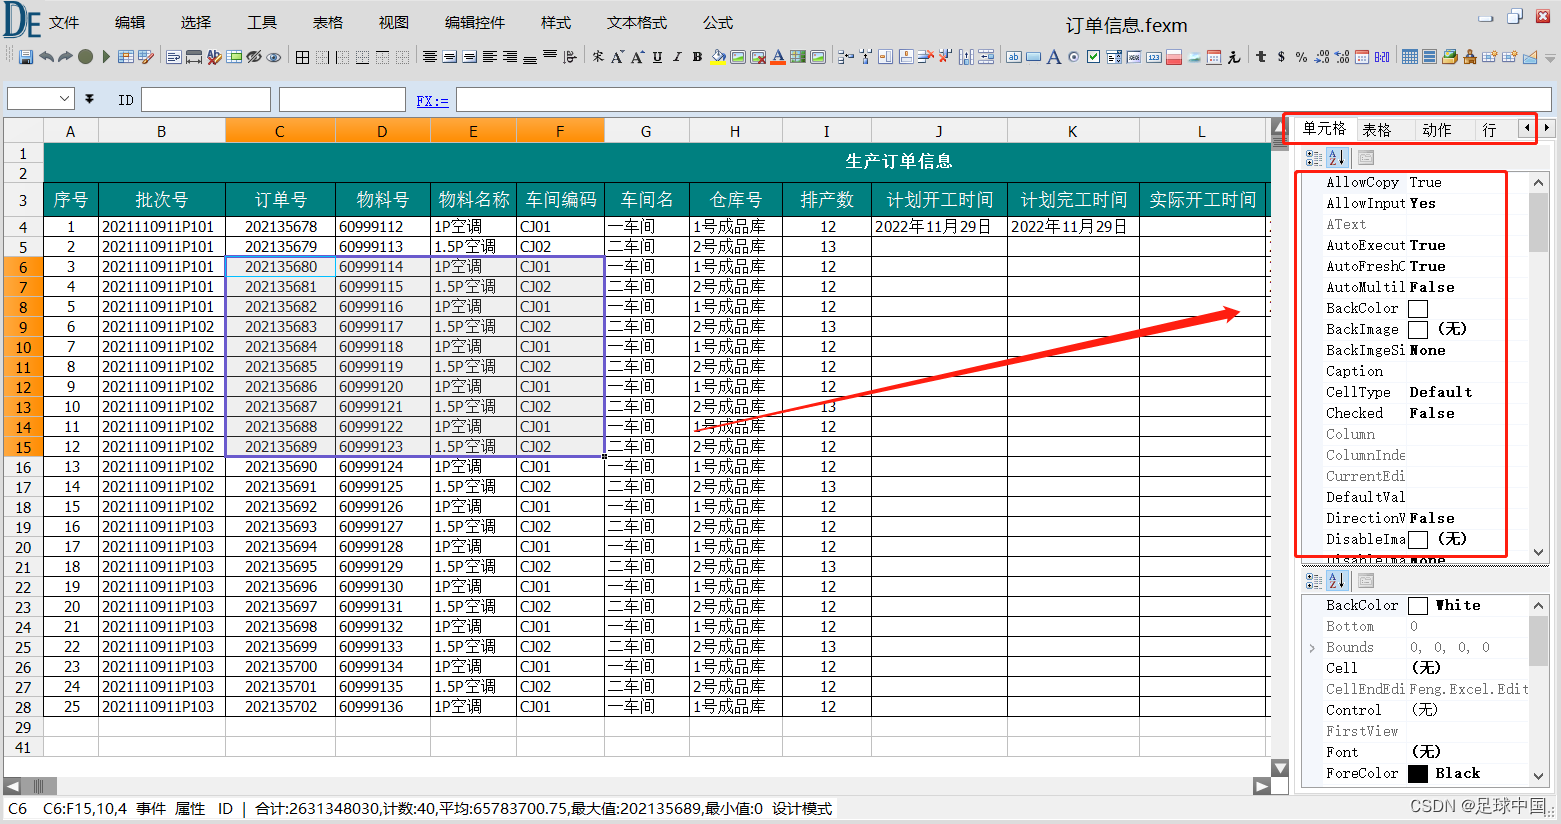
DataExcel控件读取和保存excel xlsx 格式文件
需要引用NPOI库 https://github.com/dotnetcore/NPOI 调用Read 函数将excel读取到dataexcel控件 调用Save 函数将dataexcel控件文件保存为excel文件 using NPOI.HSSF.UserModel; using NPOI.HSSF.Util; using NPOI.SS.UserModel; using NPOI.SS.Util; using System; using …...

【JavaEE】CAS(Compare And Swap)操作
文章目录 什么是 CASCAS 的应用如何使用 CAS 操作实现自旋锁CAS 的 ABA 问题CAS 相关面试题 什么是 CAS CAS(Compare and Swap)是一种原子操作,用于在无锁情况下保证数据一致性的问题。它包含三个操作数——内存位置、预期原值及更新值。在执…...
)
第三章:最新版零基础学习 PYTHON 教程(第三节 - Python 运算符—Python 中的关系运算符)
关系运算符用于比较值。它根据条件返回 True 或 False。这些运算符也称为比较运算符。 操作员描述 句法> 大于:如果左操作数大于右操作数,则为 Truex > y...
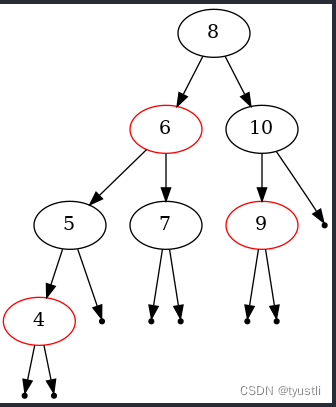
【GDB】使用 GDB 自动画红黑树
阅读本文前需要的基础知识 用 python 扩展 gdb python 绘制 graphviz 使用 GDB 画红黑树 前面几节中介绍了 gdb 的 python 扩展,参考 用 python 扩展 gdb 并且 python 有 graphviz 模块,那么可以用 gdb 调用 python,在 python 中使用 grap…...
使用Vue3+elementPlus的Tree组件实现一个拖拽文件夹管理
文章目录 1、前言2、分析3、实现4、踩坑4.1、拖拽辅助线的坑4.2、数据的坑4.3、限制拖拽4.4、样式调整 1、前言 最近在做一个文件夹管理的功能,要实现一个树状的文件夹面板。里面包含两种元素,文件夹以及文件。交互要求如下: 创建、删除&am…...
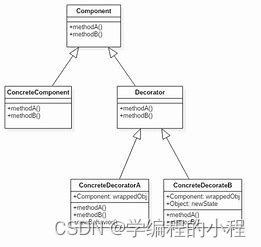
小谈设计模式(7)—装饰模式
小谈设计模式(7)—装饰模式 专栏介绍专栏地址专栏介绍 装饰模式装饰模式角色Component(抽象组件)ConcreteComponent(具体组件)Decorator(抽象装饰器)ConcreteDecorator(具…...
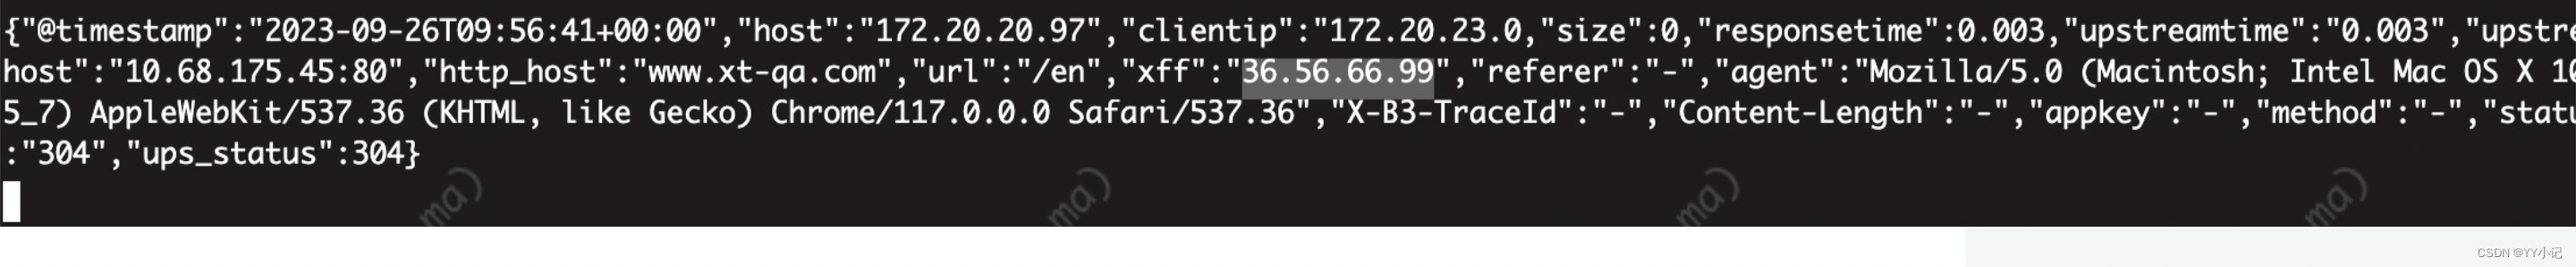
nginx 多层代理 + k8s ingress 后端服务获取客户真实ip 配置
1.nginx http 七层代理 修改命令空间: namespace: nginx-ingress : configmap:nginx-configuration kubectl get cm nginx-configuration -n ingress-nginx -o yaml添加如上配置 compute-full-forwarded-for: “true” forwarded-for-header: X-Forwa…...
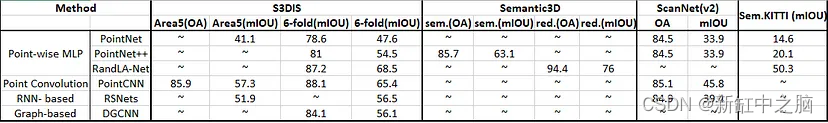
6种最常用的3D点云语义分割AI模型对比
由于增强现实/虚拟现实的发展及其在计算机视觉、自动驾驶和机器人领域的广泛应用,点云学习最近引起了人们的关注。 深度学习已成功用于解决 2D 视觉问题,然而,由于其处理面临独特的挑战,深度学习技术在点云上的使用仍处于起步阶段…...
-获取UI中选择对象的handle值)
UG NX二次开发(C#)-获取UI中选择对象的handle值
提示:文章写完后,目录可以自动生成,如何生成可参考右边的帮助文档 文章目录 1、前言2、设计一个简单的UI界面3、创建工程项目4、测试结果1、前言 我在哔哩哔哩的视频中看到有人问我如何获取UI选择对象的Handle,本来想把Tag、Taggedobject、Handle三者的关系讲一下,然后看…...
win10,WSL的Ubuntu配python3.7手记
1.装linux 先在windows上安装WSL版本的Ubuntu Windows10系统安装Ubuntu子系统_哔哩哔哩_bilibili (WSL2什么的一直没搞清楚) 图形界面会出一些问题,注意勾选ccsm出的界面设置 win10安装Ubuntu16.04子系统,并开启桌面环境_win…...
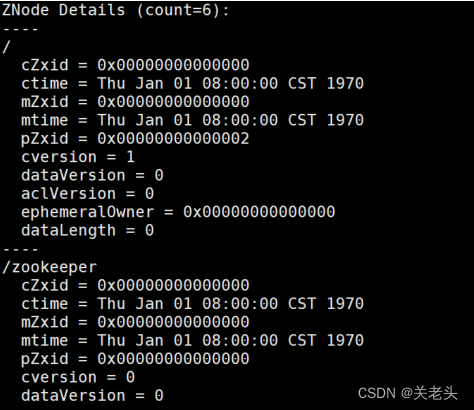
02-Zookeeper实战
上一篇:01-Zookeeper特性与节点数据类型详解 1. zookeeper安装 Step1: 配置JAVA环境,检验环境: java -versionStep2: 下载解压 zookeeper wget https://mirror.bit.edu.cn/apache/zookeeper/zookeeper-3.5.8/apache-zookeepe…...

Linux系统级音频处理:JDSP4Linux架构、DSP效果器与实战调音指南
1. 项目概述:从“听个响”到“听个准”的桌面音频革命如果你是一个对电脑音质有追求的Linux用户,或者是一个音频领域的开发者,那么你很可能经历过这样的困扰:系统自带的音频管理就像个“大锅饭”,所有声音都混在一起&a…...

2025年项目管理工具TOP10:Gitee引领技术驱动新浪潮
1.Gitee(码云):代码与管理的双核引擎 作为中国最大的代码托管平台,Gitee在2025年全面升级项目管理模块,成为技术团队的首选工具。其核心优势在于: 开发与协作无缝衔接:代码提交直接关联任务看板…...

终极指南:如何用3步清理Windows右键菜单,让电脑操作效率翻倍
终极指南:如何用3步清理Windows右键菜单,让电脑操作效率翻倍 【免费下载链接】ContextMenuManager 🖱️ 纯粹的Windows右键菜单管理程序 项目地址: https://gitcode.com/gh_mirrors/co/ContextMenuManager 你是否曾被Windows右键菜单的…...

基于Godot引擎的经典游戏重制:OpenClaw项目架构与实现深度解析
1. 项目概述与核心价值最近在独立游戏开发圈里,一个名为“OpenClaw”的开源项目热度不低。它的全称是“GambitGamesLLC/openclaw-godot”,简单说,这是一个基于Godot引擎,对经典DOS平台动作冒险游戏《The Claw》进行的开源重制版。…...

【统计推断实战】从置信区间到假设检验:如何用数据做出可靠决策
1. 从产品迭代案例看统计推断的价值 最近团队上线了一个新功能,产品经理信心满满地宣称能提升15%的用户留存率。但上线一周后数据波动很大,有人觉得效果明显,有人却说毫无变化。这时候该信谁的?其实这就是统计推断大显身手的时刻—…...

Selenium自动化测试常见的异常处理
在软件开发和测试领域,Selenium作为一种广泛使用的自动化测试工具,扮演着至关重要的角色。随着自动化测试的不断普及,如何在测试过程中有效捕获并处理异常,成为了每个测试工程师必须掌握的技能。本文旨在深入探讨Selenium异常处理的方法,通过丰富的案例和代码,帮助新手朋…...

蓝奏云直链解析:从繁琐到一键的下载革命
蓝奏云直链解析:从繁琐到一键的下载革命 【免费下载链接】LanzouAPI 蓝奏云直链,蓝奏api,蓝奏解析,蓝奏云解析API,蓝奏云带密码解析 项目地址: https://gitcode.com/gh_mirrors/la/LanzouAPI 你是否厌倦了蓝奏云…...

IGH-1.6.2-创龙RK3506-RT-----8-----my_master.c讲解【应用层PDO读写】
本文解决三个应用层问题: 第一,如何从 TxPDO 里读取 3 个 KEY。 第二,如何向 RxPDO 写入 5 个 LED。 第三,如何新增一个 UINT8 数据 PDO。 当前工程里的过程数据指针是 domain_pd,它是应用层读写 PDO 的基础。LED 和 KEY 的字节偏移、bit 位置,都是前面注册 PDO entry …...

macOS Unlocker V3.0:在Windows/Linux电脑上运行macOS虚拟机的终极指南
macOS Unlocker V3.0:在Windows/Linux电脑上运行macOS虚拟机的终极指南 【免费下载链接】unlocker VMware Workstation macOS 项目地址: https://gitcode.com/gh_mirrors/unlo/unlocker macOS Unlocker V3.0是一款革命性的开源工具,专为VMware W…...

oh-my-prompt:打造高效终端提示符的模块化方案与实战配置
1. 项目概述:为什么我们需要一个现代化的终端提示符?如果你和我一样,每天有超过一半的工作时间是在终端(Terminal)里度过的,那么终端提示符(Prompt)就是你最熟悉的“工作台面”。默认…...