ORDER BY limit 10比ORDER BY limit 100更慢
问题分析
pg数据库中执行sql时,ORDER BY limit 10比ORDER BY limit 100更慢
执行计划分析
SELECT*,(select cl.ITEM_DESC from tablelzl2 cl where item_name='name' and cl.ITEM_NO='abcdefg') AS "item"FROMtablelzl1 RIWHERE RI.column1='AAAA'AND RI.column2 = 'applyno20231112'ORDER BYRI.column3 DESC limit 10
Limit (cost=0.43..1522.66 rows=10 width=990)-> Index Scan Backward using idx_tablelzl1_column3 on tablelzl1 ri (cost=0.43..158007.45 rows=1038 width=990)Filter: (((column1)::text = 'AAAA'::text) AND ((column2)::text = 'applyno20231112'::text))SubPlan 1-> Index Scan using uk_tablelzl2_ii on tablelzl2 cl (cost=0.27..5.29 rows=1 width=18)Index Cond: (((item_no)::text = 'manualSign'::text) AND ((item_name)::text = (ri.manual_sign)::text))
主表没有走到column2索引,而是走column3排序字段索引的Index Scan Backward,scan index的cost非常高,而最终的cost比较低,实际执行需要9s
如果把limit 10改成limit 100,执行计划正常:
SELECT*,(select cl.ITEM_DESC from tablelzl2 cl where cl.ITEM_NAME = RI.MANUAL_SIGN AND cl.ITEM_NO='manualSign') AS "manualSign"FROMtablelzl1 RIWHERE RI.column1='AAAA'AND RI.column2 = 'applyno20231112'ORDER BYRI.column3 DESC limit 100
                                                     QUERY PLAN
-----------------------------------------------------------------------------------------------------------------------
Limit  (cost=2632.28..3162.78 rows=100 width=990)->  Result  (cost=2632.28..8138.87 rows=1038 width=990)->  Sort  (cost=2632.28..2634.87 rows=1038 width=474)Sort Key: ri.column3 DESC->  Index Scan using idx_cri_column2 on tablelzl1 ri  (cost=0.43..2592.61 rows=1038 width=474)Index Cond: ((column2)::text = 'applyno20231112'::text)Filter: ((column1)::text = 'AAAA'::text)SubPlan 1->  Index Scan using uk_tablelzl2_ii on tablelzl2 cl  (cost=0.27..5.29 rows=1 width=18)Index Cond: (((item_no)::text = 'manualSign'::text) AND ((item_name)::text = (ri.manual_sign)::text))
(10 rows)
子查询执行计划不变,主表走到column2单列索引,回表后排序再limit,执行非常快。
不仅是limit,如果原sql仅更换column2的值,执行计划也正常。也就是说这个生产的sql只有极个别的column2的值时执行计划是异常的。
执行计划分析:
子查询前后没变可以不用分析,主要是索引选择上的不同。column2是过滤字段,column3是排序字段,两个执行计划分别选择了这2个字段的索引。
- 异常的limit 10执行计划:反向扫描排序字段索引->回表 ->limit。因为不需要额外排序,反向扫描索引时找到limit个数据就可以不用继续扫描了;扫描排序字段索引的预估代价非常高,最上层的limit最终代价预估很低。
- 正常的limit 100执行计划:访问过滤字段索引->回表 ->以排序字段排序 ->limit。因为要排序,需要把符合条件的所有索引条目全部找出来;本身访问过滤字段的索引代价预估低。
所以问题的关键在于部分反向扫描排序索引时,代价预估的过低
真实的执行情况
explain (analyze,buffers) 看下真实的执行情况
---------------------------------------------------------------------------------------------------------------------------------------------------------------------------------------Limit (cost=0.43..1521.93 rows=10 width=990) (actual time=23.311..8122.516 rows=10 loops=1)Buffers: shared hit=861100 read=42985 dirtied=7I/O Timings: read=6741.003-> Index Scan Backward using idx_tablelzl1_column3 on tablelzl1 ri (cost=0.43..157932.45 rows=1038 width=990) (actual time=23.309..8122.505 rows=10 loops=1)Filter: (((column1)::text = 'AAAA'::text) AND ((column2)::text = 'applyno20231112'::text))Rows Removed by Filter: 1521796Buffers: shared hit=861100 read=42985 dirtied=7I/O Timings: read=6741.003SubPlan 1-> Index Scan using uk_tablelzl2_ii on tablelzl2 cl (cost=0.27..5.29 rows=1 width=18) (actual time=0.005..0.005 rows=0 loops=10)Index Cond: (((item_no)::text = 'manualSign'::text) AND ((item_name)::text = (ri.manual_sign)::text))Buffers: shared hit=6Planning:Buffers: shared hit=121 read=28I/O Timings: read=1.476Planning Time: 2.314 msExecution Time: 8122.658 ms
Limit (cost=2632.28..3162.78 rows=100 width=990) (actual time=150.101..150.122 rows=14 loops=1)Buffers: shared hit=700 read=274I/O Timings: read=146.903-> Result (cost=2632.28..8138.87 rows=1038 width=990) (actual time=150.100..150.119 rows=14 loops=1)Buffers: shared hit=700 read=274I/O Timings: read=146.903-> Sort (cost=2632.28..2634.87 rows=1038 width=474) (actual time=150.072..150.073 rows=14 loops=1)Sort Key: ri.column3 DESCSort Method: quicksort Memory: 30kBBuffers: shared hit=694 read=274I/O Timings: read=146.903-> Index Scan using idx_cri_column2 on tablelzl1 ri (cost=0.43..2592.61 rows=1038 width=474) (actual time=0.418..149.973 rows=14 loops=1)Index Cond: ((column2)::text = 'applyno20231112'::text)Filter: ((column1)::text = 'AAAA'::text)Rows Removed by Filter: 1218Buffers: shared hit=691 read=274I/O Timings: read=146.903SubPlan 1-> Index Scan using uk_tablelzl2_ii on tablelzl2 cl (cost=0.27..5.29 rows=1 width=18) (actual time=0.002..0.002 rows=0 loops=14)Index Cond: (((item_no)::text = 'manualSign'::text) AND ((item_name)::text = (ri.manual_sign)::text))Buffers: shared hit=6Planning Time: 0.334 msExecution Time: 150.257 ms
limit 10的执行计划,执行8s,内存读shared hit=861100 磁盘读read=42985 ,丢弃了1521796行
limit 100的执行计划执行0.1s shared hit=694 read=274,丢弃了1218行
limit 10的执行计划明显是不正常,读了太多的数据才找到符合条件的行,这是sql执行过慢的原因
统计信息分析
本身预估的代价不高,但是实际上需要扫描非常多的索引行,首先想到是否是统计信息是否准确
表的统计信息:
[postgres@cnsz381785:7169/(rasesql)phmamp][10-30.15:01:26]M=#  select relpages,reltuples::bigint from pg_class where relname='tablelzl1';relpages | reltuples
----------+-----------91172 |   2280874 --count出来差不多
字段的统计信息:
[phmampopr@cnsz381785:7169/(rasesql)phmamp][10-27.17:08:48]M=>  select * from pg_stats where tablename='tablelzl1' and attname='column2';
-[ RECORD 1 ]----------+-----------------------------------------------------------------------------------------------------------------------------------------------------------------------------------------
schemaname             | public
tablename              | tablelzl1
attname                | column2
inherited              | f
null_frac              | 0
avg_width              | 18
n_distinct             | -0.11990886
most_common_vals       | {applyno20231112,DY20190723006650,DY20200102012899,DY20180827000557,DY20190524001304,DY20190529001885,DY20190728002359}
most_common_freqs      | {0.0005,0.00026666667,0.00023333334,0.0002,0.0002,0.0002,0.0002}
histogram_bounds       | {CULZF0000121605605,DSNEW0000126854232,DSNEW0000137652871,DY20160516001057,DY20161104005509,DY20170306002677,DY20170703010428,DY20170928013517,DY20180410007383,DY20180615002936,DY20180
correlation            | 0.3131596
most_common_elems      | [null]
most_common_elem_freqs | [null]
elem_count_histogram   | [null]
这个column2 applyno20231112刚好就是排第一的most_common_vals,出现预估概率是0.0005,用预估的行2280874*0.0005=1140,与实际的行数1232差不多
[postgres@cnsz381785:7169/(rasesql)phmamp][10-30.15:05:28]M=# select count(*) from tablelzl1 where column2 = 'applyno20231112';count
-------1232
说明统计信息是准确的,实际上运行analze收集统计信息也不会解决这个问题
数据分布不均的计算
用当前统计信息计算出来的符合条件的行有1140个,那么预计从排序字段的索引上找到第一条数据平均要扫描2280874/1140=2000个索引行。如果找10条便是20000个索引行,100条便是200000个索引行。
把sort禁用,让limit 100语句强行走排序字段的索引
M=# set enable_sort=off;
SET
--limit 100的执行计划Limit (cost=0.43..15222.69 rows=100 width=990)-> Index Scan Backward using idx_tablelzl1_column3 on tablelzl1 ri (cost=0.43..158007.45 rows=1038 width=990)Filter: (((column1)::text = 'AAAA'::text) AND ((column2)::text = 'applyno20231112'::text))SubPlan 1-> Index Scan using uk_tablelzl2_ii on tablelzl2 cl (cost=0.27..5.29 rows=1 width=18)Index Cond: (((item_no)::text = 'manualSign'::text) AND ((item_name)::text = (ri.manual_sign)::text))
limit 10改成limit 100后的执行计划,代价从1522.66升到了15222.69,基本上只是简单的*10。limit 100的代价15222.69大于了走过滤字段索引的执行计划cost 3162.78,所以limit 10和limit 100执行计划不同,选择了不同的索引。
以上的估算都是以数据零散的放在排序列的索引上 为前提的,实际情况有可能数据在最后一条(反向扫描索引),很快就能找到;也有可能数据全部在索引叶节点前面的几个pages,此时几乎是扫描全部索引并回表,代价便非常高。
那么两个字段的关联度,数据在索引上的分布情况,决定了使用排序字段的索引 的效率。
再看下真实的执行扫描了多少行数据:
-> Index Scan Backward using idx_tablelzl1_column3 on tablelzl1 ri (cost=0.43..157932.45 rows=1038 width=990) (actual time=23.309..8122.505 rows=10 loops=1)Filter: (((column1)::text = 'AAAA'::text) AND ((column2)::text = 'applyno20231112'::text))Rows Removed by Filter: 1521796
实际上差不多扫描了1521796行才找到这10条数据,本来预估的是20000,整整相差了76倍!
触发场景
- 必须有where +order by+limit语句
- 排序字段和过滤字段都必须有索引
- 一般limit不会特别大
- 数据分布不均
解决办法
改写sql语句:添加表达式,不让order by字段走索引即可
SELECT*,(select cl.ITEM_DESC from tablelzl2 cl where cl.ITEM_NAME = RI.MANUAL_SIGN AND cl.ITEM_NO='manualSign') AS "manualSign"FROMtablelzl1 RIWHERE RI.column1='AAAA'AND RI.column2 = 'applyno20231112'ORDER BYRI.column3 +'0' DESC limit 10
oracle是怎么做的
执行计划cost的预估差异
从上面的执行计划分析,pg的执行计划cost看起来不太适应,上层的cost小于内层的cost,不像oracle这样阶梯式的累加计算
这里做一个oracle和pg的实验,一张表仅存储colname='x’的数据,看下pg和oracle的对cost计算的区别:
[postgres@cnsz381785:7169/(rasesql)dbmgr][10-31.14:32:19]M=# explain select * from testlzl where col1='x' limit 1;QUERY PLAN
-----------------------------------------------------------------------Limit  (cost=0.00..0.02 rows=1 width=2)->  Seq Scan on testlzl  (cost=0.00..17747.20 rows=1048576 width=2)Filter: ((col1)::text = 'x'::text)
[postgres@cnsz381785:7169/(rasesql)dbmgr][10-31.14:32:30]M=# explain select * from testlzl where col1='xx' limit 1;QUERY PLAN
-----------------------------------------------------------------Limit  (cost=0.00..17747.20 rows=1 width=2)->  Seq Scan on testlzl  (cost=0.00..17747.20 rows=1 width=2)Filter: ((col1)::text = 'xx'::text)
col1='x’立马就能找到,limit的算法没有推入到全表扫描的成本中,total cost是17747.20,跟扫描完表的成本是一样的。limit的成本cost虽然没有下推到内层的cost做计算,但是rows计算了!
来看下oracle是执行计划是怎么做的:
SYS@t8icss1> select * from dbmgr.testlzl where a='x' and rownum<=1;1 row selected.Execution Plan
----------------------------------------------------------
Plan hash value: 2045386539------------------------------------------------------------------------------
| Id  | Operation          | Name    | Rows  | Bytes | Cost (%CPU)| Time     |
------------------------------------------------------------------------------
|   0 | SELECT STATEMENT   |         |     1 |     2 |     2   (0)| 00:00:01 |
|*  1 |  COUNT STOPKEY     |         |       |       |            |          |
|*  2 |   TABLE ACCESS FULL| TESTLZL |     1 |     2 |     2   (0)| 00:00:01 |
------------------------------------------------------------------------------Predicate Information (identified by operation id):
---------------------------------------------------1 - filter(ROWNUM<=1)2 - filter("A"='x')
SYS@t8icss1> select * from dbmgr.testlzl where a='xx' and rownum<=1;no rows selectedExecution Plan
----------------------------------------------------------
Plan hash value: 2045386539------------------------------------------------------------------------------
| Id  | Operation          | Name    | Rows  | Bytes | Cost (%CPU)| Time     |
------------------------------------------------------------------------------
|   0 | SELECT STATEMENT   |         |     1 |     2 |   302   (2)| 00:00:01 |
|*  1 |  COUNT STOPKEY     |         |       |       |            |          |
|*  2 |   TABLE ACCESS FULL| TESTLZL |     1 |     2 |   302   (2)| 00:00:01 |
------------------------------------------------------------------------------Predicate Information (identified by operation id):
---------------------------------------------------1 - filter(ROWNUM<=1)2 - filter("A"='xx')
对于oracle的计划,a='x’的数据可以立即找到的话,STOPKEY的代价算进了内层的cost中,cost只有2,实际上扫描全表的代价比较高302。
这一点是oracle与pg关于cost计算的一个重要区别:
- oracle的外层cost必然>=内层cost;pg则不一定
- oracle的内层cost计算包含了外层的算子(比如stopkey);但是pg不会包含,直接给子路径的全部成本
oracle的数据分布不均问题
知道了数据分布不均的原理,造一条数据把他放在排序索引的开头即可
create table tlzl(a char(100) not null,b char(100) not null);
--插入批量数据
begin
for i in 1..100000 loop
insert into tlzl values('test','test');
end loop;
end;
/
--插入特殊数据
insert into tlzl values('aaaa','aaaa');
insert into tlzl values('zzzz','zzzz');
--创建索引
create index idx_a on tlzl(a);
create index idx_b on tlzl(b);
--收集统计信息
EXEC DBMS_STATS.GATHER_TABLE_STATS(OWNNAME=>'SYS',TABNAME=>'TLZL',estimate_percent => 10, degree=>1,METHOD_OPT=>'FOR ALL COLUMNS SIZE AUTO',cascade=>true);
select * from (select /*+ index(tlzl idx_a)*/* from tlzl where b='aaaa' order by a) where rownum<=1;
select * from (select /*+ index(tlzl idx_a)*/* from tlzl where b='zzzz' order by a) where rownum<=1;
SYS@t8icss1> select * from (select /*+ index(tlzl idx_a)*/* from tlzl where b='aaaa' order by a) where rownum<=1; Execution Plan
----------------------------------------------------------
Plan hash value: 3674066029---------------------------------------------------------------------------------------
| Id  | Operation                     | Name  | Rows  | Bytes | Cost (%CPU)| Time     |
---------------------------------------------------------------------------------------
|   0 | SELECT STATEMENT              |       |     1 |   204 |  2210   (1)| 00:00:01 |
|*  1 |  COUNT STOPKEY                |       |       |       |            |          |
|   2 |   VIEW                        |       |     1 |   204 |  2210   (1)| 00:00:01 |
|*  3 |    TABLE ACCESS BY INDEX ROWID| TLZL  |     1 |   202 |  2210   (1)| 00:00:01 |
|   4 |     INDEX FULL SCAN           | IDX_A | 98830 |       |   779   (1)| 00:00:01 |
---------------------------------------------------------------------------------------
SYS@t8icss1> select * from (select /*+ index(tlzl idx_a)*/* from tlzl where b='zzzz' order by a) where rownum<=1; Execution Plan
----------------------------------------------------------
Plan hash value: 3674066029---------------------------------------------------------------------------------------
| Id  | Operation                     | Name  | Rows  | Bytes | Cost (%CPU)| Time     |
---------------------------------------------------------------------------------------
|   0 | SELECT STATEMENT              |       |     1 |   204 |  2210   (1)| 00:00:01 |
|*  1 |  COUNT STOPKEY                |       |       |       |            |          |
|   2 |   VIEW                        |       |     1 |   204 |  2210   (1)| 00:00:01 |
|*  3 |    TABLE ACCESS BY INDEX ROWID| TLZL  |     1 |   202 |  2210   (1)| 00:00:01 |
|   4 |     INDEX FULL SCAN           | IDX_A | 98830 |       |   779   (1)| 00:00:01 |
---------------------------------------------------------------------------------------
oracle的优化器也是一样的,优化器并不知道数据到底放在索引的哪个地方,没有办法,放在索引的第一条和最后一条都是估算的同一代价。
不过oracle有很多方法可以解决这个问题,如extended statistic、Automatic Column Group Detection、固化执行计划等。
参考
http://www.postgres.cn/v2/news/viewone/1/717
https://oracle-base.com/articles/12c/automatic-column-group-detection-extended-statistics-12cr1
相关文章:

ORDER BY limit 10比ORDER BY limit 100更慢
问题分析 pg数据库中执行sql时,ORDER BY limit 10比ORDER BY limit 100更慢 执行计划分析 SELECT*,(select cl.ITEM_DESC from tablelzl2 cl where item_namename and cl.ITEM_NOabcdefg) AS "item"FROMtablelzl1 RIWHERE RI.column1AAAAAND RI.colum…...

aws亚马逊云:置以使用 Amazon EC2!!!
完成本部分中的任务,以便为首次启动 Amazon EC2 实例进行设置: 注册一个 AWS 账户 创建管理用户 创建密钥对 创建安全组 完成后,您将准备好学习 Amazon EC2 入门教程。 注册一个 AWS 账户 如果您还没有 AWS 账户,请完成以下…...
、 torch.add()、torch.subtract()、torch.subtract()和torch.div()函数详解和示例)
torch.cat()、 torch.add()、torch.subtract()、torch.subtract()和torch.div()函数详解和示例
本文通过原理和示例对torch.cat()、 torch.add()、torch.subtract()、torch.subtract()、torch.div()和torch.linalg.solve() 函数进行详解,以帮助大家理解和使用。 目录 torch.cat()函数torch.add()函数torch.subtract()函数逐元素减法示例矩阵减法示例 torch.mul…...
jetsonTX2 nx配置tensorRT加速yolov5推理
环境说明 Ubuntu 18conda环境python3.9cuda10.2,硬件平台是Jetson tx2 nx 前提你已经能运行YOLOV5代码后,再配置tensorRT进行加速。 目前只试了图片检测和C打开USB摄像头进行视频检测,希望是使用python配合D435i深度相机来实现检测ÿ…...

<<C++primer>>函数模板与类模板相关知识点整理
1.类型萃取的原理 类型萃取利用模板形参的推演方式使得类型去掉了引用性质: //消除引用,保留原始特性 //类型萃取 /// </summary> /// <param name"it"></param> template<class _Ty> struct my_remove_reference …...

一小时学习 Git 笔记
一小时Git教程传送门 git 基础 1. 起始配置 # 配置自己的姓名 git config --global user.name "Your Name" # 配置自己的邮箱 git config --global user.email "emailexample.com" 注意1.命令之间有空格2.上面的两个命令只需要运行一次即可, 如果输入错…...

简单漂亮的登录页面
效果图 说明 开发环境:vue3,sass 代码 <template><div class"container"><div class"card-container"><div class"card-left"><span><h1>Dashboard</h1><p>Lorem ip…...
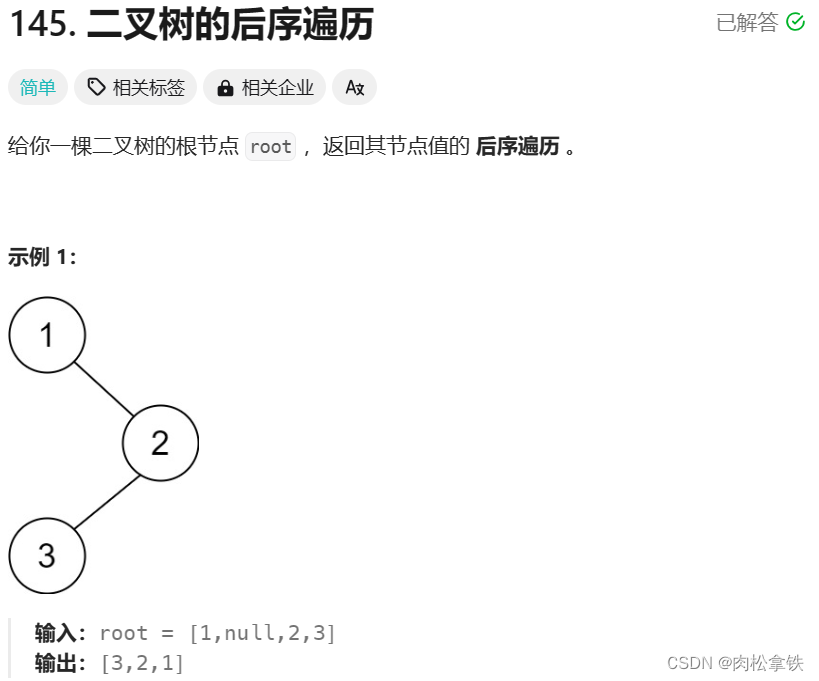
Leetcode-145 二叉树的后序遍历
递归 /*** Definition for a binary tree node.* public class TreeNode {* int val;* TreeNode left;* TreeNode right;* TreeNode() {}* TreeNode(int val) { this.val val; }* TreeNode(int val, TreeNode left, TreeNode right) {* this…...

详解JDBC
JDBC简介 概念: jdbc就是使用java语言操作关系型数据库的一套API 全称 : (Java DataBase Connectivity) Java数据库连接 本质: 官方(sun公司)定义的一套操作所有关系型数据库的规则,即接口; 各个数据库厂商实现这套接口,提供数据库驱动j…...

江门車馬炮汽车金融中心 11月11日开张
江门车马炮汽车金融中心于11月11日正式开张,这是江门市汽车金融服务平台,旨在为广大车主提供更加便捷、高效的汽车金融服务。 江门市作为广东省的一个经济发达城市,汽车保有量持续增长,但车主在购车、用车、养车等方面仍存在诸多不…...

Arthas设置参数以Json形式输出
进入arthas控制台后,先输入options json-format true命令,即可让结果、参数以json的方式输出,比如之后用watch命令查看参数,输出的形式就会是json了,这样的格式,就比较好复制出参数,在本地复现试…...
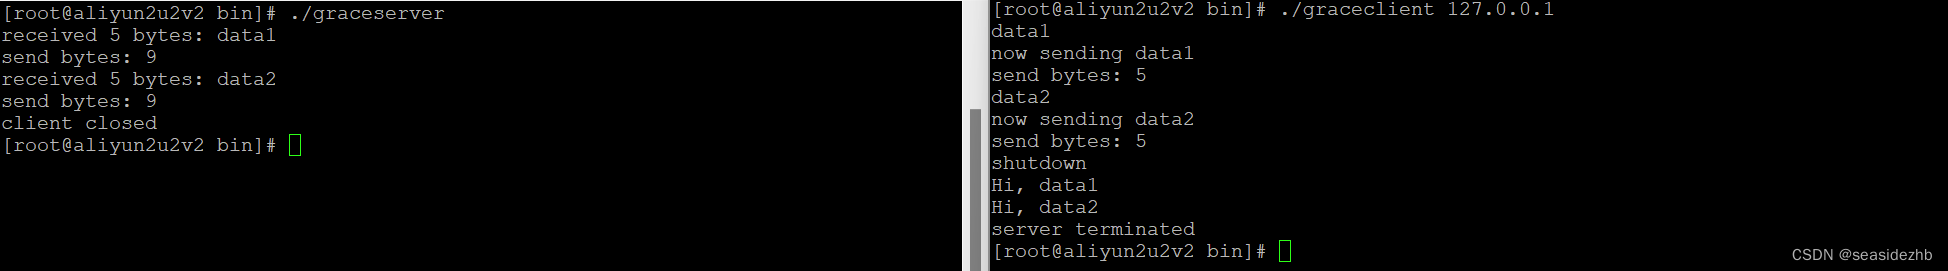
优雅关闭TCP的函数shutdown效果展示
《TCP关闭的两种方法概述》里边理论基础,下边是列出代码,并且进行实验。 服务端代码graceserver.c的内容如下: #include "lib/common.h"static int count;static void sig_int(int signo) {printf("\nreceived %d datagrams\…...

商品管理幻灯图片更换实现
<?xml version"1.0" encoding"UTF-8" ?> <!DOCTYPE mapperPUBLIC "-//mybatis.org//DTD Mapper 3.0//EN""http://mybatis.org/dtd/mybatis-3-mapper.dtd"> <mapper namespace"com.java1234.mapper.ProductMappe…...

tomcat下载与使用教程
1. tomcat下载 官网:https://tomcat.apache.org/ 镜像地址:https://mirrors.huaweicloud.com/apache/tomcat/ 1、选择一个版本下载,官网下载速度缓慢,推荐镜像 2、对压缩包进行解压,无需进行安装,解压放…...
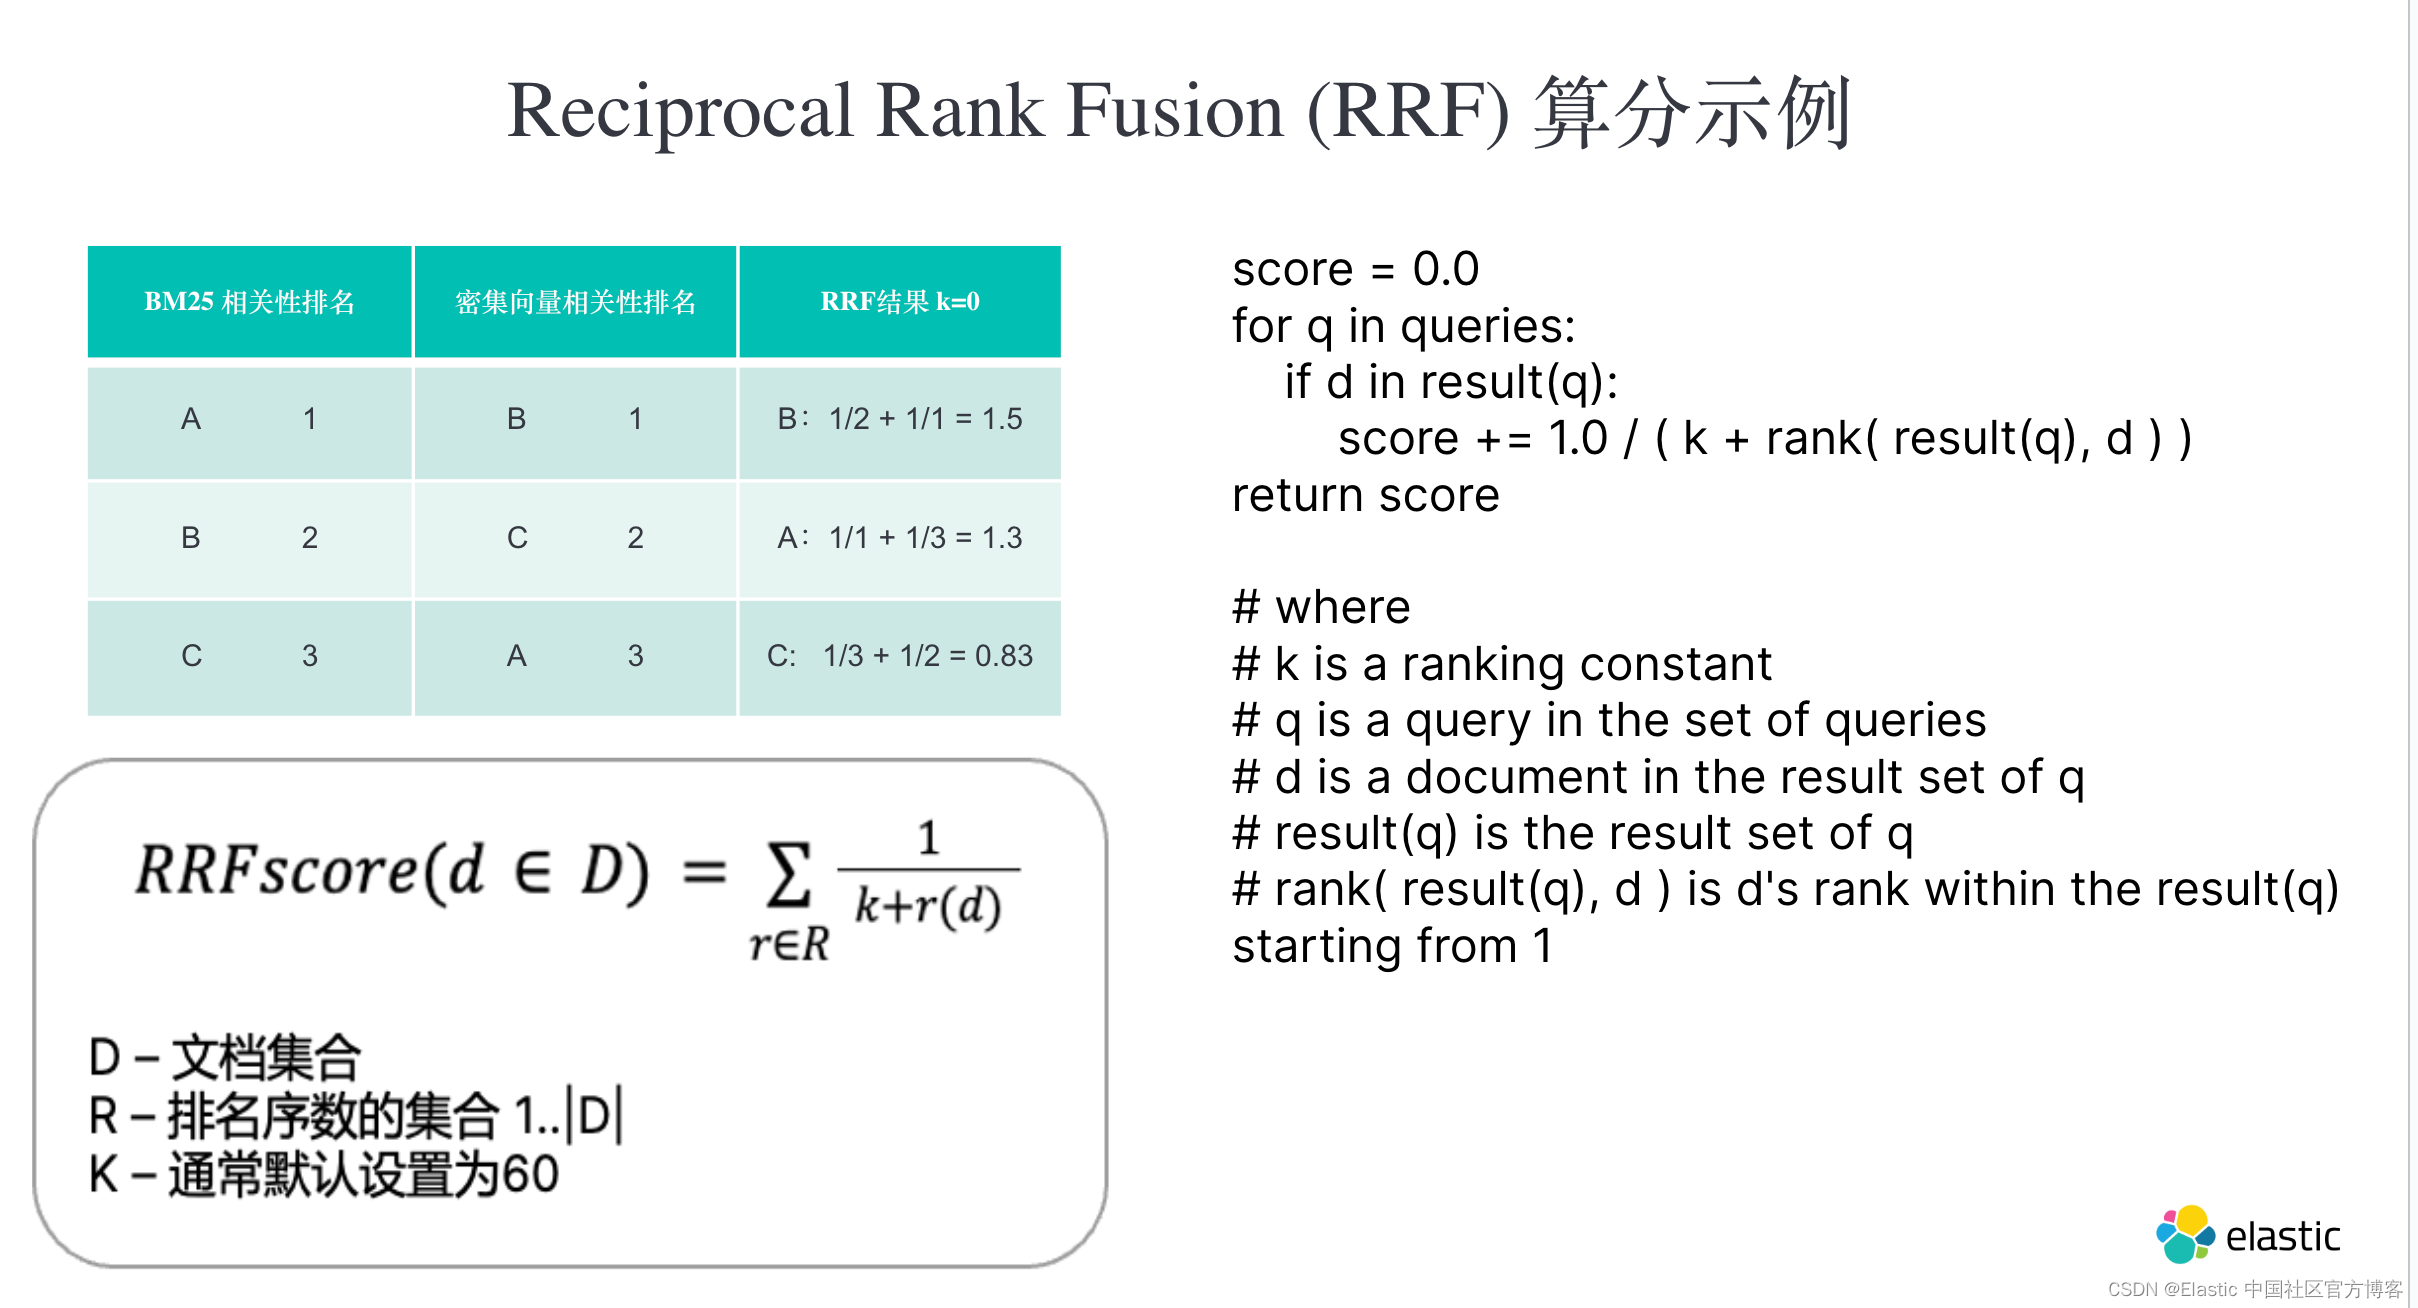
通过 Elasticsearch 和 Go 使用混合搜索进行地鼠狩猎
作者:CARLY RICHMOND,LAURENT SAINT-FLIX 就像动物和编程语言一样,搜索也经历了不同实践的演变,很难在其中做出选择。 在本系列的最后一篇博客中,Carly Richmond 和 Laurent Saint-Flix 将关键字搜索和向量搜索结合起…...
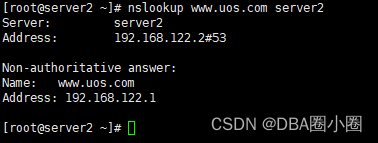
【LIUNX】配置缓存DNS服务
配置缓存DNS服务 A.安装bind bind-utils1.尝试修改named.conf配置文件2.测试nslookup B.修改named.conf配置文件1.配置文件2.再次测试 缓存DNS服务器:只提供域名解析结果的缓存功能,目的在于提高数据查询速度和效率,但是没有自己控制的区域地…...
)
Arduino驱动A01NYUB防水超声波传感器(超声波传感器)
目录 1、传感器特性 2、控制器和传感器连线图 3、通信协议 4、驱动程序 A01NYUB超声波测距传感器是一款通过发射和接收机械波来感应物体距离的电子传感器。该款产品具有监测距离远、范围广、防水等优点,且具有一定的穿透能力(烟雾、粉尘等)。该产品带有可拆卸式喇叭口,安…...
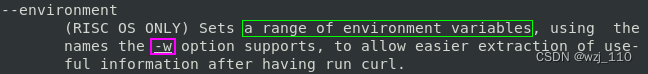
curl(八)时间和环境变量以及配置
一 时间 ① --connect-timeout 连接超时时间 ② -m | --max-time 数据最大传输时间 -m: 限制curl 完成时间(overall time limit)-m,--max-time <seconds> 整个交互完成的超时时间场景: 通过设置-m参数,可以避免请求时间过长而导致的超时错误…...
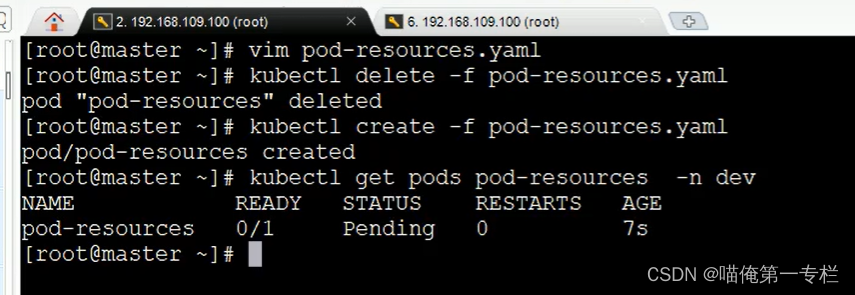
K8S知识点(十)
(1)Pod详解-启动命令 创建Pod,里面的两个容器都正常运行 (2)Pod详解-环境变量 (3)Pod详解-端口设置 (4)Pod详解-资源配额 修改:memory 不满足条件是不能正常…...
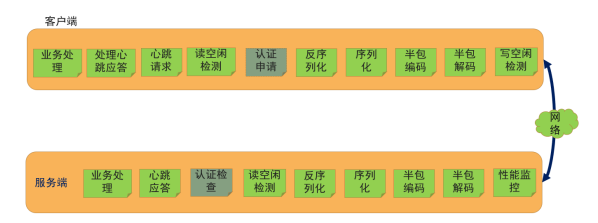
Netty实现通信框架
一、LengthFieldBasedFrameDecoder的参数解释 1、LengthFieldBasedFrameDecoder的构造方法参数 看下最多参数的构造方法 /*** Creates a new instance.** param byteOrder* the {link ByteOrder} of the length field* param maxFrameLength* the maximum len…...

Godot PCK解包原理与专业逆向实践指南
1. 这不是“解压软件”,而是Godot游戏逆向工程的第一把手术刀你刚下载了一款用Godot引擎开发的独立游戏,想研究它的UI动效逻辑,或者复刻一段粒子特效,又或者只是单纯好奇——那个让你反复通关三次的像素风过场动画,图层…...

除了ulimit -c unlimited:深入理解Linux core dump机制与高级配置指南
深入Linux核心转储:从基础配置到生产环境实战指南当服务器上的关键应用突然崩溃时,系统管理员最需要的就是一份完整的"事故现场记录"。Linux的core dump机制正是为此而生,它能保存程序崩溃时的内存状态、寄存器值和调用堆栈&#x…...

一次搞懂内存取证:用Volatility3和Cobalt Strike分析工具复现VNCTF‘来一把紧张刺激的CS’
实战内存取证:从Volatility3到Cobalt Strike信标分析全解析 在网络安全事件响应中,内存取证往往是发现高级威胁的最后一道防线。当攻击者使用文件无落地的技术时,传统的磁盘取证可能一无所获,而内存中却保留着攻击行为的完整痕迹。…...
)
ROS Noetic实战:从bag包里‘抠’出雷达点云和IMU数据的保姆级教程(Ubuntu 20.04)
ROS Noetic实战:从bag包里提取雷达点云和IMU数据的完整指南(Ubuntu 20.04)在机器人开发中,ROS bag文件就像是一个装满珍贵数据的宝箱,而雷达点云和IMU数据则是其中最闪亮的宝石。作为一名长期与ROS打交道的开发者&…...

别被忽悠了!2026亲测靠谱的AI论文网站|避坑精选版
2026 年学术写作工具已高度分化,千笔AI与ThouPen为全流程首选,豆包、DeepSeek 为专项强手;避坑关键:拒绝假文献、严控 AIGC 率、优先国内适配、免费试用先行。 一、TOP3 全流程首选(亲测不踩雷) 1. 千笔AI&…...

网络配置工具类详解
CNet 网络配置工具类详解平台:仅支持 Linux,大量使用 ioctl 系统调用一、概述 CNet 是一个 纯静态方法的网络配置工具类,封装了 Linux 下常用的网络操作:功能类别涵盖内容IP 地址读取/设置本机 IP、子网掩码网关读取/添加/删除/设…...
)
告别混乱绑定!在UE5 GAS中优雅管理技能输入(基于GameplayTag)
告别混乱绑定!在UE5 GAS中优雅管理技能输入(基于GameplayTag)当你的UE5 RPG项目发展到中期,技能数量从十几个膨胀到几十个时,最痛苦的莫过于发现InputAction绑定已经变成一团乱麻。每次新增技能都要修改输入绑定逻辑&a…...

<背包问题>
背包问题是一类组合优化问题,其基本形式是给定一组物品,每个物品都有一个重量和一个价值,以及一个有限的背包容量,目标是在不超过背包容量的前提下,选择物品使得背包中的物品价值最大化。动态规划是解决背包问题的常用…...

基于Arduino与433MHz射频的智能灯光定时系统设计与实现
1. 项目概述:告别机械定时器,打造智能灯光管家家里前后院的照明,还有出门度假时屋内的几盏灯,过去一直靠四个老旧的机械定时器来管理。说实话,这玩意儿用起来真是费劲。它的核心问题在于“死板”——你设定好晚上7点开…...

在数据预处理与分析流水线中集成大模型API进行智能标注与摘要
🚀 告别海外账号与网络限制!稳定直连全球优质大模型,限时半价接入中。 👉 点击领取海量免费额度 在数据预处理与分析流水线中集成大模型API进行智能标注与摘要 对于数据工程师而言,处理海量非结构化文本数据是一项常见…...