【MATLAB】全网入门快、免费获取、持续更新的科研绘图教程系列2
14 【MATLAB】科研绘图第十四期表示散点分布的双柱状双Y轴统计图
%% 表示散点分布的双柱状双Y轴统计图%% Made by Lwcah (公众号:Lwcah)
%% 公众号:Lwcah
%% 知乎、B站、小红书、抖音同名账号:Lwcah,感谢关注~
%% 更多MATLAB+SCI绘图教程敬请观看~%% 清除变量
close all;clear all;clc;%% 1行1列
%% 一幅图的时候figureWidth = 8.5;figureHeight = 8;调整这两个参数就可以
%定义整幅图出现的在电脑屏幕上的位置以及长和宽
%这里有必要解释一下为什么figureWidth要设置为8.5;
%因详细解释需要很长的篇幅,请转公众号观看该天的文章。
figureHandle = figure;
figureUnits = 'centimeters';
figureWidth = 8.5;
figureHeight = 6;
set(gcf, 'Units', figureUnits, 'Position', [28 20 figureWidth figureHeight]);
% 注:28代表出图时图的左下角相对于整个电脑屏幕的左下角向左偏移28个单位,向上偏移20个单位。
% 可自行调节两个数字让图出在自己屏幕的某个位置%% 定义字体和字号大小
%% 通常的SCI一般Arial字体和10字号通用
fontnamed='华文中宋';%字号名字Arial
ssize=10;%字号大小
%% 如果是中文论文可以相应的更改字号名字如下
% '华文中宋' '华文仿宋' '华文宋体' '华文新魏' '华文楷体'
% '华文琥珀' '华文细黑' '华文行楷' '华文隶书' '宋体'
% '方正姚体' '微软雅黑' '方正舒体' '新宋体'
% '幼圆' '楷体' '等线' '隶书' '黑体'%% 给定绘图颜色
C1 = chinesecolors(343);%香水玫瑰
C2 = chinesecolors(150);%靛青
C3 = chinesecolors(523);%玫瑰灰
% C4 = chinesecolors(17);%鹅冠红%% 数据
x = 1:30;
y = x+rand(1,30)*0.01;%% 表示散点分布的双柱状统计图绘图
[n1,ctr1] = hist(x,20);
[n2,ctr2] = hist(y,20);subplot(2,2,2);yyaxis right
bar(ctr1,-n1,1);h1 = gca;hold on;box on;grid on;
ylabel('Numbers','fontsize',ssize,'FontName',fontnamed);
alpha(0.1);%调整柱状图颜色的透明度yyaxis left
plot(x,y,'.');axis on; h2 = gca; hold on;box on;grid on;
xlabel('X-axis','fontsize',ssize,'FontName',fontnamed);
ylabel('Y-axis','fontsize',ssize,'FontName',fontnamed);subplot(2,2,1);
barh(ctr2,-n2,1);axis off; h3 = gca;h1.Position = [0.35 0.35 0.50 0.55];
% h2.Position = [0.05 0.35 0.25 0.55];
h3.Position = [0.08 0.35 0.15 0.55];%% 修图的标准格式代码
% text(0.5,0.9,'(a) XXX','fontsize',ssize,'FontName',fontnamed);%,'horiz','center'
% title('1000');
% xlabel('X-axis','fontsize',ssize,'FontName',fontnamed);
% ylabel('Y-axis','fontsize',ssize,'FontName',fontnamed);
% axis([0 10 0 7]);%XY轴的范围
% xticks([1 2 3 4 5 6 7 8 9 10]);%画格网的时候的小刻度
% xticklabels({'1','2','3','4','5','6','7','8','9','10'});%加x轴刻度标注
% yticks([1 2 3 4 5 6]);%画格网的时候的小刻度
% yticklabels({'1','2','3','4','5','6'});%加y轴刻度标注
set(gca,'linewidth',1,'fontsize',ssize,'FontName',fontnamed);
% set(gca,'yticklabel',[]);%y轴不显示
% set(gca,'xticklabel',[]);%x轴不显示
grid on;box on;hold on;%% 画legend
% hLegend1=legend('A1', 'A2', 'A3','Location', 'northeast','Box', 'off','Orientation','horizontal','fontsize',ssize,'FontName',fontnamed);
%方法一
% kk=legend('h1');
% set(kk,'location','NorthEast','Box', 'off','fontsize',ssize,'FontName',fontnamed);%'orientation','horizontal',
%方法二
% columnlegend(2,{'L1','L2','L3','L4','L5','L6'},'North');%表示一行放三个图例以及图例的位置%% Matlab中有许多位置可以选择:
% 'North' inside plot box near top
% 'South' inside bottom
% 'East' inside right
% 'West' inside left
% 'NorthEast' inside top right (default for 2-D plots)
% 'NorthWest' inside top left
% 'SouthEast' inside bottom right
% 'SouthWest' inside bottom left
% 'NorthOutside' outside plot box near top
% 'SouthOutside' outside bottom
% 'EastOutside' outside right
% 'WestOutside' outside left
% 'NorthEastOutside' outside top right (default for 3-D plots)
% 'NorthWestOutside' outside top left
% 'SouthEastOutside' outside bottom right
% 'SouthWestOutside' outside bottom left
% 'Best' least conflict with data in plot 与绘图中的数据冲突最小
% 'BestOutside' least unused space outside plot%% 背景颜色
set(gcf,'Color',[1 1 1]);
%% 设置完毕后,按照所需分辨率、格式输出
figW = figureWidth;
figH = figureHeight;
set(figureHandle,'PaperUnits',figureUnits);
set(figureHandle,'PaperPosition',[0 0 figW figH]);
fileout = 'demo_scartter_double_bar_plus';
print(figureHandle,[fileout,'.png'],'-r600','-dpng');
15 【MATLAB】科研绘图第十五期多Y轴图
%% 多Y轴图%% Made by Lwcah (公众号:Lwcah)
%% 公众号:Lwcah
%% 知乎、B站、小红书、抖音同名账号:Lwcah,感谢关注~
%% 更多MATLAB+SCI绘图教程敬请观看~%% 清除环境变量
close all;clear all;clc;%% 1行1列-定义整幅图出现的在电脑屏幕上的位置以及长和宽
figureHandle = figure;
figureUnits = 'centimeters';
figureWidth = 15;
figureHeight = 8;
set(gcf, 'Units', figureUnits, 'Position', [0 0 figureWidth figureHeight]);%% 定义字体和字号大小-通常的SCI一般Arial字体和10字号通用
fontnamed='Arial'; % 字号名字Arial
ssize=10;            % 字号大小
% 如果是中文论文可以相应的更改字号名字如下
% '华文中宋' '华文仿宋' '华文宋体' '华文新魏' '华文楷体'
% '华文琥珀' '华文细黑' '华文行楷' '华文隶书' '宋体'
% '方正姚体' '微软雅黑' '方正舒体' '新宋体'
% '幼圆' '楷体' '等线' '隶书' '黑体'%% 给定绘图颜色
C1 = chinesecolors(343); % 香水玫瑰
C2 = chinesecolors(150); % 靛青
C3 = chinesecolors(523); % 玫瑰灰
C4 = chinesecolors(232); % 粉绿%%
% handle = maxis(number of axis, y-spacing between outside lines)
h = myaxisc(4,0.10); % 第一个参数4是设置轴的数量,第二个参数0.10是设置轴间距
% Create some random data for plotting
t1  = 0:0.1:5;
t2  = 0:1:5;
y11 = sin(t1);
y21 = t1.^2-5;
y22 = 15-t2.*2;
y31 = sqrt(t1).*2+97;
y41 = rand(size(t1))-2;
y42 = rand(size(t1))+4;p(1) = plot(h.p(1),t1,y11,'Color',C1);hold on;
p(2) = plot(h.p(2),t1,y21,'Color',C2,'LineStyle','--','Marker','o');hold on;
p(3) = plot(h.p(2),t2,y22,'Color',C2,'LineStyle','--','Marker','s');hold on;
p(4) = plot(h.p(3),t1,y31,'Color',C3);hold on;
p(5) = plot(h.p(4),t1,y41,'Color',C4,'LineStyle','--','Marker','o');hold on;
p(6) = plot(h.p(4),t1,y42,'Color',C4,'LineStyle','--','Marker','s');hold on;
% p(7) = bar(h.p(4),t1,y42,0.20,'FaceColor',C4);hold on; % 如果要画柱状图的话h.xlim([0,5]);                       % Set X-Axis Limits
h.autoscale;                         % Automatically Scale Y Axis
h.autoy(3);                          % Autoscale only specified y-axis
% h.ylim(3,[95,105]);                % Set Y-Limits for axis 3
% h.ylim(4,[-3,8]);                  % Set Y-Limits for axis 4
h.gridon;                            % Enable grid (use h.gridoff to remove)
h.ycolor(1,C1);                      % Modify the y-Axis Color
h.ycolor(2,C2);                      % Modify the y-Axis Color
h.ycolor(3,C3);                      % Modify the y-Axis Color
h.ycolor(4,C4);                      % Modify the y-Axis Color
h.ylabel(1,'First Y-Axis (Y1)');     % Add y-Labels
h.ylabel(2,'Second Y-Axis (Y2)');    % Add y-Labels
h.ylabel(3,'Third Y-Axis (Y3)');     % Add y-Labels
h.ylabel(4,'Another Y-Axis(Y4)');    % Add y-Labels
h.xlabel('X-Axis');                  % Add x-Label
h.fontsize(10);                      % Change all font sizes
h.position([0.1,0.15,0.8,0.75],0.12); % Position-Vector and Spacing 0.12%% 增添图例
kk=legend(h.legendtarget,p,'Line 1','Line 2','Line 3','Line 4','Line 5','Line 6');
set(kk,'location','NorthOutside','Box', 'off','Orientation','horizontal','fontsize',10,'FontName',fontnamed);
% Matlab中有许多位置可以选择:
% 'North' inside plot box near top
% 'South' inside bottom
% 'East' inside right
% 'West' inside left
% 'NorthEast' inside top right (default for 2-D plots)
% 'NorthWest' inside top left
% 'SouthEast' inside bottom right
% 'SouthWest' inside bottom left
% 'NorthOutside' outside plot box near top
% 'SouthOutside' outside bottom
% 'EastOutside' outside right
% 'WestOutside' outside left
% 'NorthEastOutside' outside top right (default for 3-D plots)
% 'NorthWestOutside' outside top left
% 'SouthEastOutside' outside bottom right
% 'SouthWestOutside' outside bottom left
% 'Best' least conflict with data in plot 与绘图中的数据冲突最小
% 'BestOutside' least unused space outside plot%% 背景颜色
set(gcf,'Color',[1 1 1])
%% 设置完毕后,按照所需分辨率、格式输出
figW = figureWidth;
figH = figureHeight;
set(figureHandle,'PaperUnits',figureUnits);
set(figureHandle,'PaperPosition',[0 0 figW figH]);
fileout = 'myaxisc_example';
print(figureHandle,[fileout,'.png'],'-r800','-dpng');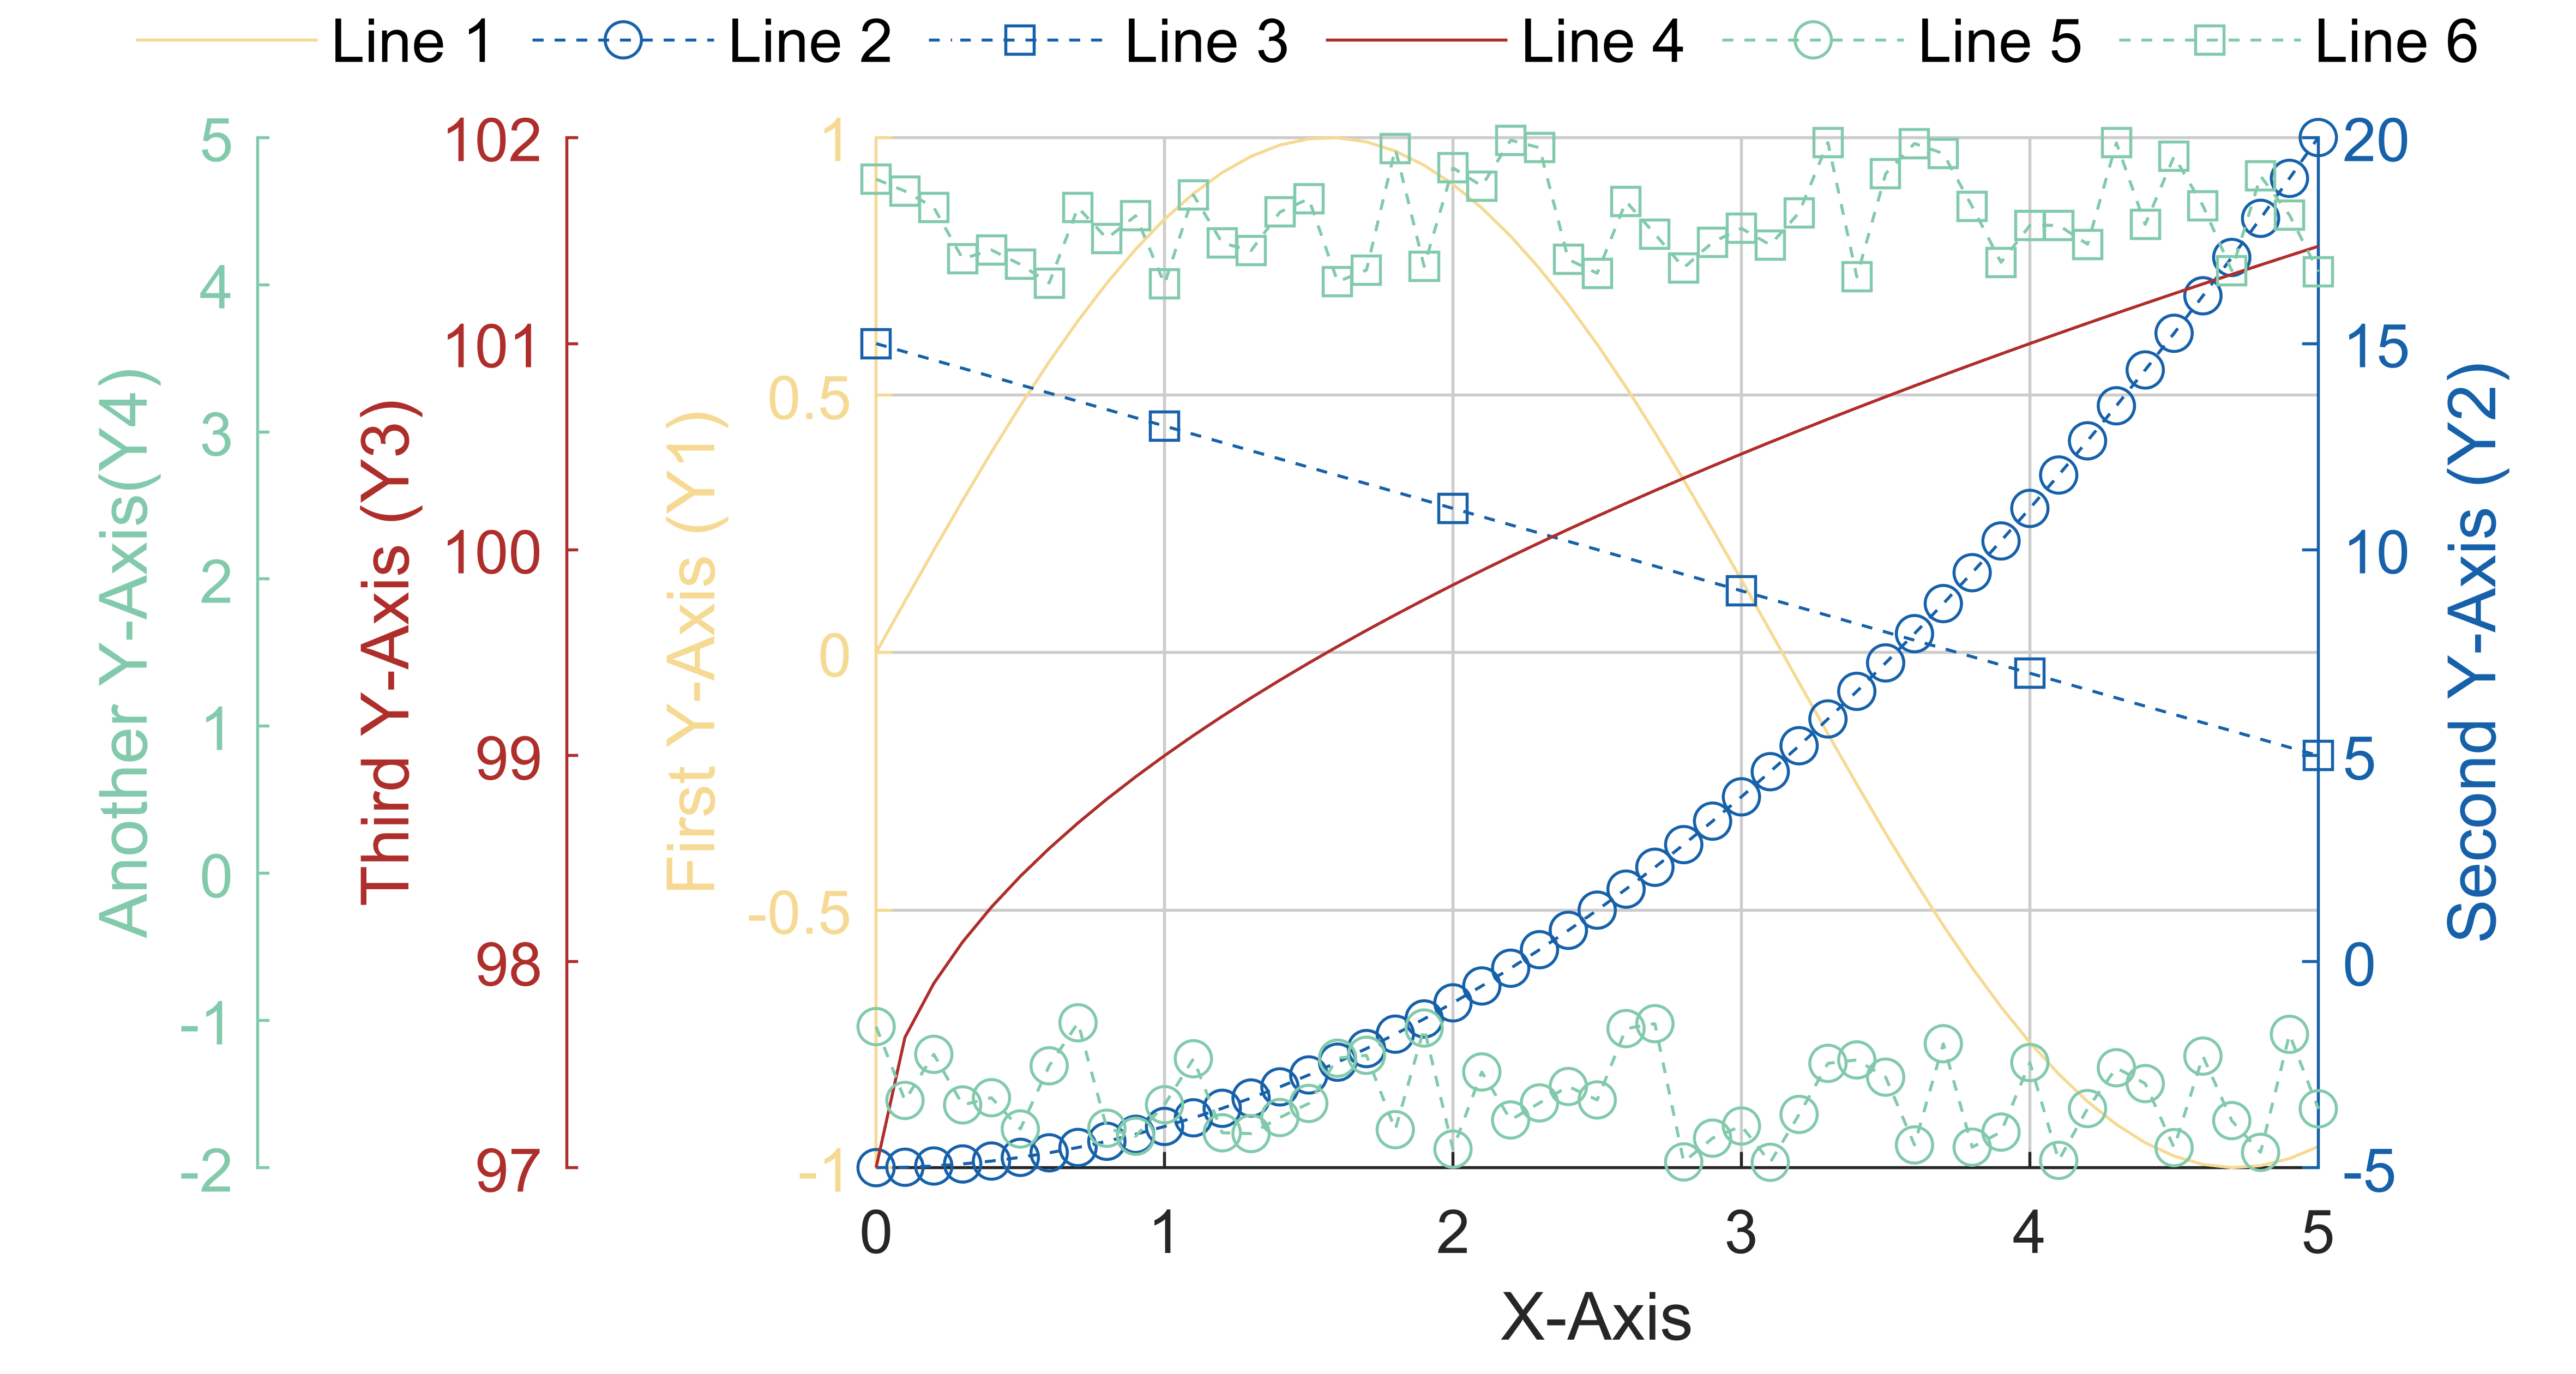
16 【MATLAB】科研绘图第十六期三Y轴图
%% 三Y轴图
%% 根据自己绘图需求需要修改的有46,49,50,51,53,75和77%% Made by Lwcah(公众号:Lwcah)
%% 公众号:Lwcah
%% 知乎、B站、小红书、抖音同名账号:Lwcah,感谢关注~
%% 更多MATLAB+SCI绘图教程敬请观看~%% 清除环境变量
close all;clear all;clc;%% 1行1列-定义整幅图出现的在电脑屏幕上的位置以及长和宽
figureHandle   = figure;
figureUnits    = 'centimeters';
figureWidth    = 15;
figureHeight   = 8;
set(gcf, 'Units', figureUnits, 'Position', [0 0 figureWidth figureHeight]);%% 定义字体和字号大小-通常的SCI一般Arial字体和10字号通用
fontnamed      = 'Arial';         % 字号名字Arial
ssize          = 10;              % 字号大小
% 如果是中文论文可以相应的更改字号名字如下
% '华文中宋' '华文仿宋' '华文宋体' '华文新魏' '华文楷体'
% '华文琥珀' '华文细黑' '华文行楷' '华文隶书' '宋体'
% '方正姚体' '微软雅黑' '方正舒体' '新宋体'
% '幼圆' '楷体' '等线' '隶书' '黑体'%% 给定绘图颜色
C1 = chinesecolors(343);     % 香水玫瑰
C2 = chinesecolors(150);     % 靛青
C3 = chinesecolors(523);     % 玫瑰灰
C4 = chinesecolors(232);     % 粉绿%% 加载数据
load res_CRMN
x  = 1:1:18;
x  = x';
y1 = res_CRMN(:,3);          % 误差
y2 = res_CRMN(:,2);          % 均方根误差
y3 = res_CRMN(:,1);          % 相关系数%% 绘图
[ax1,hlines1] = plotyn(x,y1,x,y2,x,y3); % 画三Y轴图(主函数29行和子函数第56列要更改,修图功能)%% 增添图例
% kk=legend(h.legendtarget,p,'Line 1','Line 2','Line 3','Line 4','Line 5','Line 6');
% set(kk,'location','NorthOutside','Box', 'off','Orientation','horizontal','fontsize',10,'FontName',fontnamed);
% Matlab中有许多位置可以选择:
% 'North' inside plot box near top
% 'South' inside bottom
% 'East' inside right
% 'West' inside left
% 'NorthEast' inside top right (default for 2-D plots)
% 'NorthWest' inside top left
% 'SouthEast' inside bottom right
% 'SouthWest' inside bottom left
% 'NorthOutside' outside plot box near top
% 'SouthOutside' outside bottom
% 'EastOutside' outside right
% 'WestOutside' outside left
% 'NorthEastOutside' outside top right (default for 3-D plots)
% 'NorthWestOutside' outside top left
% 'SouthEastOutside' outside bottom right
% 'SouthWestOutside' outside bottom left
% 'Best' least conflict with data in plot 与绘图中的数据冲突最小
% 'BestOutside' least unused space outside plot%% 背景颜色
set(gcf,'Color',[1 1 1])
%% 设置完毕后,按照所需分辨率、格式输出
figW    = figureWidth;
figH    = figureHeight;
set(figureHandle,'PaperUnits',figureUnits);
set(figureHandle,'PaperPosition',[0 0 figW figH]);
fileout = 'demo_yaxis3';
print(figureHandle,[fileout,'.png'],'-r800','-dpng');
17 【MATLAB】科研绘图第十七期双Y轴图
%% 三Y轴图
%% 根据自己绘图需求需要修改的有46,49,50,51,53,75和77%% Made by Lwcah(公众号:Lwcah)
%% 公众号:Lwcah
%% 知乎、B站、小红书、抖音同名账号:Lwcah,感谢关注~
%% 更多MATLAB+SCI绘图教程敬请观看~%% 清除环境变量
close all;clear all;clc;%% 1行1列-定义整幅图出现的在电脑屏幕上的位置以及长和宽
figureHandle   = figure;
figureUnits    = 'centimeters';
figureWidth    = 15;
figureHeight   = 7;
set(gcf, 'Units', figureUnits, 'Position', [0 0 figureWidth figureHeight]);%% 定义字体和字号大小-通常的SCI一般Arial字体和10字号通用
fontnamed      = 'Arial';         % 字号名字Arial
ssize          = 10;              % 字号大小
% 如果是中文论文可以相应的更改字号名字如下
% '华文中宋' '华文仿宋' '华文宋体' '华文新魏' '华文楷体'
% '华文琥珀' '华文细黑' '华文行楷' '华文隶书' '宋体'
% '方正姚体' '微软雅黑' '方正舒体' '新宋体'
% '幼圆' '楷体' '等线' '隶书' '黑体'%% 给定绘图颜色
C1 = chinesecolors(150);     % 靛青
C2 = chinesecolors(523);     % 玫瑰灰
C3 = chinesecolors(343);     % 香水玫瑰
C4 = chinesecolors(232);     % 粉绿%% 加载数据
load res_CRMN
x  = 1:1:18;
x  = x';
y1 = res_CRMN(:,3);          % 误差
y2 = res_CRMN(:,2);          % 均方根误差%% 绘图
yyaxis left
h1 = line (x,y1,'LineStyle','--','Marker','o','LineWidth',1,'Color',C1, 'MarkerEdgeColor',C1,'MarkerFaceColor',C1);hold on;
ylabel('Y1-axis','fontsize',ssize,'FontName',fontnamed,'Color',C1);
axis([0 19 -0.2 0]);%XY轴的范围
xticks([1 2 3 4 5 6 7 8 9 10 11 12 13 14 15 16 17 18]);%画格网的时候的小刻度
xticklabels({'1','2','3','4','5','6','7','8','9','10','11','12','13','14','15','16','17','18'});%加x轴刻度标注
yticks([-0.20 -0.15 -0.10 -0.05 0]);%画格网的时候的小刻度
yticklabels({'-0.20','-0.15','-0.10','-0.05','0'});%加y轴刻度标注
set(gca,'linewidth',1,'fontsize',ssize,'FontName',fontnamed);
set(gca,'ycolor',C1);yyaxis right
h2 = line (x,y2,'LineStyle','--','Marker','o','LineWidth',1,'Color',C2, 'MarkerEdgeColor',C2,'MarkerFaceColor',C2);hold on;
hold on;box on;grid on;axis on;
ylabel('Y2-axis','fontsize',ssize,'FontName',fontnamed,'Color',C2);
axis([0 19 0.2 0.6]);%XY轴的范围
% xticks([1 2 3 4 5 6 7 8 9 10 11 12 13 14 15 16 17 18]);%画格网的时候的小刻度
% xticklabels({'1','2','3','4','5','6','7','8','9','10','11','12','13','14','15','16','17','18'});%加x轴刻度标注
yticks([0.2 0.3 0.4 0.5 0.6]);%画格网的时候的小刻度
yticklabels({'0.2','0.3','0.4','0.5','0.6'});%加y轴刻度标注
set(gca,'linewidth',1,'fontsize',ssize,'FontName',fontnamed);
set(gca,'ycolor',C2);xlabel('X-axis','fontsize',ssize,'FontName',fontnamed);%% 增添图例
kk=legend([h1,h2],'L1','L2');
set(kk,'location','North','Box', 'off','fontsize',ssize,'orientation','horizontal','FontName',fontnamed);%% Matlab中有许多位置可以选择:
% 'North' inside plot box near top
% 'South' inside bottom
% 'East' inside right
% 'West' inside left
% 'NorthEast' inside top right (default for 2-D plots)
% 'NorthWest' inside top left
% 'SouthEast' inside bottom right
% 'SouthWest' inside bottom left
% 'NorthOutside' outside plot box near top
% 'SouthOutside' outside bottom
% 'EastOutside' outside right
% 'WestOutside' outside left
% 'NorthEastOutside' outside top right (default for 3-D plots)
% 'NorthWestOutside' outside top left
% 'SouthEastOutside' outside bottom right
% 'SouthWestOutside' outside bottom left
% 'Best' least conflict with data in plot 与绘图中的数据冲突最小
% 'BestOutside' least unused space outside plot%% 背景颜色
set(gcf,'Color',[1 1 1])
%% 设置完毕后,按照所需分辨率、格式输出
figW    = figureWidth;
figH    = figureHeight;
set(figureHandle,'PaperUnits',figureUnits);
set(figureHandle,'PaperPosition',[0 0 figW figH]);
fileout = 'demo_yaxis2';
print(figureHandle,[fileout,'.png'],'-r800','-dpng');
18 【MATLAB】科研绘图第十八期散点密度图
%% 散点密度图%% Made by Lwcah in 2023-06-26(公众号:Lwcah)
%% 公众号:Lwcah
%% 知乎、B站、小红书、抖音同名账号:Lwcah,感谢关注~
%% 更多MATLAB+SCI绘图教程敬请观看~%% 清除环境变量
close all;clear all;clc;%% 1行1列-定义整幅图出现的在电脑屏幕上的位置以及长和宽
figureHandle   = figure;
figureUnits    = 'centimeters';
figureWidth    = 15;
figureHeight   = 16;
set(gcf, 'Units', figureUnits, 'Position', [2 2 figureWidth figureHeight]);
%定义子图在图中的x,y以及长和宽
pos54                   = zeros(20,4);
pos54(:,3)              = 0.23;                   % 长x
pos54(:,4)              = 0.19;                   % 宽y
pos54([17 18 19 20],2)  = 0.05;                   % y
pos54([13 14 15 16],2)  = 0.24;                   % y
pos54([9 10 11 12],2)   = 0.43;                   % y
pos54([5 6 7 8],2)      = 0.62;                   % y
pos54([1 2 3 4],2)      = 0.81;                   % y
pos54([1 5 9 13 17],1)  = 0.07;                   % x
pos54([2 6 10 14 18],1) = 0.30;                   % x
pos54([3 7 11 15 19],1) = 0.53;                   % x
pos54([4 8 12 16 20],1) = 0.76;                   % x%% 定义字体和字号大小-通常的SCI一般Arial字体和10字号通用
fontnamed      = 'Arial';         % 字号名字Arial
ssize          = 10;              % 字号大小
% 如果是中文论文可以相应的更改字号名字如下
% '华文中宋' '华文仿宋' '华文宋体' '华文新魏' '华文楷体'
% '华文琥珀' '华文细黑' '华文行楷' '华文隶书' '宋体'
% '方正姚体' '微软雅黑' '方正舒体' '新宋体'
% '幼圆' '楷体' '等线' '隶书' '黑体'%% 给定绘图颜色
C1 = chinesecolors(150);     % 靛青
C2 = chinesecolors(523);     % 玫瑰灰
C3 = chinesecolors(343);     % 香水玫瑰
C4 = chinesecolors(232);     % 粉绿%% 加载数据
load x
load y
res_CRMN                                           = [];                    % 用于存储反演的精度结果%% 绘图
subplot('position',pos54(1,:));
[res_CRMN,str_equation,str_C,str_RMSE,str_M,str_N] = plotcc(res_CRMN,x,y,C1,C2);
ylabel('Y-axis','fontsize',ssize,'FontName',fontnamed);
text(0,4.5,'(a)','fontsize',ssize,'FontName',fontnamed);subplot('position',pos54(2,:));
[res_CRMN,str_equation,str_C,str_RMSE,str_M,str_N] = plotcc(res_CRMN,x,y,C1,C2);
text(0,4.5,'(b)','fontsize',ssize,'FontName',fontnamed);subplot('position',pos54(3,:));
[res_CRMN,str_equation,str_C,str_RMSE,str_M,str_N] = plotcc(res_CRMN,x,y,C1,C2);
text(0,4.5,'(c)','fontsize',ssize,'FontName',fontnamed);subplot('position',pos54(4,:));
[res_CRMN,str_equation,str_C,str_RMSE,str_M,str_N] = plotcc(res_CRMN,x,y,C1,C2);
text(0,4.5,'(d)','fontsize',ssize,'FontName',fontnamed);subplot('position',pos54(5,:));
[res_CRMN,str_equation,str_C,str_RMSE,str_M,str_N] = plotcc(res_CRMN,x,y,C1,C2);
ylabel('Y-axis','fontsize',ssize,'FontName',fontnamed);
text(0,4.5,'(e)','fontsize',ssize,'FontName',fontnamed);subplot('position',pos54(6,:));
[res_CRMN,str_equation,str_C,str_RMSE,str_M,str_N] = plotcc(res_CRMN,x,y,C1,C2);
text(0,4.5,'(f)','fontsize',ssize,'FontName',fontnamed);subplot('position',pos54(7,:));
[res_CRMN,str_equation,str_C,str_RMSE,str_M,str_N] = plotcc(res_CRMN,x,y,C1,C2);
text(0,4.5,'(g)','fontsize',ssize,'FontName',fontnamed);subplot('position',pos54(8,:));
[res_CRMN,str_equation,str_C,str_RMSE,str_M,str_N] = plotcc(res_CRMN,x,y,C1,C2);
text(0,4.5,'(h)','fontsize',ssize,'FontName',fontnamed);subplot('position',pos54(9,:));
[res_CRMN,str_equation,str_C,str_RMSE,str_M,str_N] = plotcc(res_CRMN,x,y,C1,C2);
ylabel('Y-axis','fontsize',ssize,'FontName',fontnamed);
text(0,4.5,'(i)','fontsize',ssize,'FontName',fontnamed);subplot('position',pos54(10,:));
[res_CRMN,str_equation,str_C,str_RMSE,str_M,str_N] = plotcc(res_CRMN,x,y,C1,C2);
text(0,4.5,'(j)','fontsize',ssize,'FontName',fontnamed);subplot('position',pos54(11,:));
[res_CRMN,str_equation,str_C,str_RMSE,str_M,str_N] = plotcc(res_CRMN,x,y,C1,C2);
text(0,4.5,'(k)','fontsize',ssize,'FontName',fontnamed);subplot('position',pos54(12,:));
[res_CRMN,str_equation,str_C,str_RMSE,str_M,str_N] = plotcc(res_CRMN,x,y,C1,C2);
text(0,4.5,'(l)','fontsize',ssize,'FontName',fontnamed);subplot('position',pos54(13,:));
[res_CRMN,str_equation,str_C,str_RMSE,str_M,str_N] = plotcc(res_CRMN,x,y,C1,C2);
ylabel('Y-axis','fontsize',ssize,'FontName',fontnamed);
text(0,4.5,'(m)','fontsize',ssize,'FontName',fontnamed);subplot('position',pos54(14,:));
[res_CRMN,str_equation,str_C,str_RMSE,str_M,str_N] = plotcc(res_CRMN,x,y,C1,C2);
text(0,4.5,'(n)','fontsize',ssize,'FontName',fontnamed);subplot('position',pos54(15,:));
[res_CRMN,str_equation,str_C,str_RMSE,str_M,str_N] = plotcc(res_CRMN,x,y,C1,C2);
text(0,4.5,'(o)','fontsize',ssize,'FontName',fontnamed);subplot('position',pos54(16,:));
[res_CRMN,str_equation,str_C,str_RMSE,str_M,str_N] = plotcc(res_CRMN,x,y,C1,C2);
text(0,4.5,'(p)','fontsize',ssize,'FontName',fontnamed);subplot('position',pos54(17,:));
[res_CRMN,str_equation,str_C,str_RMSE,str_M,str_N] = plotcc(res_CRMN,x,y,C1,C2);
ylabel('Y-axis','fontsize',ssize,'FontName',fontnamed);
xlabel('X-axis','fontsize',ssize,'FontName',fontnamed);
text(0,4.5,'(q)','fontsize',ssize,'FontName',fontnamed);subplot('position',pos54(18,:));
[res_CRMN,str_equation,str_C,str_RMSE,str_M,str_N] = plotcc(res_CRMN,x,y,C1,C2);
xlabel('X-axis','fontsize',ssize,'FontName',fontnamed);
text(0,4.5,'(r)','fontsize',ssize,'FontName',fontnamed);subplot('position',pos54(19,:));
[res_CRMN,str_equation,str_C,str_RMSE,str_M,str_N] = plotcc(res_CRMN,x,y,C1,C2);
xlabel('X-axis','fontsize',ssize,'FontName',fontnamed);
text(0,4.5,'(s)','fontsize',ssize,'FontName',fontnamed);subplot('position',pos54(20,:));
[res_CRMN,str_equation,str_C,str_RMSE,str_M,str_N] = plotcc(res_CRMN,x,y,C1,C2);
xlabel('X-axis','fontsize',ssize,'FontName',fontnamed);
text(0,4.5,'(t)','fontsize',ssize,'FontName',fontnamed);%% 增添图例
% kk=legend([h1,h2],'L1','L2');
% set(kk,'location','North','Box', 'off','fontsize',ssize,'orientation','horizontal','FontName',fontnamed);%% Matlab中有许多位置可以选择:
% 'North' inside plot box near top
% 'South' inside bottom
% 'East' inside right
% 'West' inside left
% 'NorthEast' inside top right (default for 2-D plots)
% 'NorthWest' inside top left
% 'SouthEast' inside bottom right
% 'SouthWest' inside bottom left
% 'NorthOutside' outside plot box near top
% 'SouthOutside' outside bottom
% 'EastOutside' outside right
% 'WestOutside' outside left
% 'NorthEastOutside' outside top right (default for 3-D plots)
% 'NorthWestOutside' outside top left
% 'SouthEastOutside' outside bottom right
% 'SouthWestOutside' outside bottom left
% 'Best' least conflict with data in plot 与绘图中的数据冲突最小
% 'BestOutside' least unused space outside plot%% 背景颜色
set(gcf,'Color',[1 1 1])
%% 设置完毕后,按照所需分辨率、格式输出
figW    = figureWidth;
figH    = figureHeight;
set(figureHandle,'PaperUnits',figureUnits);
set(figureHandle,'PaperPosition',[0 0 figW figH]);
fileout = 'demo4_scatter_density5x4';
print(figureHandle,[fileout,'.png'],'-r800','-dpng');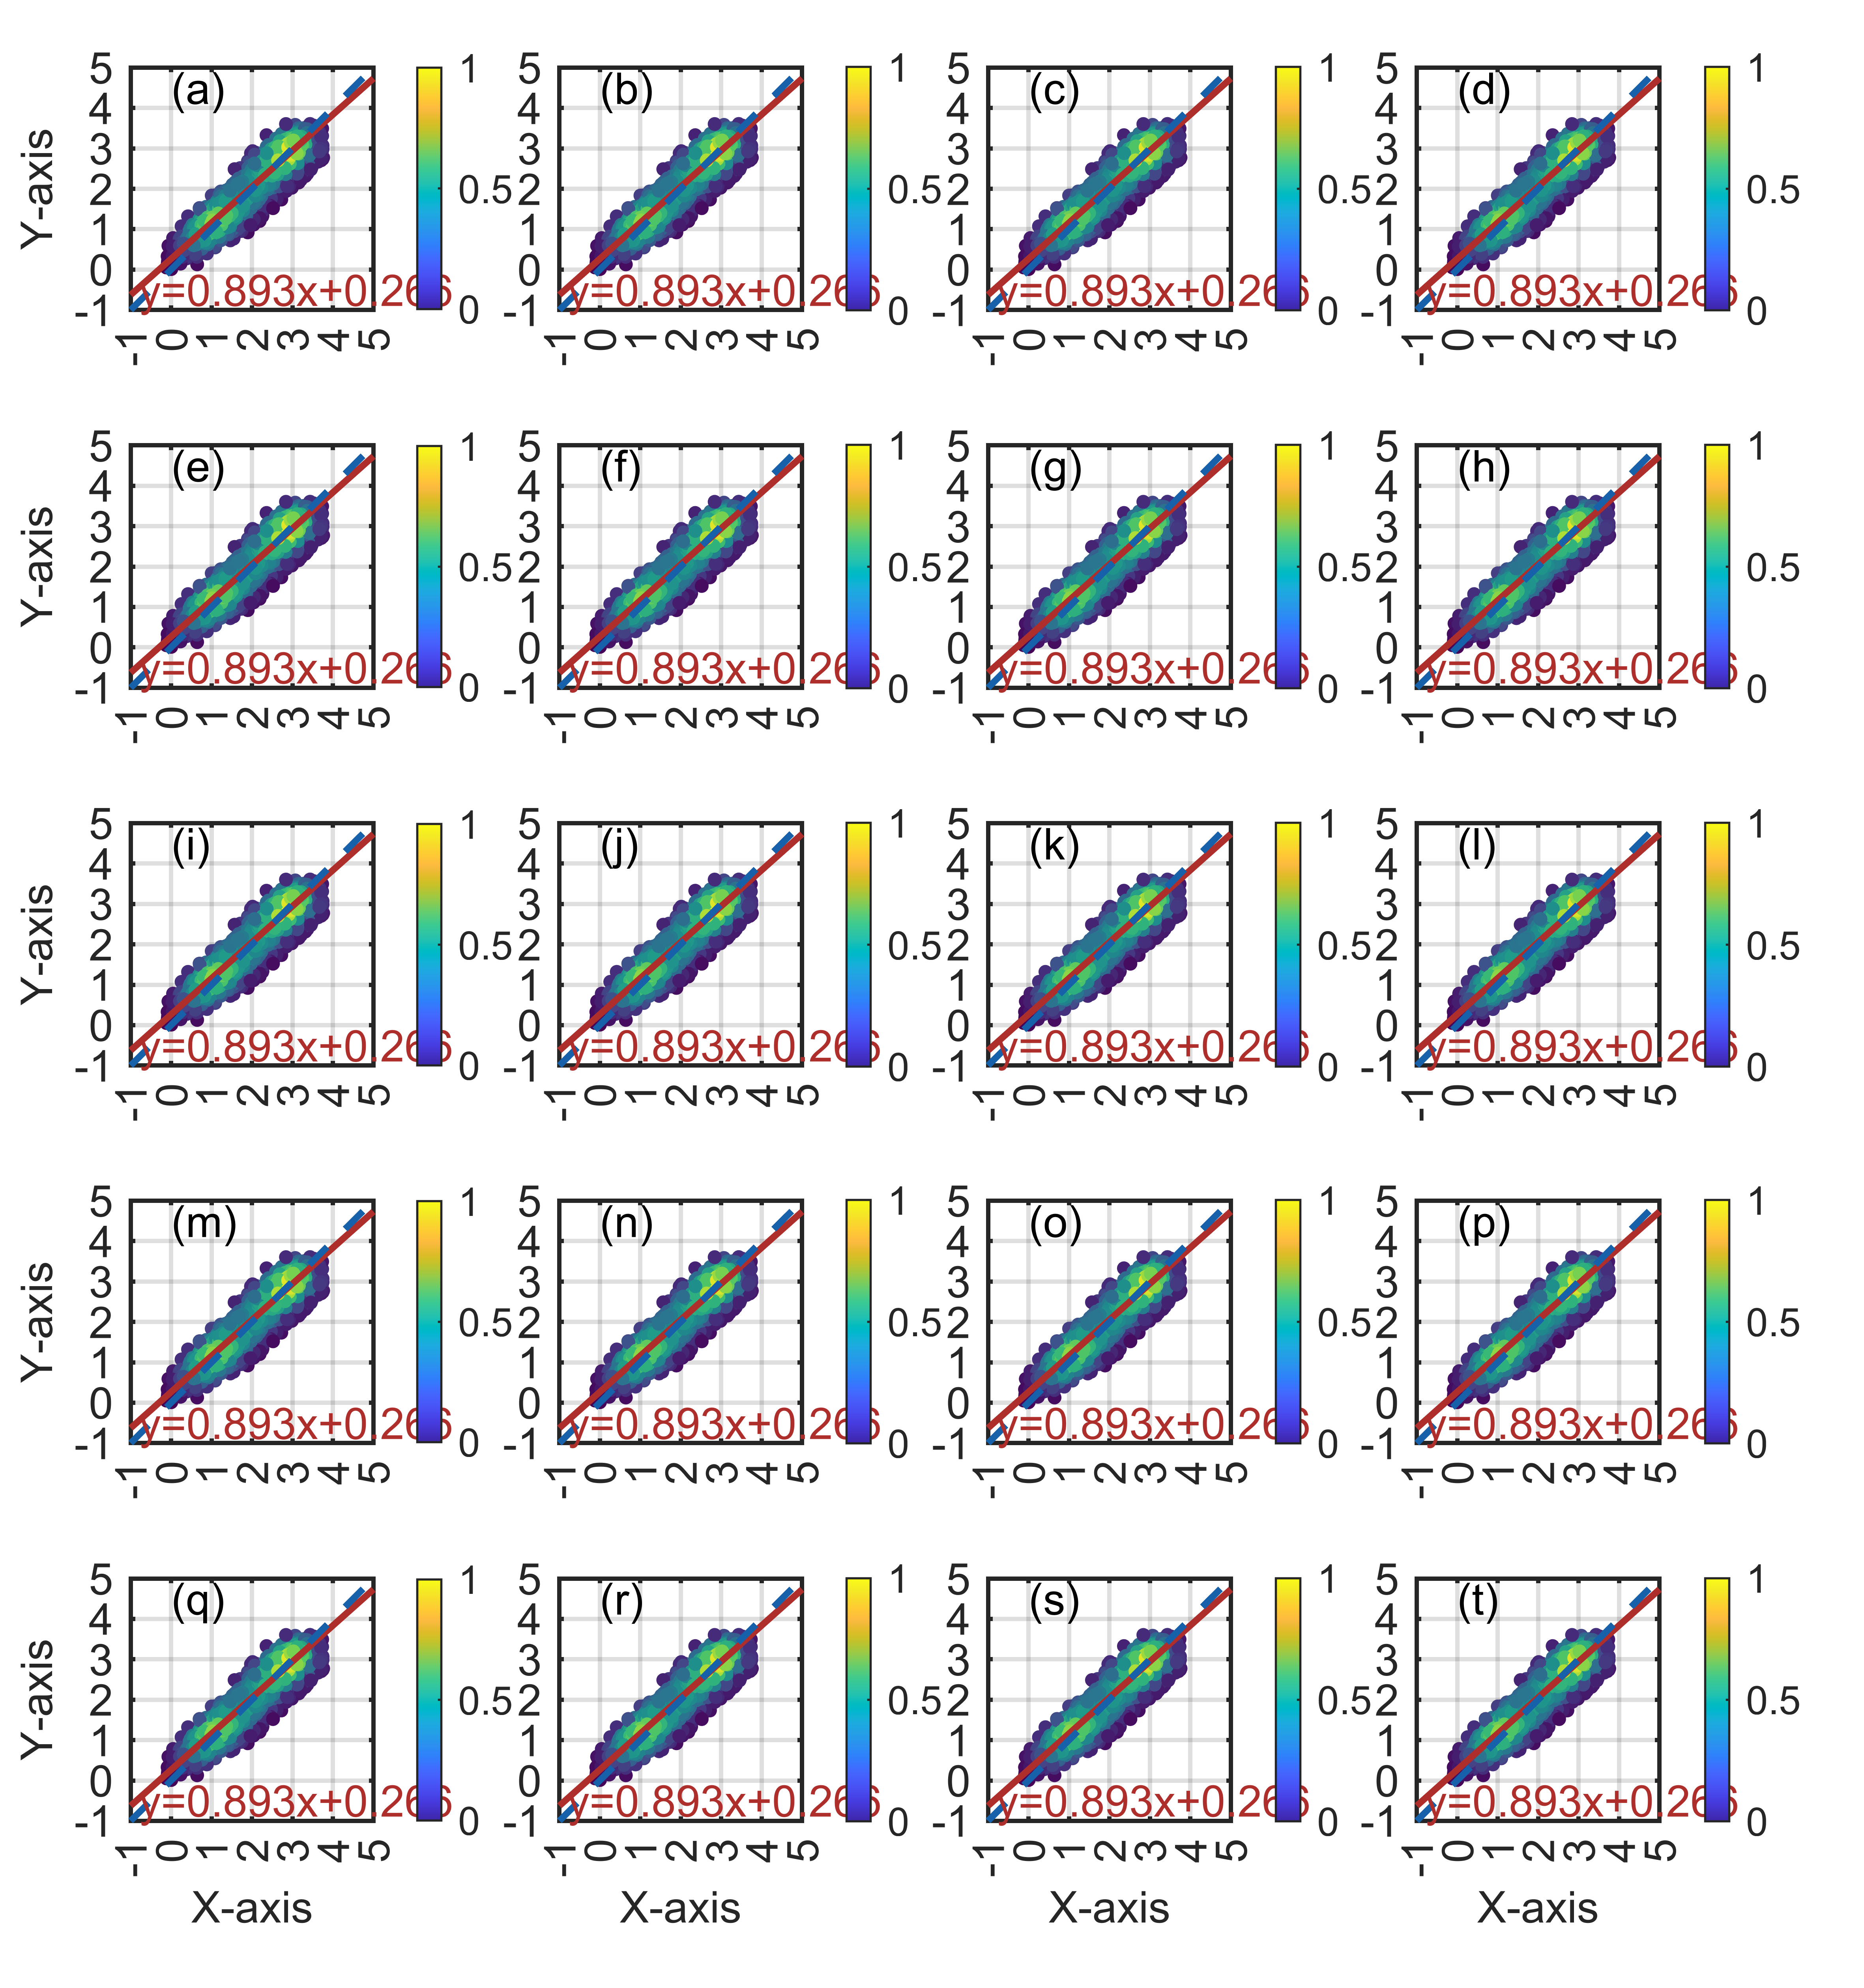
19 【MATLAB】科研绘图第十九期散点密度图强化版
%% 散点密度图%% Made by Lwcah in 2023-06-26(公众号:Lwcah)
%% 公众号:Lwcah
%% 知乎、B站、小红书、抖音同名账号:Lwcah,感谢关注~
%% 更多MATLAB+SCI绘图教程敬请观看~%% 清除环境变量
close all;clear all;clc;%% 1行1列-定义整幅图出现的在电脑屏幕上的位置以及长和宽
figureHandle   = figure;
figureUnits    = 'centimeters';
figureWidth    = 15;
figureHeight   = 16;
set(gcf, 'Units', figureUnits, 'Position', [2 2 figureWidth figureHeight]);
%定义子图在图中的x,y以及长和宽
pos54                   = zeros(20,4);
pos54(:,3)              = 0.23;                   % 长x
pos54(:,4)              = 0.19;                   % 宽y
pos54([17 18 19 20],2)  = 0.05;                   % y
pos54([13 14 15 16],2)  = 0.24;                   % y
pos54([9 10 11 12],2)   = 0.43;                   % y
pos54([5 6 7 8],2)      = 0.62;                   % y
pos54([1 2 3 4],2)      = 0.81;                   % y
pos54([1 5 9 13 17],1)  = 0.07;                   % x
pos54([2 6 10 14 18],1) = 0.30;                   % x
pos54([3 7 11 15 19],1) = 0.53;                   % x
pos54([4 8 12 16 20],1) = 0.76;                   % x%% 定义字体和字号大小-通常的SCI一般Arial字体和10字号通用
fontnamed      = 'Arial';         % 字号名字Arial
ssize          = 10;              % 字号大小
% 如果是中文论文可以相应的更改字号名字如下
% '华文中宋' '华文仿宋' '华文宋体' '华文新魏' '华文楷体'
% '华文琥珀' '华文细黑' '华文行楷' '华文隶书' '宋体'
% '方正姚体' '微软雅黑' '方正舒体' '新宋体'
% '幼圆' '楷体' '等线' '隶书' '黑体'%% 给定绘图颜色
C1 = chinesecolors(150);     % 靛青
C2 = chinesecolors(523);     % 玫瑰灰
C3 = chinesecolors(343);     % 香水玫瑰
C4 = chinesecolors(232);     % 粉绿%% 加载数据
load x
load y
res_CRMN                                           = [];                    % 用于存储反演的精度结果%% 绘图
subplot('position',pos54(1,:));
[res_CRMN,str_equation,str_C,str_RMSE,str_M,str_N] = plotcc_contourf(res_CRMN,x,y,C1,C2);
ylabel('Y-axis','fontsize',ssize,'FontName',fontnamed);
text(0,4.5,'(a)','fontsize',ssize,'FontName',fontnamed);subplot('position',pos54(2,:));
[res_CRMN,str_equation,str_C,str_RMSE,str_M,str_N] = plotcc_contourf(res_CRMN,x,y,C1,C2);
text(0,4.5,'(b)','fontsize',ssize,'FontName',fontnamed);subplot('position',pos54(3,:));
[res_CRMN,str_equation,str_C,str_RMSE,str_M,str_N] = plotcc_contourf(res_CRMN,x,y,C1,C2);
text(0,4.5,'(c)','fontsize',ssize,'FontName',fontnamed);subplot('position',pos54(4,:));
[res_CRMN,str_equation,str_C,str_RMSE,str_M,str_N] = plotcc_contourf(res_CRMN,x,y,C1,C2);
text(0,4.5,'(d)','fontsize',ssize,'FontName',fontnamed);subplot('position',pos54(5,:));
[res_CRMN,str_equation,str_C,str_RMSE,str_M,str_N] = plotcc_contourf(res_CRMN,x,y,C1,C2);
ylabel('Y-axis','fontsize',ssize,'FontName',fontnamed);
text(0,4.5,'(e)','fontsize',ssize,'FontName',fontnamed);subplot('position',pos54(6,:));
[res_CRMN,str_equation,str_C,str_RMSE,str_M,str_N] = plotcc_contourf(res_CRMN,x,y,C1,C2);
text(0,4.5,'(f)','fontsize',ssize,'FontName',fontnamed);subplot('position',pos54(7,:));
[res_CRMN,str_equation,str_C,str_RMSE,str_M,str_N] = plotcc_contourf(res_CRMN,x,y,C1,C2);
text(0,4.5,'(g)','fontsize',ssize,'FontName',fontnamed);subplot('position',pos54(8,:));
[res_CRMN,str_equation,str_C,str_RMSE,str_M,str_N] = plotcc_contourf(res_CRMN,x,y,C1,C2);
text(0,4.5,'(h)','fontsize',ssize,'FontName',fontnamed);subplot('position',pos54(9,:));
[res_CRMN,str_equation,str_C,str_RMSE,str_M,str_N] = plotcc_contourf(res_CRMN,x,y,C1,C2);
ylabel('Y-axis','fontsize',ssize,'FontName',fontnamed);
text(0,4.5,'(i)','fontsize',ssize,'FontName',fontnamed);subplot('position',pos54(10,:));
[res_CRMN,str_equation,str_C,str_RMSE,str_M,str_N] = plotcc_contourf(res_CRMN,x,y,C1,C2);
text(0,4.5,'(j)','fontsize',ssize,'FontName',fontnamed);subplot('position',pos54(11,:));
[res_CRMN,str_equation,str_C,str_RMSE,str_M,str_N] = plotcc_contourf(res_CRMN,x,y,C1,C2);
text(0,4.5,'(k)','fontsize',ssize,'FontName',fontnamed);subplot('position',pos54(12,:));
[res_CRMN,str_equation,str_C,str_RMSE,str_M,str_N] = plotcc_contourf(res_CRMN,x,y,C1,C2);
text(0,4.5,'(l)','fontsize',ssize,'FontName',fontnamed);subplot('position',pos54(13,:));
[res_CRMN,str_equation,str_C,str_RMSE,str_M,str_N] = plotcc_contourf(res_CRMN,x,y,C1,C2);
ylabel('Y-axis','fontsize',ssize,'FontName',fontnamed);
text(0,4.5,'(m)','fontsize',ssize,'FontName',fontnamed);subplot('position',pos54(14,:));
[res_CRMN,str_equation,str_C,str_RMSE,str_M,str_N] = plotcc_contourf(res_CRMN,x,y,C1,C2);
text(0,4.5,'(n)','fontsize',ssize,'FontName',fontnamed);subplot('position',pos54(15,:));
[res_CRMN,str_equation,str_C,str_RMSE,str_M,str_N] = plotcc_contourf(res_CRMN,x,y,C1,C2);
text(0,4.5,'(o)','fontsize',ssize,'FontName',fontnamed);subplot('position',pos54(16,:));
[res_CRMN,str_equation,str_C,str_RMSE,str_M,str_N] = plotcc_contourf(res_CRMN,x,y,C1,C2);
text(0,4.5,'(p)','fontsize',ssize,'FontName',fontnamed);subplot('position',pos54(17,:));
[res_CRMN,str_equation,str_C,str_RMSE,str_M,str_N] = plotcc_contourf(res_CRMN,x,y,C1,C2);
ylabel('Y-axis','fontsize',ssize,'FontName',fontnamed);
xlabel('X-axis','fontsize',ssize,'FontName',fontnamed);
text(0,4.5,'(q)','fontsize',ssize,'FontName',fontnamed);subplot('position',pos54(18,:));
[res_CRMN,str_equation,str_C,str_RMSE,str_M,str_N] = plotcc_contourf(res_CRMN,x,y,C1,C2);
xlabel('X-axis','fontsize',ssize,'FontName',fontnamed);
text(0,4.5,'(r)','fontsize',ssize,'FontName',fontnamed);subplot('position',pos54(19,:));
[res_CRMN,str_equation,str_C,str_RMSE,str_M,str_N] = plotcc_contourf(res_CRMN,x,y,C1,C2);
xlabel('X-axis','fontsize',ssize,'FontName',fontnamed);
text(0,4.5,'(s)','fontsize',ssize,'FontName',fontnamed);subplot('position',pos54(20,:));
[res_CRMN,str_equation,str_C,str_RMSE,str_M,str_N] = plotcc_contourf(res_CRMN,x,y,C1,C2);
xlabel('X-axis','fontsize',ssize,'FontName',fontnamed);
text(0,4.5,'(t)','fontsize',ssize,'FontName',fontnamed);%% 增添图例
% kk=legend([h1,h2],'L1','L2');
% set(kk,'location','North','Box', 'off','fontsize',ssize,'orientation','horizontal','FontName',fontnamed);%% Matlab中有许多位置可以选择:
% 'North' inside plot box near top
% 'South' inside bottom
% 'East' inside right
% 'West' inside left
% 'NorthEast' inside top right (default for 2-D plots)
% 'NorthWest' inside top left
% 'SouthEast' inside bottom right
% 'SouthWest' inside bottom left
% 'NorthOutside' outside plot box near top
% 'SouthOutside' outside bottom
% 'EastOutside' outside right
% 'WestOutside' outside left
% 'NorthEastOutside' outside top right (default for 3-D plots)
% 'NorthWestOutside' outside top left
% 'SouthEastOutside' outside bottom right
% 'SouthWestOutside' outside bottom left
% 'Best' least conflict with data in plot 与绘图中的数据冲突最小
% 'BestOutside' least unused space outside plot%% 背景颜色
set(gcf,'Color',[1 1 1])
%% 设置完毕后,按照所需分辨率、格式输出
figW    = figureWidth;
figH    = figureHeight;
set(figureHandle,'PaperUnits',figureUnits);
set(figureHandle,'PaperPosition',[0 0 figW figH]);
fileout = 'demo4_scatter_density5x4';
print(figureHandle,[fileout,'.png'],'-r800','-dpng');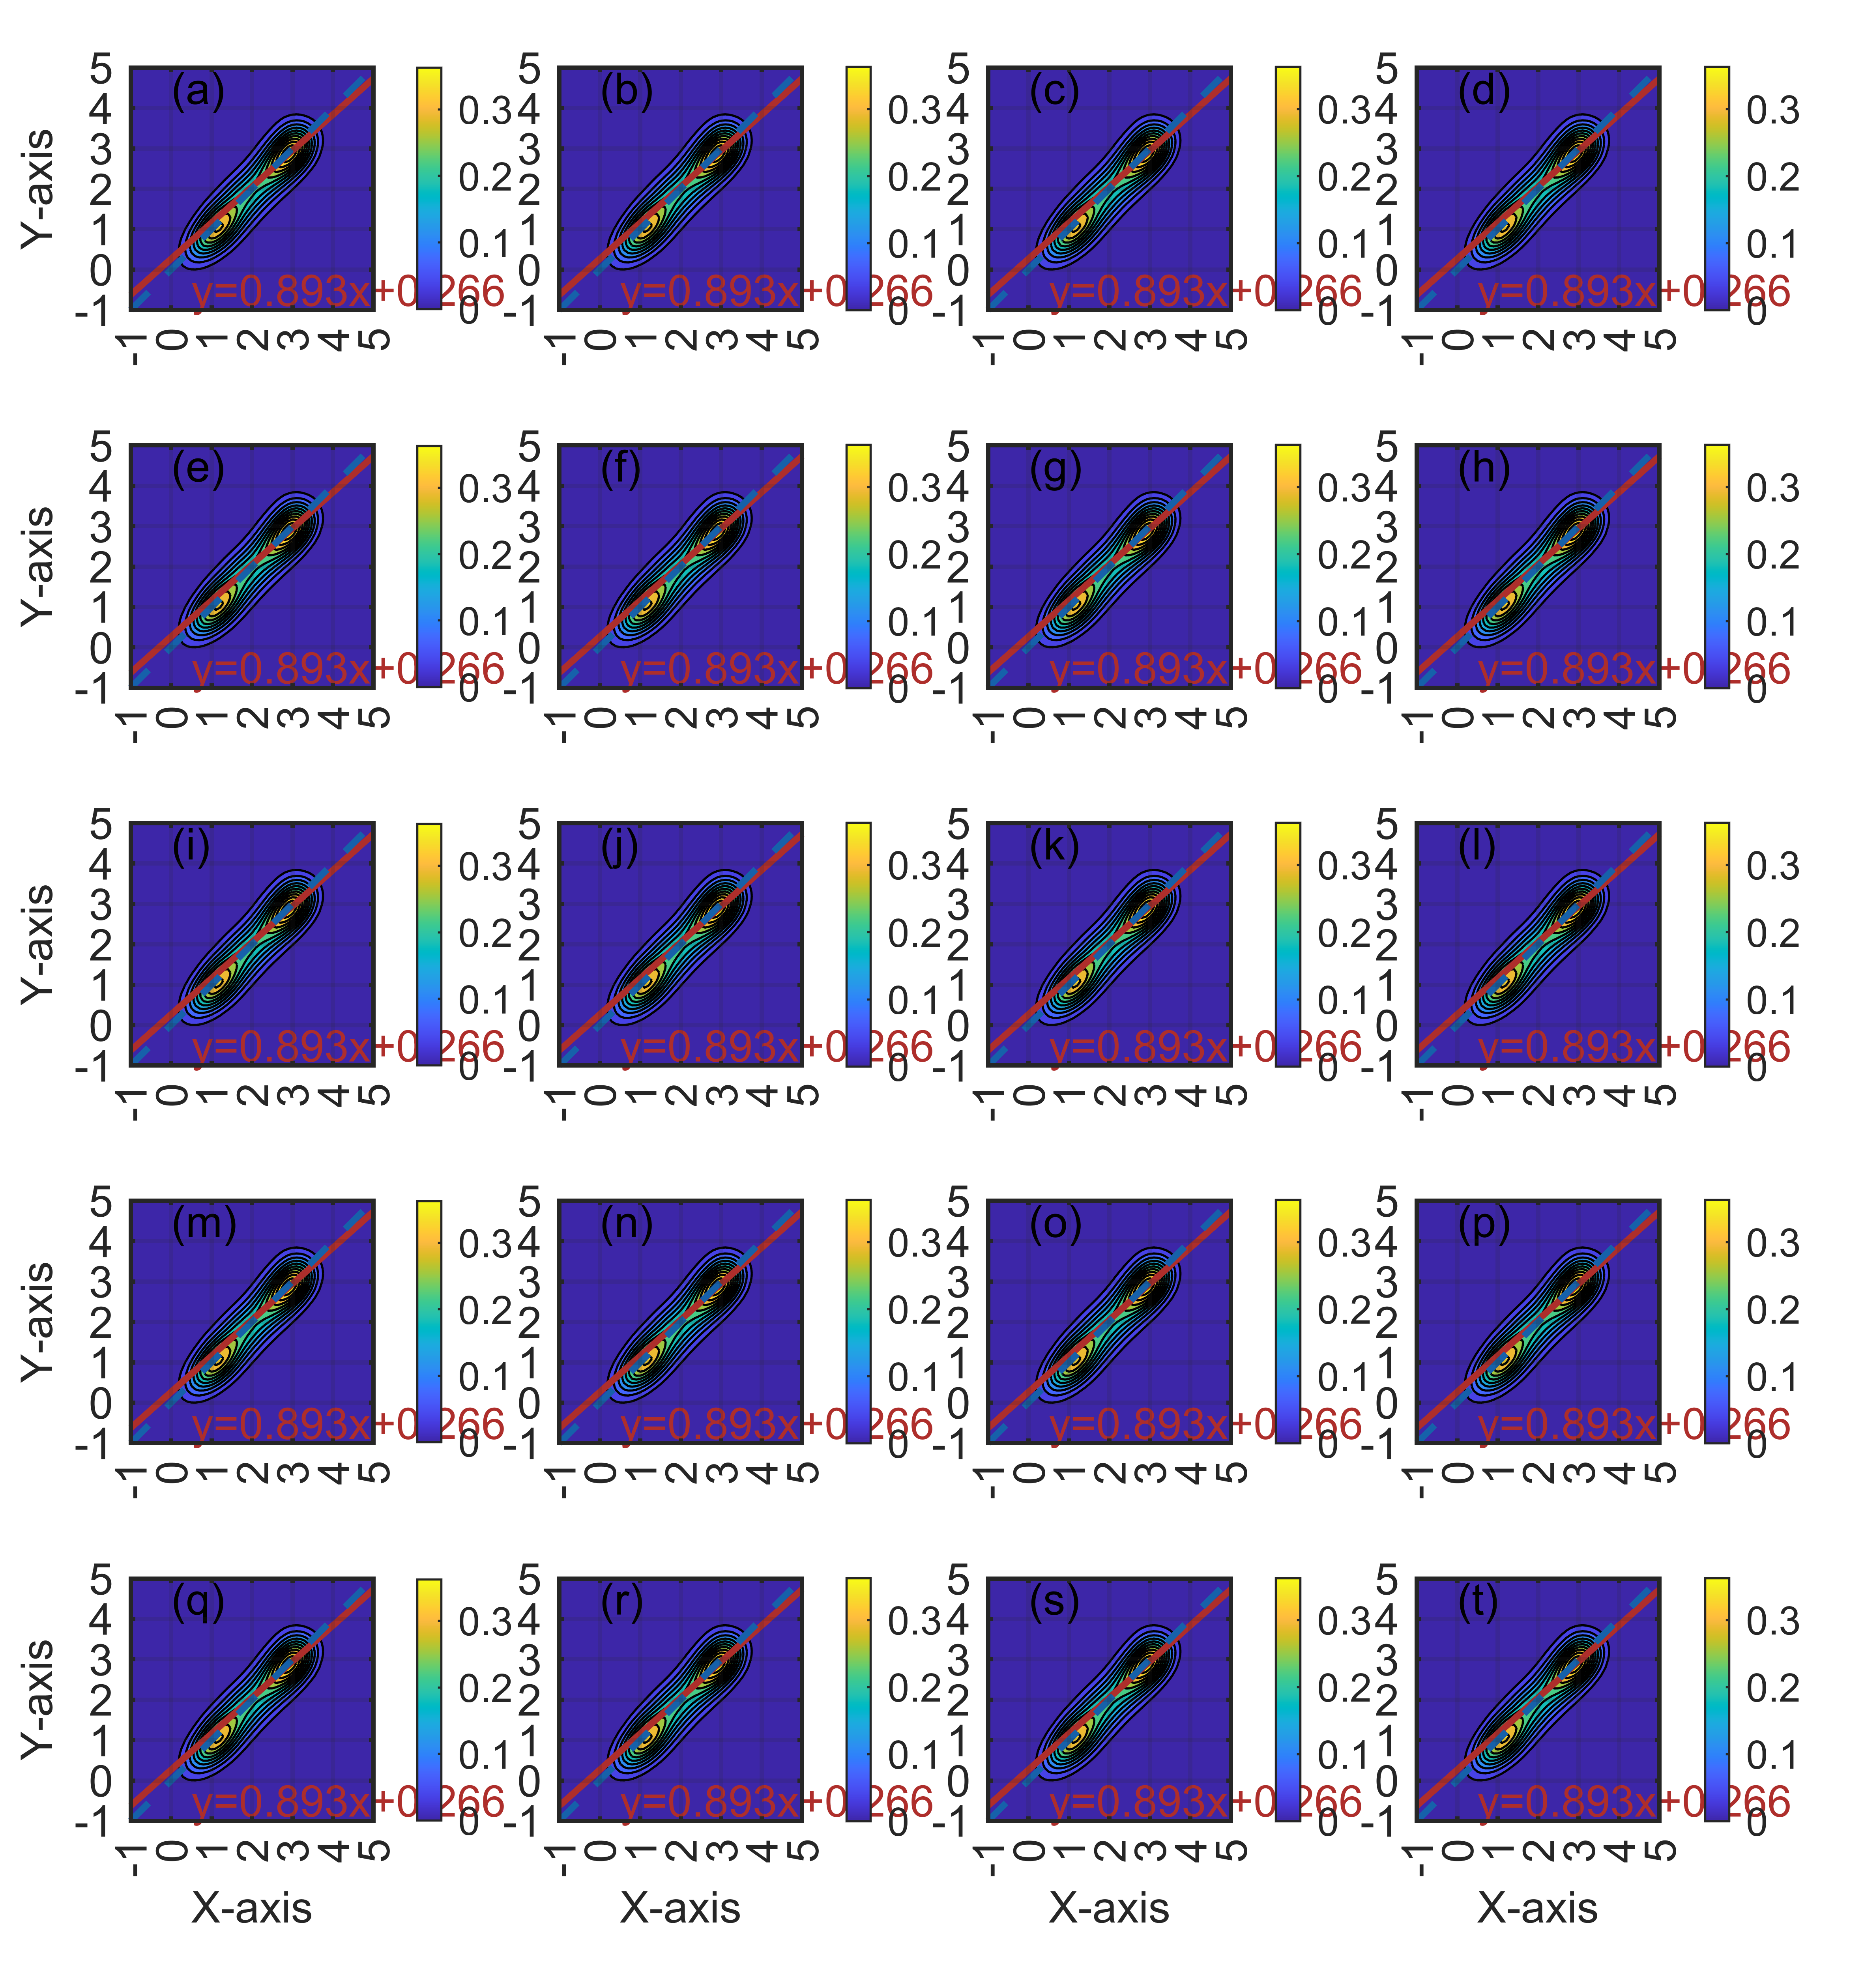
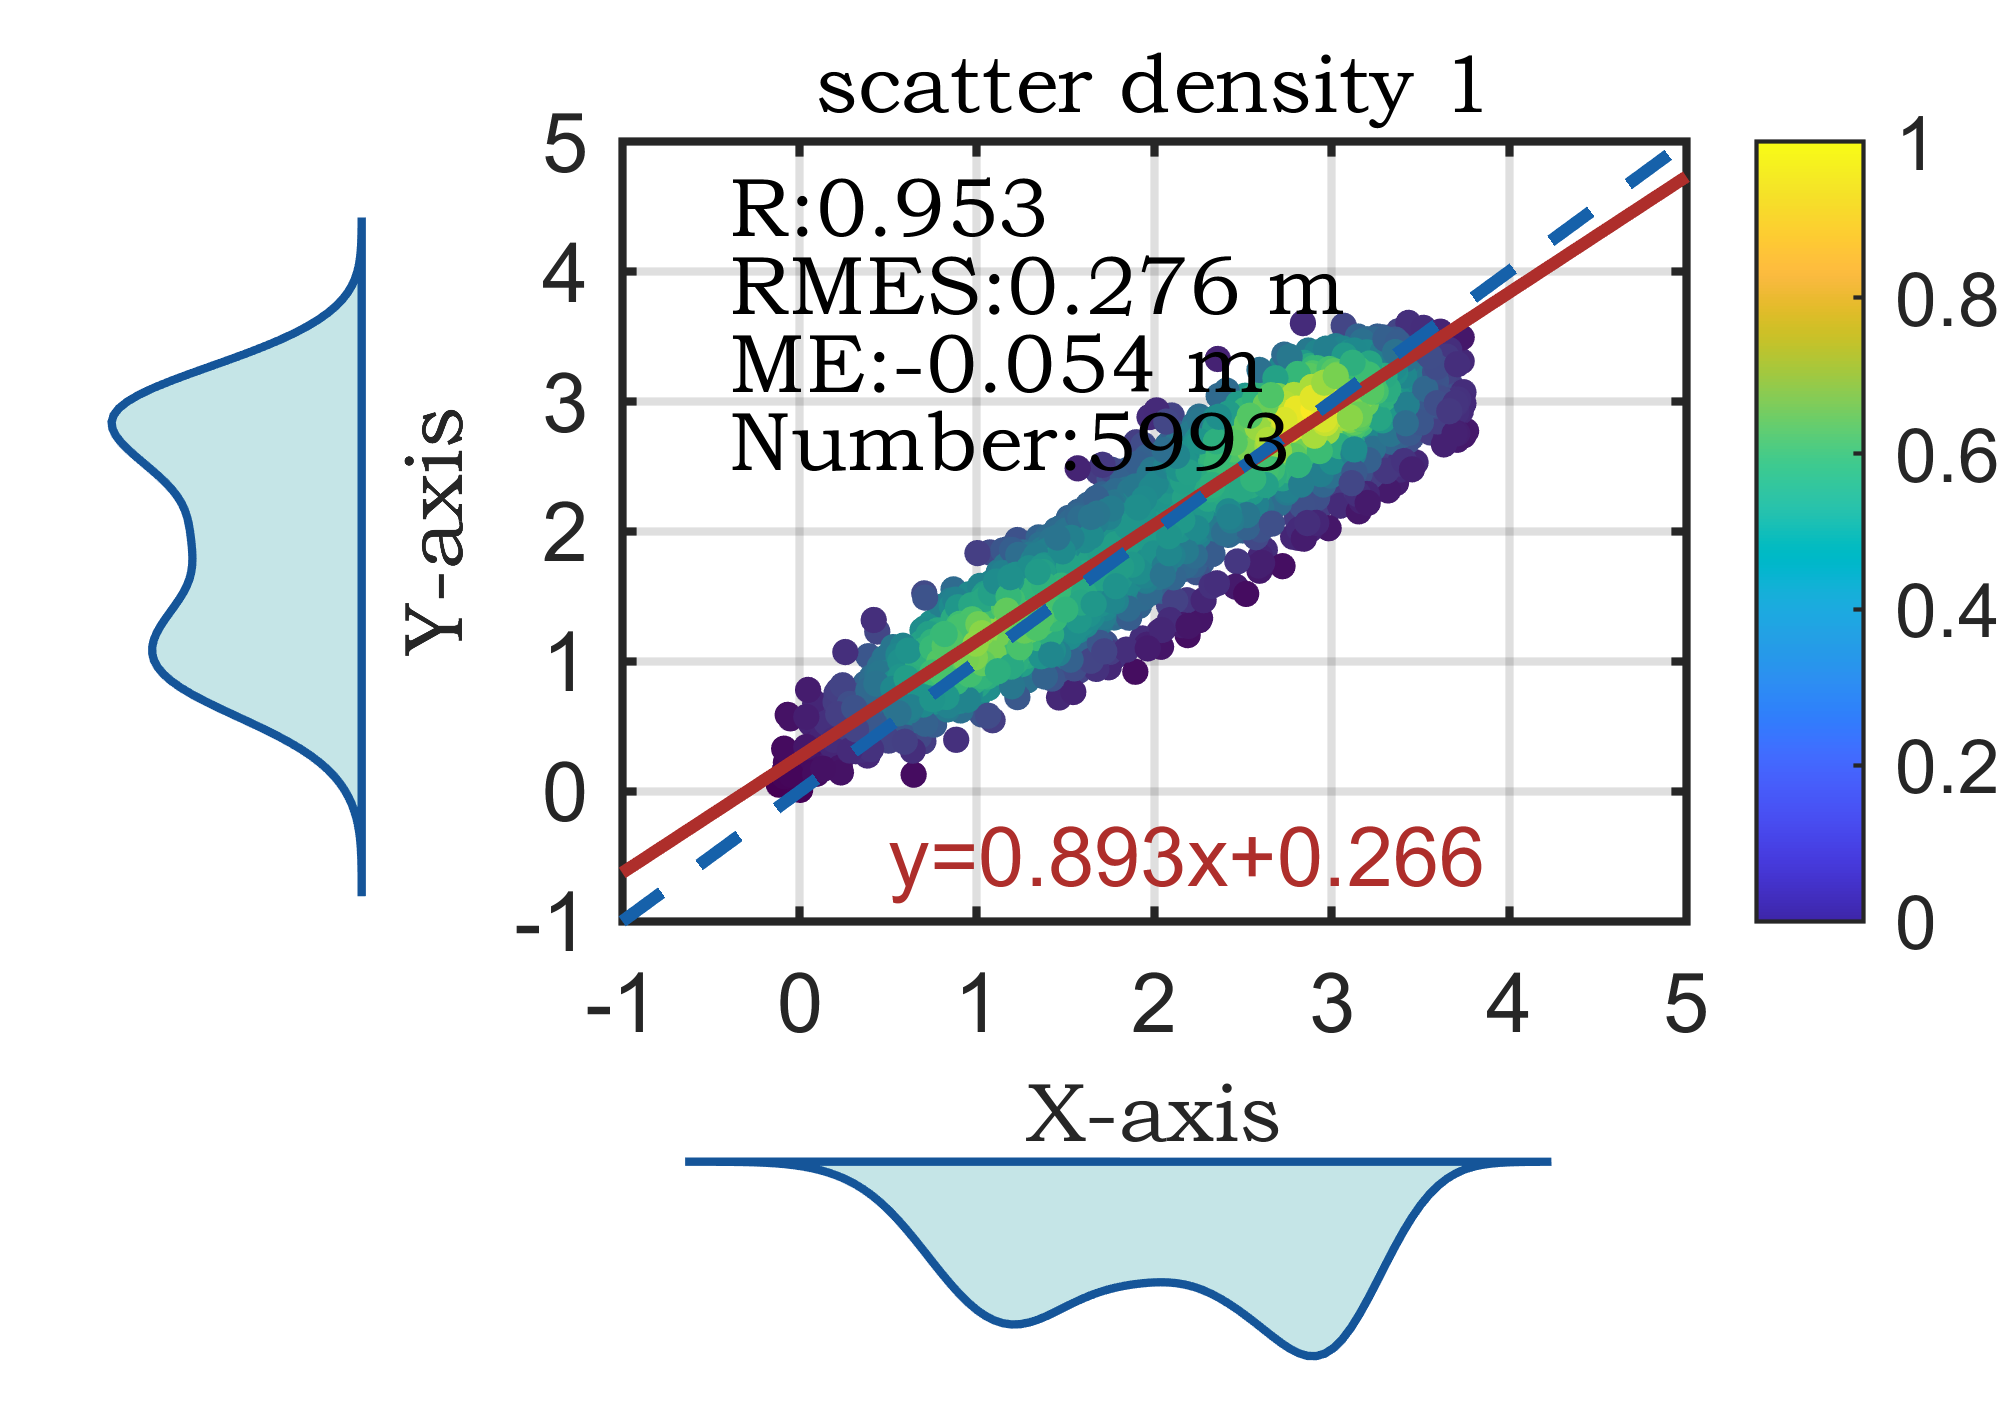
20 【MATLAB】科研绘图第二十期散点密度双柱状图
%% 表示散点分布的双柱状统计图%% Made by Lwcah(公众号:Lwcah)
%% 公众号:Lwcah
%% 知乎、B站、小红书、抖音同名账号:Lwcah,感谢关注~
%% 更多MATLAB+SCI绘图教程敬请观看~%% 清除变量
close all;clear all;clc;%% 1行1列
%% 一幅图的时候figureWidth = 8.5;figureHeight = 8;调整这两个参数就可以
%定义整幅图出现的在电脑屏幕上的位置以及长和宽
%这里有必要解释一下为什么figureWidth要设置为8.5;
%因详细解释需要很长的篇幅,请转公众号观看该天的文章。
figureHandle = figure;
figureUnits = 'centimeters';
figureWidth = 8.5;
figureHeight = 6;
set(gcf, 'Units', figureUnits, 'Position', [28 20 figureWidth figureHeight]);
% 注:28代表出图时图的左下角相对于整个电脑屏幕的左下角向左偏移28个单位,向上偏移20个单位。
% 可自行调节两个数字让图出在自己屏幕的某个位置%% 定义字体和字号大小
%% 通常的SCI一般Arial字体和10字号通用
fontnamed='华文中宋';  % 字号名字Arial
ssize=10;             % 字号大小
%% 如果是中文论文可以相应的更改字号名字如下
% '华文中宋' '华文仿宋' '华文宋体' '华文新魏' '华文楷体'
% '华文琥珀' '华文细黑' '华文行楷' '华文隶书' '宋体'
% '方正姚体' '微软雅黑' '方正舒体' '新宋体'
% '幼圆' '楷体' '等线' '隶书' '黑体'%% 给定绘图颜色
C1 = chinesecolors(150); % 靛青
C2 = chinesecolors(523); % 玫瑰灰
C3 = chinesecolors(343); % 香水玫瑰
C4 = chinesecolors(148); % 海涛蓝%% 数据
load x
load y%% 表示散点分布的双柱状统计图绘图subplot(2,2,2);
%% 绘图
res_CRMN                                           = [];
[res_CRMN,str_equation,str_C,str_RMSE,str_M,str_N]=plotcc(res_CRMN,x,y,C1,C2);% 用于存储反演的精度结果
% 是否添加X,Y轴标签
title('scatter density 1','fontsize',ssize,'FontName',fontnamed,'horiz','center');
ylabel('Y-axis','fontsize',ssize,'FontName',fontnamed);
xlabel('X-axis','fontsize',ssize,'FontName',fontnamed);
% text(-0.9,4.5,'(a)','fontsize',ssize,'FontName',fontnamed);
text(-0.4,4.5,str_C,'fontsize',ssize,'FontName',fontnamed);
text(-0.4,3.9,str_RMSE,'fontsize',ssize,'FontName',fontnamed);
text(-0.4,3.3,str_M,'fontsize',ssize,'FontName',fontnamed);
text(-0.4,2.7,str_N,'fontsize',ssize,'FontName',fontnamed);
axis on; h1 = gca;
hold on;box on;grid on;subplot(2,2,4);
[n1,ctr1] = hist(x,20);
bar(ctr1,-n1,1,'FaceColor',C4);%,'EdgeColor','none','FaceAlpha',0.7
axis off; h2 = gca;
h2.XLim=h1.XLim;
h2.XColor='none';
h2.YTickLabel='';
h2.TickDir='out';subplot(2,2,1);
[n2,ctr2] = hist(y,20);
barh(ctr2,-n2,1,'FaceColor',C4);%,'EdgeColor','none','FaceAlpha',0.7
axis off; h3 = gca;
h3.YLim=h1.YLim;
h3.YColor='none';
h3.XTickLabel='';
h3.TickDir='out';h1.Position = [0.31 0.35 0.53 0.55];
h2.Position = [0.31 0.03 0.53 0.15];
h3.Position = [0.03 0.35 0.15 0.55];%% 修图的标准格式代码
% text(0.5,0.9,'(a) XXX','fontsize',ssize,'FontName',fontnamed);%,'horiz','center'
% title('1000');
% xlabel('X-axis','fontsize',ssize,'FontName',fontnamed);
% ylabel('Y-axis','fontsize',ssize,'FontName',fontnamed);
% axis([0 10 0 7]);%XY轴的范围
% xticks([1 2 3 4 5 6 7 8 9 10]);%画格网的时候的小刻度
% xticklabels({'1','2','3','4','5','6','7','8','9','10'});%加x轴刻度标注
% yticks([1 2 3 4 5 6]);%画格网的时候的小刻度
% yticklabels({'1','2','3','4','5','6'});%加y轴刻度标注
set(gca,'linewidth',1,'fontsize',ssize,'FontName',fontnamed);
% set(gca,'yticklabel',[]);%y轴不显示
% set(gca,'xticklabel',[]);%x轴不显示
grid on;box on;hold on;%% 画legend
% hLegend1=legend('A1', 'A2', 'A3','Location', 'northeast','Box', 'off','Orientation','horizontal','fontsize',ssize,'FontName',fontnamed);
%方法一
% kk=legend('h1');
% set(kk,'location','NorthEast','Box', 'off','fontsize',ssize,'FontName',fontnamed);%'orientation','horizontal',
%方法二
% columnlegend(2,{'L1','L2','L3','L4','L5','L6'},'North');%表示一行放三个图例以及图例的位置%% Matlab中有许多位置可以选择:
% 'North' inside plot box near top
% 'South' inside bottom
% 'East' inside right
% 'West' inside left
% 'NorthEast' inside top right (default for 2-D plots)
% 'NorthWest' inside top left
% 'SouthEast' inside bottom right
% 'SouthWest' inside bottom left
% 'NorthOutside' outside plot box near top
% 'SouthOutside' outside bottom
% 'EastOutside' outside right
% 'WestOutside' outside left
% 'NorthEastOutside' outside top right (default for 3-D plots)
% 'NorthWestOutside' outside top left
% 'SouthEastOutside' outside bottom right
% 'SouthWestOutside' outside bottom left
% 'Best' least conflict with data in plot 与绘图中的数据冲突最小
% 'BestOutside' least unused space outside plot%% 背景颜色
set(gcf,'Color',[1 1 1]);
%% 设置完毕后,按照所需分辨率、格式输出
figW = figureWidth;
figH = figureHeight;
set(figureHandle,'PaperUnits',figureUnits);
set(figureHandle,'PaperPosition',[0 0 figW figH]);
fileout = 'demo1_scartter_double_bar';
print(figureHandle,[fileout,'.png'],'-r600','-dpng');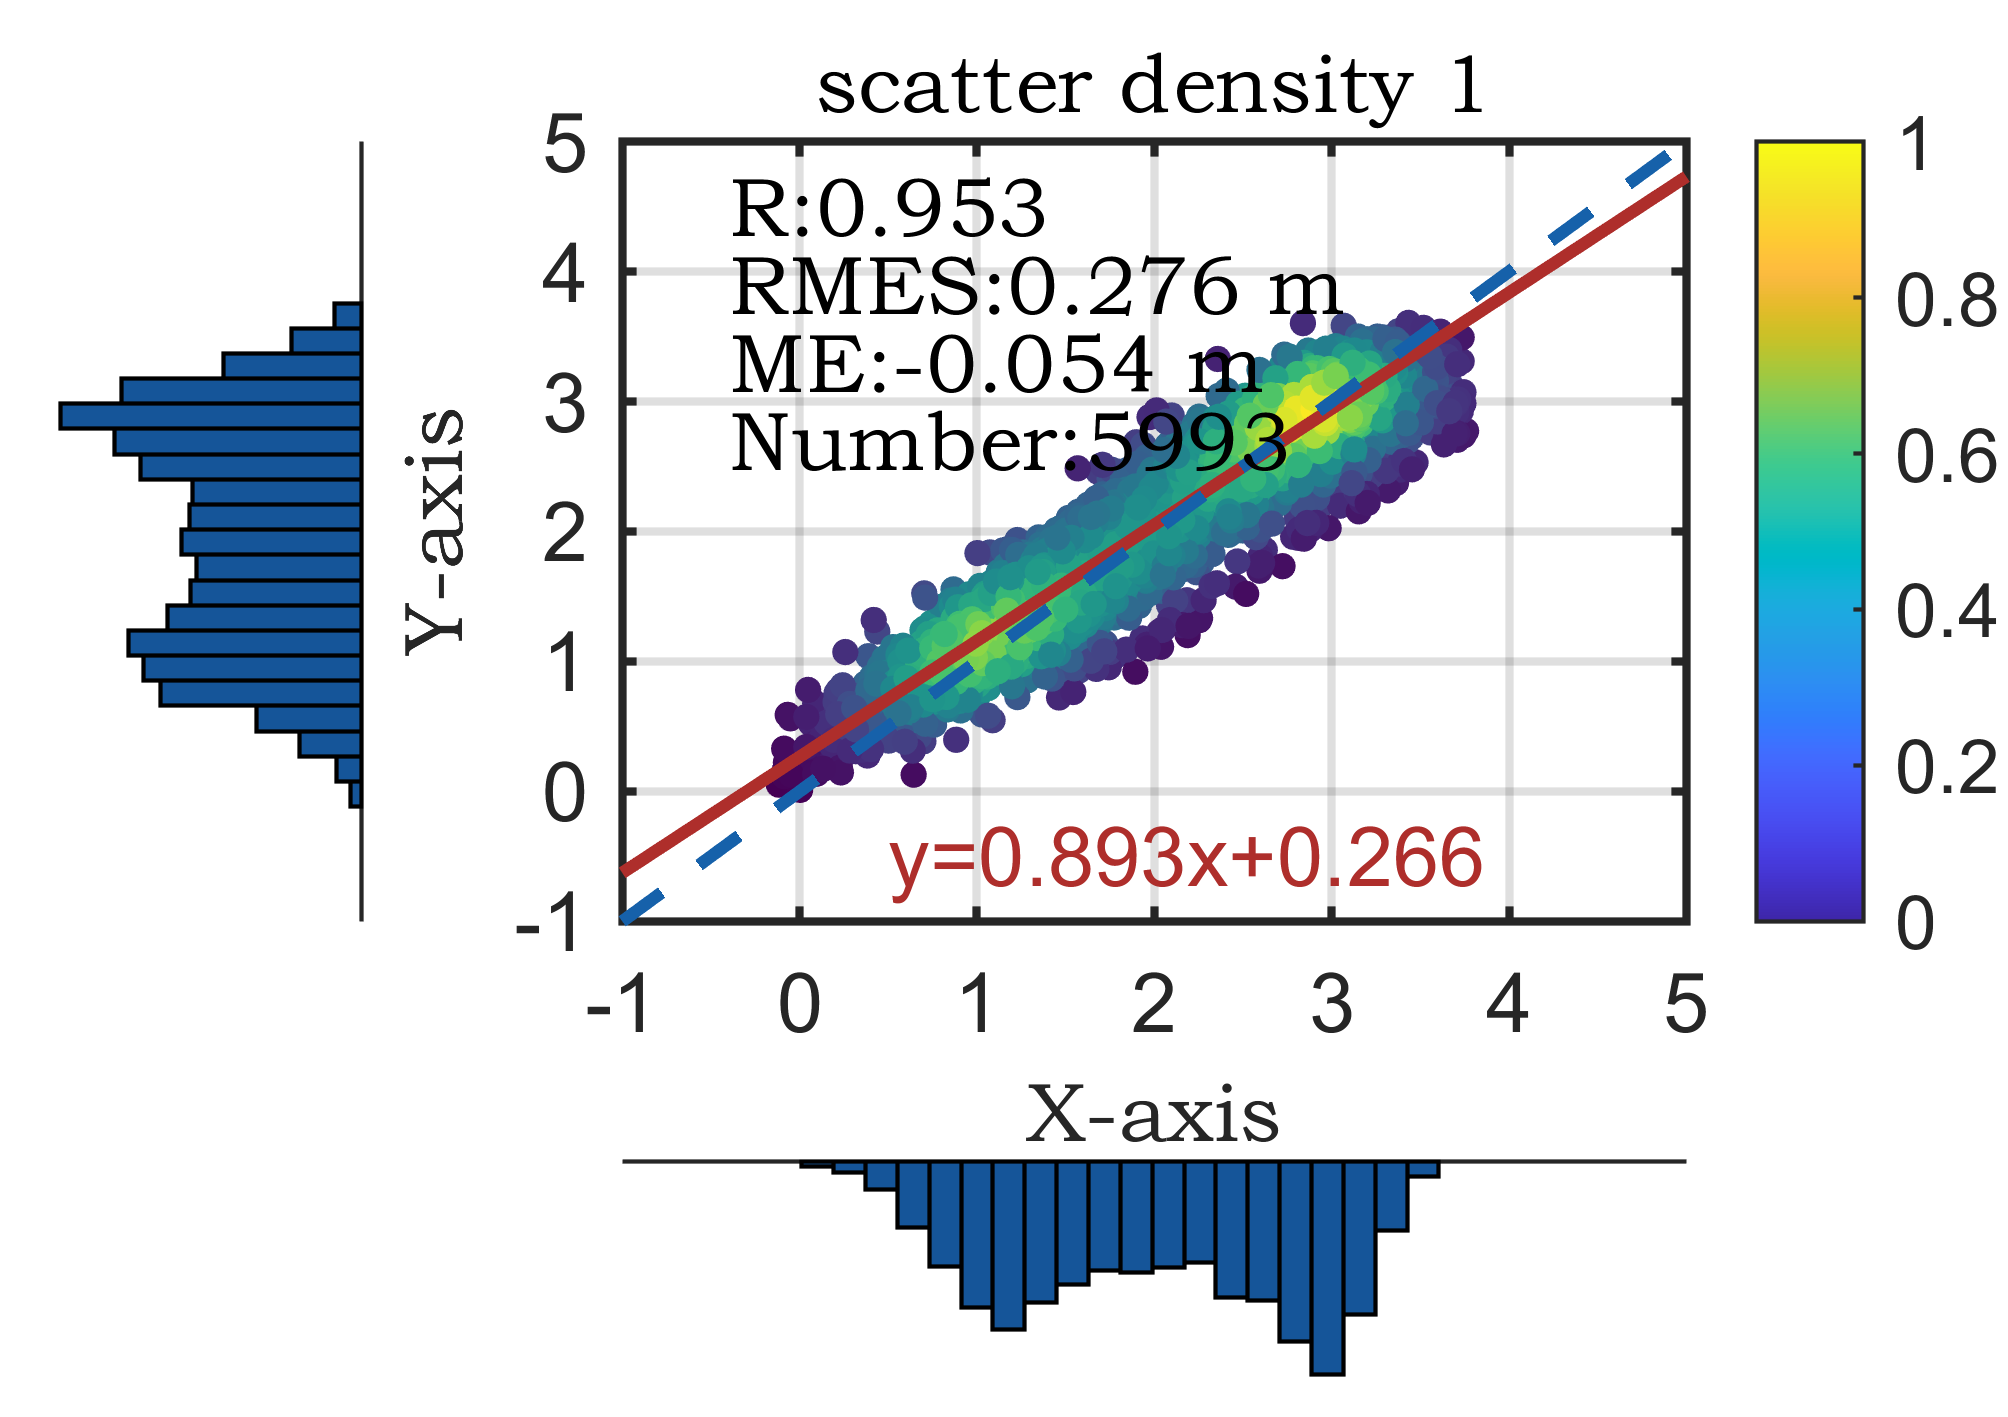
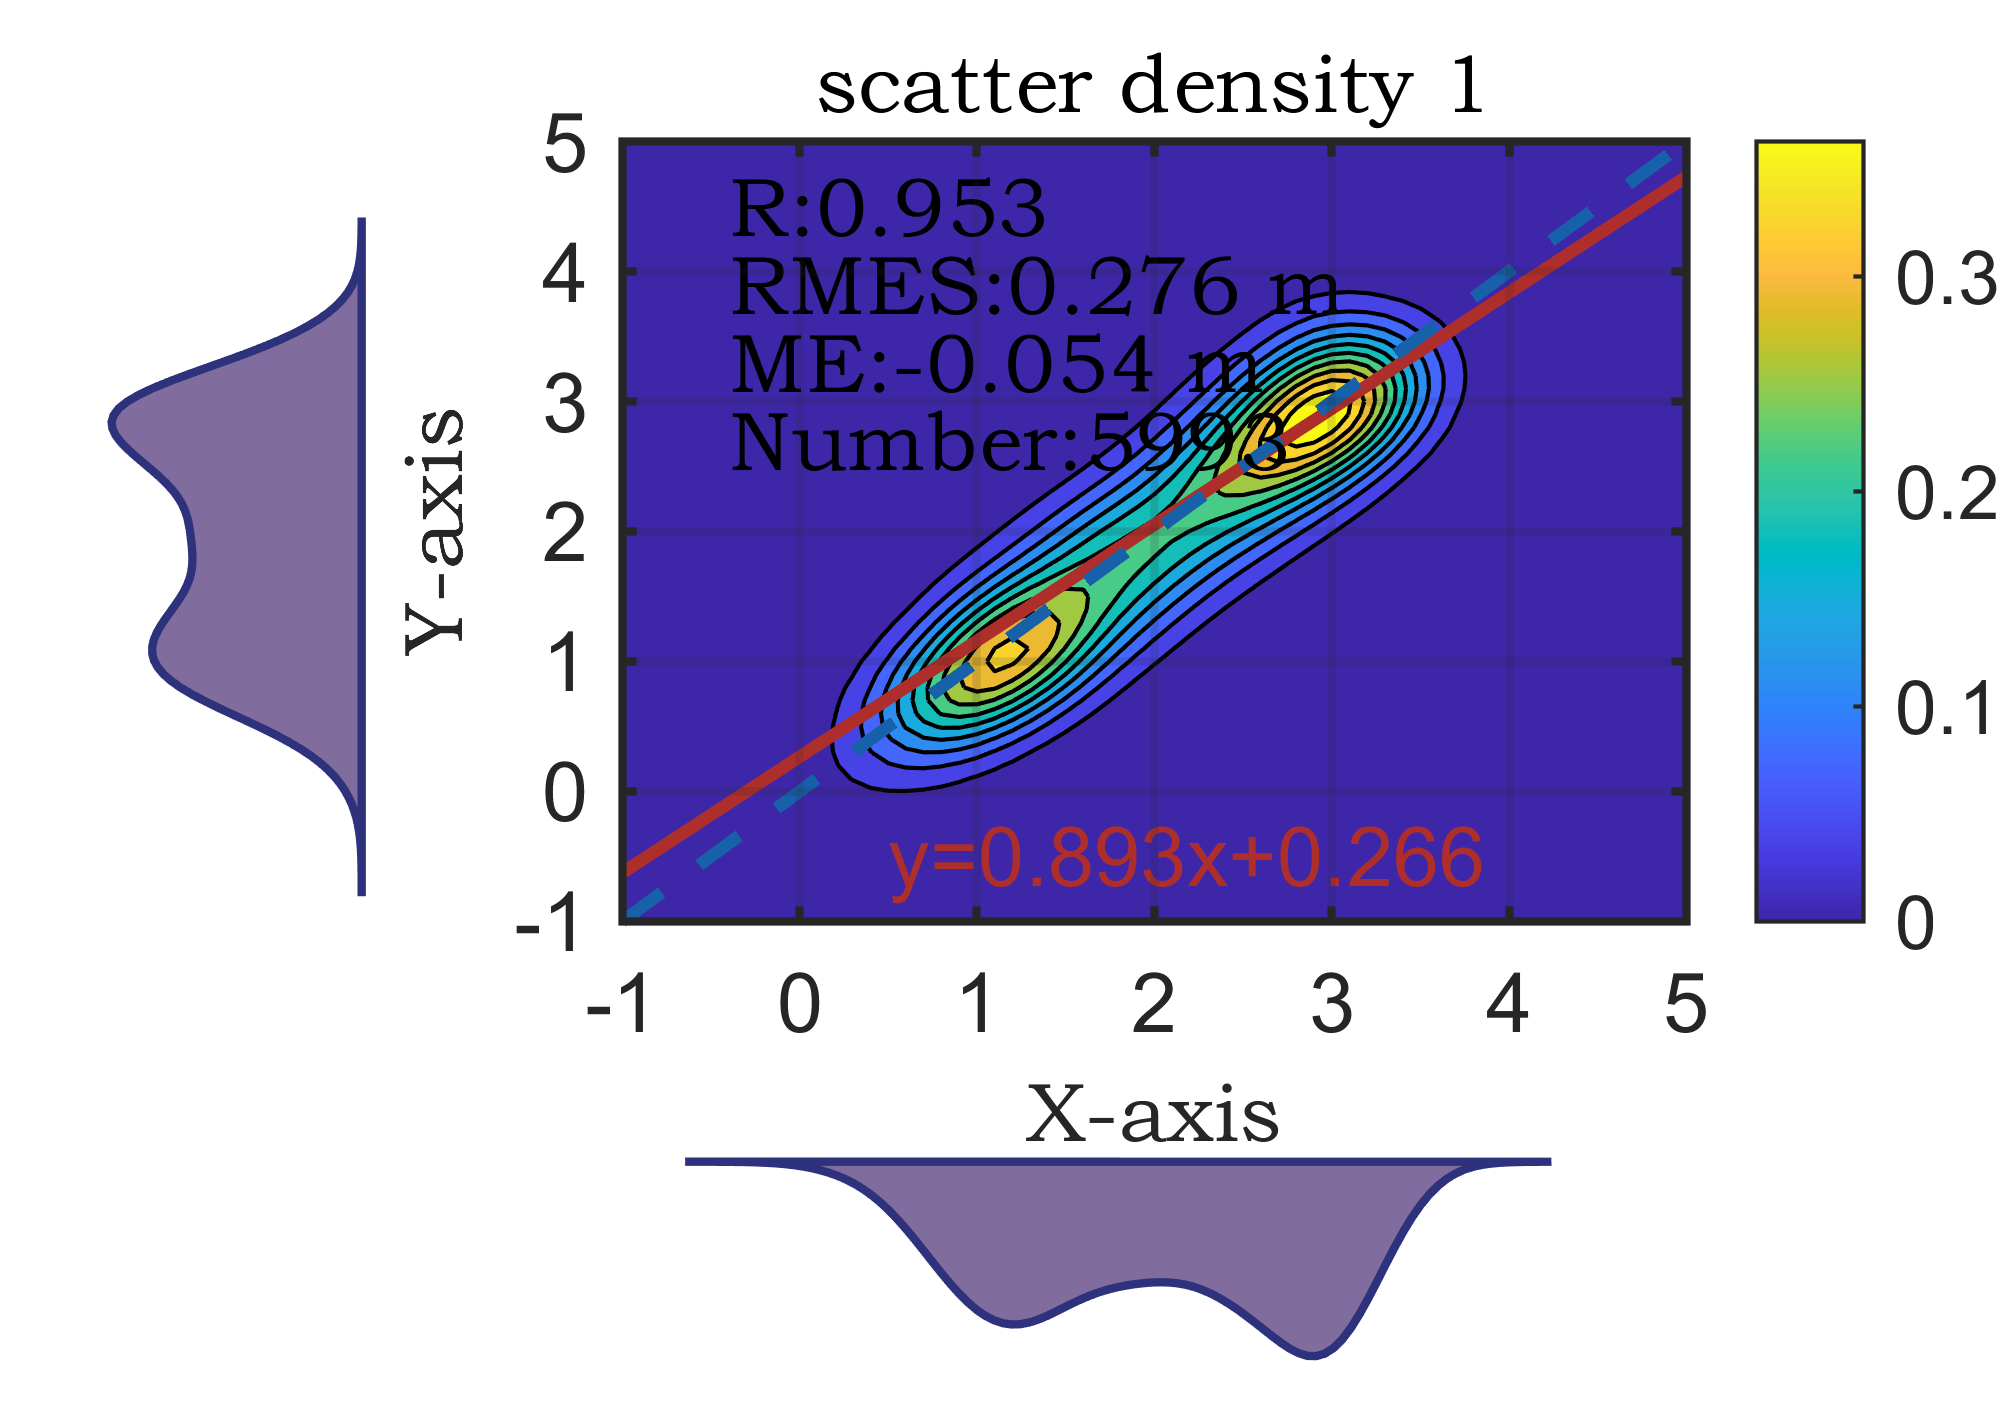
21 【MATLAB】科研绘图第二十一期散点密度双柱状图强化版
%% 表示散点分布的双柱状统计图%% Made by Lwcah (公众号:Lwcah)
%% 公众号:Lwcah
%% 知乎、B站、小红书、抖音同名账号:Lwcah,感谢关注~
%% 更多MATLAB+SCI绘图教程敬请观看~%% 清除变量
close all;clear all;clc;%% 1行1列
%% 一幅图的时候figureWidth = 8.5;figureHeight = 8;调整这两个参数就可以
%定义整幅图出现的在电脑屏幕上的位置以及长和宽
%这里有必要解释一下为什么figureWidth要设置为8.5;
%因详细解释需要很长的篇幅,请转公众号观看该天的文章。
figureHandle = figure;
figureUnits = 'centimeters';
figureWidth = 8.5;
figureHeight = 6;
set(gcf, 'Units', figureUnits, 'Position', [28 20 figureWidth figureHeight]);
% 注:28代表出图时图的左下角相对于整个电脑屏幕的左下角向左偏移28个单位,向上偏移20个单位。
% 可自行调节两个数字让图出在自己屏幕的某个位置%% 定义字体和字号大小
%% 通常的SCI一般Arial字体和10字号通用
fontnamed='华文中宋';  % 字号名字Arial
ssize=10;             % 字号大小
%% 如果是中文论文可以相应的更改字号名字如下
% '华文中宋' '华文仿宋' '华文宋体' '华文新魏' '华文楷体'
% '华文琥珀' '华文细黑' '华文行楷' '华文隶书' '宋体'
% '方正姚体' '微软雅黑' '方正舒体' '新宋体'
% '幼圆' '楷体' '等线' '隶书' '黑体'%% 给定绘图颜色
C1 = chinesecolors(150); % 靛青
C2 = chinesecolors(523); % 玫瑰灰
C3 = chinesecolors(343); % 香水玫瑰
C4 = chinesecolors(135); % 海涛蓝%% 数据
load x
load y%% 表示散点分布的双柱状统计图绘图subplot(2,2,2);
%% 绘图
res_CRMN                                           = [];
[res_CRMN,str_equation,str_C,str_RMSE,str_M,str_N]=plotcc_contourf(res_CRMN,x,y,C1,C2);% 用于存储反演的精度结果
% 是否添加X,Y轴标签
title('scatter density 1','fontsize',ssize,'FontName',fontnamed,'horiz','center');
ylabel('Y-axis','fontsize',ssize,'FontName',fontnamed);
xlabel('X-axis','fontsize',ssize,'FontName',fontnamed);
% text(-0.9,4.5,'(a)','fontsize',ssize,'FontName',fontnamed);
text(-0.4,4.5,str_C,'fontsize',ssize,'FontName',fontnamed);
text(-0.4,3.9,str_RMSE,'fontsize',ssize,'FontName',fontnamed);
text(-0.4,3.3,str_M,'fontsize',ssize,'FontName',fontnamed);
text(-0.4,2.7,str_N,'fontsize',ssize,'FontName',fontnamed);
axis on; h1 = gca;
hold on;box on;grid on;subplot(2,2,4);
[n1,ctr1] = hist(x,20);
bar(ctr1,-n1,1,'FaceColor',C4);%,'EdgeColor','none','FaceAlpha',0.7
axis off; h2 = gca;
h2.XLim=h1.XLim;
h2.XColor='none';
h2.YTickLabel='';
h2.TickDir='out';subplot(2,2,1);
[n2,ctr2] = hist(y,20);
barh(ctr2,-n2,1,'FaceColor',C4);%,'EdgeColor','none','FaceAlpha',0.7
axis off; h3 = gca;
h3.YLim=h1.YLim;
h3.YColor='none';
h3.XTickLabel='';
h3.TickDir='out';h1.Position = [0.31 0.35 0.53 0.55];
h2.Position = [0.31 0.03 0.53 0.15];
h3.Position = [0.03 0.35 0.15 0.55];%% 修图的标准格式代码
% text(0.5,0.9,'(a) XXX','fontsize',ssize,'FontName',fontnamed);%,'horiz','center'
% title('1000');
% xlabel('X-axis','fontsize',ssize,'FontName',fontnamed);
% ylabel('Y-axis','fontsize',ssize,'FontName',fontnamed);
% axis([0 10 0 7]);%XY轴的范围
% xticks([1 2 3 4 5 6 7 8 9 10]);%画格网的时候的小刻度
% xticklabels({'1','2','3','4','5','6','7','8','9','10'});%加x轴刻度标注
% yticks([1 2 3 4 5 6]);%画格网的时候的小刻度
% yticklabels({'1','2','3','4','5','6'});%加y轴刻度标注
set(gca,'linewidth',1,'fontsize',ssize,'FontName',fontnamed);
% set(gca,'yticklabel',[]);%y轴不显示
% set(gca,'xticklabel',[]);%x轴不显示
grid on;box on;hold on;%% 画legend
% hLegend1=legend('A1', 'A2', 'A3','Location', 'northeast','Box', 'off','Orientation','horizontal','fontsize',ssize,'FontName',fontnamed);
%方法一
% kk=legend('h1');
% set(kk,'location','NorthEast','Box', 'off','fontsize',ssize,'FontName',fontnamed);%'orientation','horizontal',
%方法二
% columnlegend(2,{'L1','L2','L3','L4','L5','L6'},'North');%表示一行放三个图例以及图例的位置%% Matlab中有许多位置可以选择:
% 'North' inside plot box near top
% 'South' inside bottom
% 'East' inside right
% 'West' inside left
% 'NorthEast' inside top right (default for 2-D plots)
% 'NorthWest' inside top left
% 'SouthEast' inside bottom right
% 'SouthWest' inside bottom left
% 'NorthOutside' outside plot box near top
% 'SouthOutside' outside bottom
% 'EastOutside' outside right
% 'WestOutside' outside left
% 'NorthEastOutside' outside top right (default for 3-D plots)
% 'NorthWestOutside' outside top left
% 'SouthEastOutside' outside bottom right
% 'SouthWestOutside' outside bottom left
% 'Best' least conflict with data in plot 与绘图中的数据冲突最小
% 'BestOutside' least unused space outside plot%% 背景颜色
set(gcf,'Color',[1 1 1]);
%% 设置完毕后,按照所需分辨率、格式输出
figW = figureWidth;
figH = figureHeight;
set(figureHandle,'PaperUnits',figureUnits);
set(figureHandle,'PaperPosition',[0 0 figW figH]);
fileout = 'demo1_scartter_double_bar';
print(figureHandle,[fileout,'.png'],'-r600','-dpng');
22 【MATLAB】科研绘图第二十二期三维瀑布图
%% Made by Lwcah(公众号:Lwcah)
%% 公众号:Lwcah
%% 知乎、B站、小红书、视频号、抖音同名账号:Lwcah,感谢关注~
%% 更多MATLAB+SCI绘图教程敬请观看~%% 绘制模板
close all;clear all;clc;%% 1行1列
%% 一幅图的时候figureWidth = 8.5;figureHeight = 8;调整这两个参数就可以
%定义整幅图出现的在电脑屏幕上的位置以及长和宽
%这里有必要解释一下为什么figureWidth要设置为8.5;
%因详细解释需要很长的篇幅,请转公众号观看该天的文章。
figureHandle = figure;
figureUnits = 'centimeters';
figureWidth = 15;
figureHeight = 9;
set(gcf, 'Units', figureUnits, 'Position', [28 10 figureWidth figureHeight]);
% 注:28代表出图时图的左下角相对于整个电脑屏幕的左下角向左偏移28个单位,向上偏移20个单位。
% 可自行调节两个数字让图出在自己屏幕的某个位置%% 定义字体和字号大小
%% 通常的SCI一般Arial字体和10字号通用
fontnamed='Arial';%字号名字
ssize=10;%字号大小
%% 如果是中文论文可以相应的更改字号名字如下
% '华文中宋' '华文仿宋' '华文宋体' '华文新魏' '华文楷体'
% '华文琥珀' '华文细黑' '华文行楷' '华文隶书' '宋体'
% '方正姚体' '微软雅黑' '方正舒体' '新宋体'
% '幼圆' '楷体' '等线' '隶书' '黑体'%% 一、信号分解并出图
% 加载数据
load data
x=data(:,1);
y=data(:,2);
% 展开信号分解
[imf,residual]=emd(y);
residual      = residual.*ones(size(y))';
modes         = [imf;residual];%% 构造XYZ数据集
% X轴应该为Imf代表的分量数
[m,n] = size(modes);% m为几个IMF分量;n为分量的数据长度。
X1    = (1:1:m)';
X2    = ones(size(modes));
X     = X1.*X2;
X     = X';
% Y轴应该为Imf代表的分量数据长度
Y1    = (1:1:n);
Y2    = ones(size(modes));
Y     = Y1.*Y2;
Y     = Y';
% Z轴呈现的为信号分解的数据(为了使画图更好看所以要调整顺序)
Z     = modes;
Z     = [modes(8,:);modes(7,:);modes(6,:);modes(5,:);modes(4,:);modes(3,:);modes(2,:);modes(1,:)];%% 绘图
plot3(X,Y,Z,'linewidth',1);
hTitle = title('Three-dimensional waterfall map');
hXLabel = xlabel('X');
hYLabel = ylabel('Y');
hZLabel = zlabel('Z');%% 画图的标准格式代码
% text(0.5,0.9,'(a) XXX','fontsize',ssize,'FontName',fontnamed);%,'horiz','center'
xlabel('X-axis','fontsize',ssize,'FontName',fontnamed);
ylabel('Y-axis','fontsize',ssize,'FontName',fontnamed);
zlabel('Z-axis','fontsize',ssize,'FontName',fontnamed);
% axis([0 7 0 0.7 50 250]);%XYZ轴的范围
% xticks([1 2 3 4 5 6]);%画格网的时候的小刻度
% xticklabels({'1','2','3','4','5','6'});%加x轴刻度标注
% yticks([0.1 0.2 0.3 0.4 0.5 0.6]);%画格网的时候的小刻度
% yticklabels({'0.1','0.2','0.3','0.4','0.5','0.6'});%加y轴刻度标注
% zticks([50 100 150 200 250]);%画格网的时候的小刻度
% zticklabels({'50','100','150','200','250'});%加z轴刻度标注
set(gca,'linewidth',1,'fontsize',ssize,'FontName',fontnamed);
% set(gca,'zticklabel',[]);%z轴不显示
% set(gca,'yticklabel',[]);%y轴不显示
% set(gca,'xticklabel',[]);%x轴不显示
grid on;box on;hold on;%% 画legend
%方法一
kk=legend('L8','L7','L6','L5','L4','L3','L2','L1');
set(kk,'location','NorthEast','Box', 'off','fontsize',ssize,'FontName',fontnamed);%'orientation','horizontal',
%方法二
% columnlegend(2,{'L1','L2','L3','L4','L5','L6'},'North');%表示一行放三个图例以及图例的位置
%% Matlab中有许多位置可以选择:
% 'North' inside plot box near top
% 'South' inside bottom
% 'East' inside right
% 'West' inside left
% 'NorthEast' inside top right (default for 2-D plots)
% 'NorthWest' inside top left
% 'SouthEast' inside bottom right
% 'SouthWest' inside bottom left
% 'NorthOutside' outside plot box near top
% 'SouthOutside' outside bottom
% 'EastOutside' outside right
% 'WestOutside' outside left
% 'NorthEastOutside' outside top right (default for 3-D plots)
% 'NorthWestOutside' outside top left
% 'SouthEastOutside' outside bottom right
% 'SouthWestOutside' outside bottom left
% 'Best' least conflict with data in plot 与绘图中的数据冲突最小
% 'BestOutside' least unused space outside plot%% 背景颜色
set(gcf,'Color',[1 1 1])
%% 设置完毕后,按照所需分辨率、格式输出
figW = figureWidth;
figH = figureHeight;
set(figureHandle,'PaperUnits',figureUnits);
set(figureHandle,'PaperPosition',[0 0 figW figH]);
fileout = '三维瀑布图';
print(figureHandle,[fileout,'.png'],'-r600','-dpng');%% 一幅图的时候figureWidth = 8.5;figureHeight = 8;调整这两个参数就可以
%定义整幅图出现的在电脑屏幕上的位置以及长和宽
%这里有必要解释一下为什么figureWidth要设置为8.5;
%因详细解释需要很长的篇幅,请转公众号观看2023-03-21的文章观看。
figureHandle = figure;
figureUnits  = 'centimeters';
figureWidth  = 8.5;
figureHeight = 14;
set(gcf, 'Units', figureUnits, 'Position', [20 12 figureWidth figureHeight]);
%% 展开信号分解
[imf,residual]=emd(y);
residual      = residual.*ones(size(y))';
modes         = [imf;residual];
%信号重构
d1           = modes(1,:);
d2           = modes(2,:);
d3           = modes(3,:);
d4           = modes(4,:);
d5           = modes(5,:);
d6           = modes(6,:);
d7           = modes(7,:);
d8           = modes(8,:);
% d9           = modes(9,:);
% d10          = modes(10,:);
%% 画图
subplot(9,1,1)
plot(x,y);
ylabel('原信号');hold on;
subplot(9,1,2)
plot(x,d1);
ylabel('d1');hold on;
subplot(9,1,3)
plot(x,d2);
ylabel('d2');hold on;
subplot(9,1,4)
plot(x,d3);
ylabel('d3');hold on;
subplot(9,1,5)
plot(x,d4);
ylabel('d4');hold on;
subplot(9,1,6)
plot(x,d5);
ylabel('d5');hold on;
subplot(9,1,7)
plot(x,d6);
ylabel('d6');hold on;
subplot(9,1,8)
plot(x,d7);
ylabel('d7');hold on;
subplot(9,1,9)
plot(x,d8);
ylabel('d8');hold on;
% subplot(11,1,10)
% plot(x,d9);
% ylabel('d9');hold on;
% subplot(11,1,11)
% plot(x,d10);
% ylabel('d10');hold on;
xlabel('X-axis');
%% 背景颜色
set(gcf,'Color',[1 1 1])
%% 图片输出
figW    = figureWidth;
figH    = figureHeight;
set(figureHandle,'PaperUnits',figureUnits);
set(figureHandle,'PaperPosition',[0 0 figW figH]);
fileout = '原始数据分解各分量';
print(figureHandle,[fileout,'.png'],'-r600','-dpng');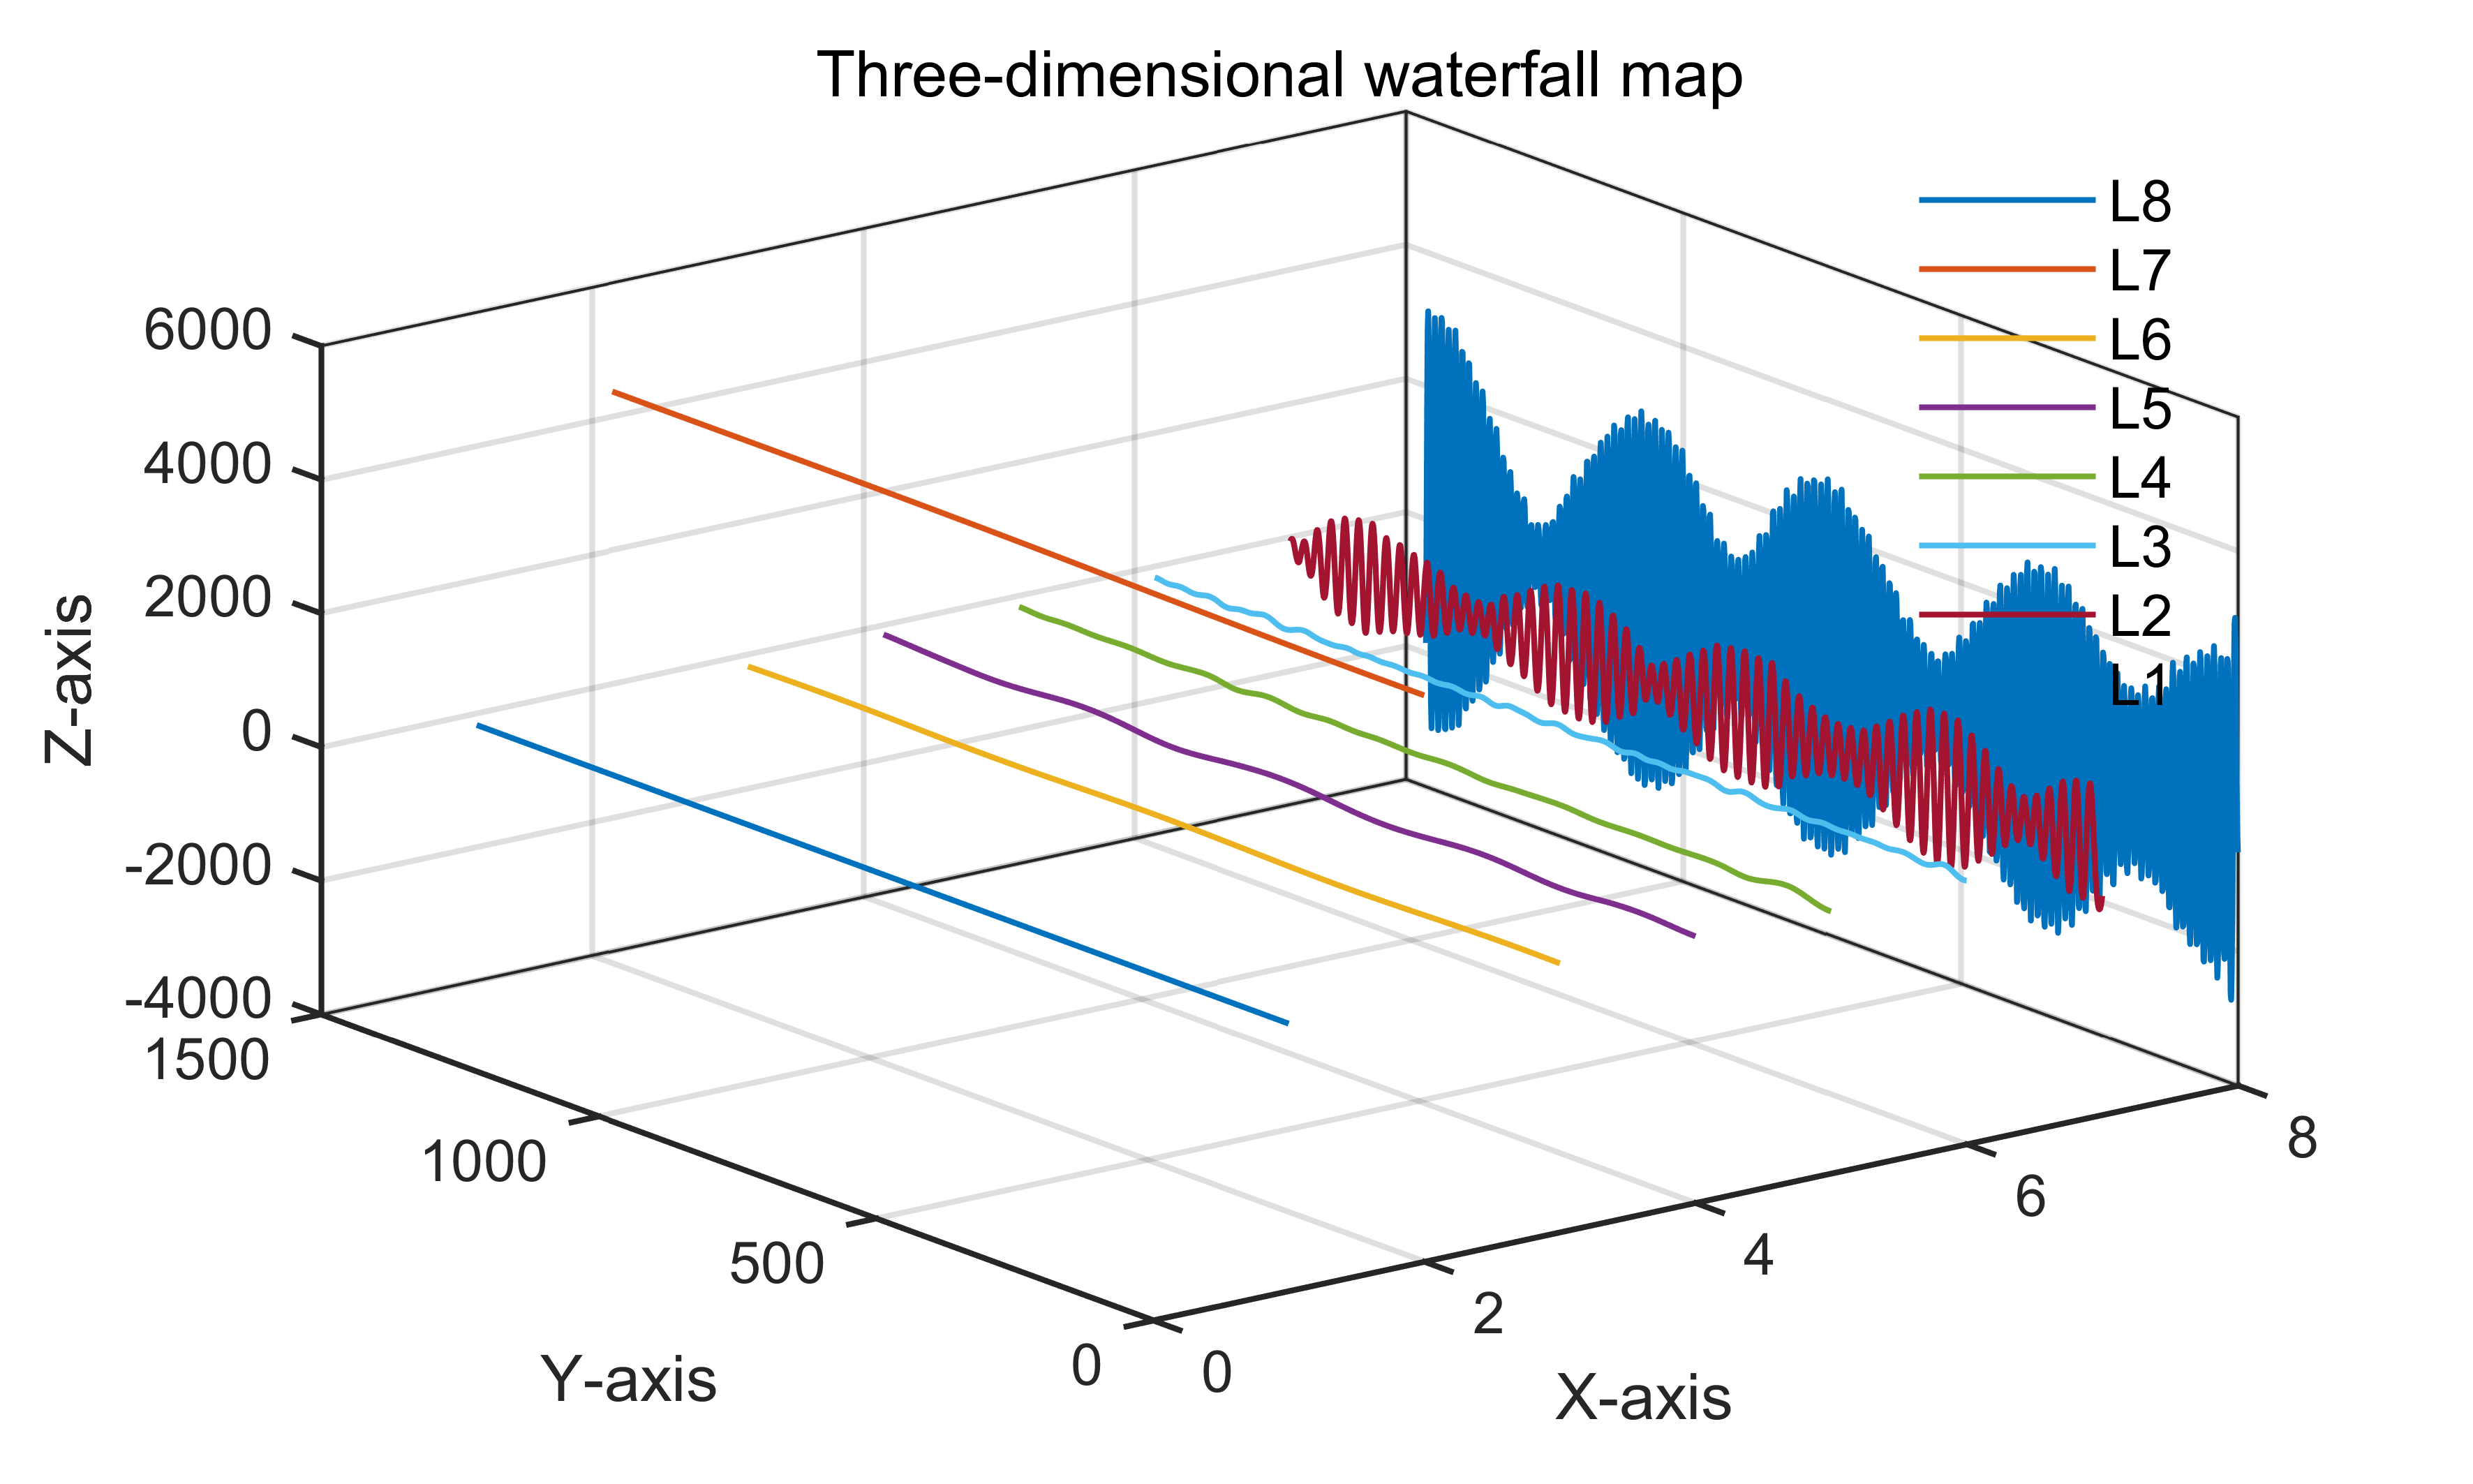

23 【MATLAB】科研绘图第二十三期箭头图
%% 箭头图
%% Made by Lwcah (公众号:Lwcah)
%% 公众号:Lwcah
%% 知乎、B站、小红书、抖音同名账号:Lwcah,感谢关注~
%% 更多MATLAB+SCI绘图教程敬请观看~%% 清除变量
close all;clear all;clc;%% 1行1列
%% 一幅图的时候figureWidth = 8.5;figureHeight = 8;调整这两个参数就可以
%定义整幅图出现的在电脑屏幕上的位置以及长和宽
%这里有必要解释一下为什么figureWidth要设置为8.5;
%因详细解释需要很长的篇幅,请转公众号观看该天的文章。
figureHandle = figure;
figureUnits = 'centimeters';
figureWidth = 8.5;
figureHeight = 6;
set(gcf, 'Units', figureUnits, 'Position', [28 20 figureWidth figureHeight]);
% 注:28代表出图时图的左下角相对于整个电脑屏幕的左下角向左偏移28个单位,向上偏移20个单位。
% 可自行调节两个数字让图出在自己屏幕的某个位置%% 定义字体和字号大小
%% 通常的SCI一般Arial字体和10字号通用
fontnamed='华文中宋';%字号名字Arial
ssize=10;%字号大小
%% 如果是中文论文可以相应的更改字号名字如下
% '华文中宋' '华文仿宋' '华文宋体' '华文新魏' '华文楷体'
% '华文琥珀' '华文细黑' '华文行楷' '华文隶书' '宋体'
% '方正姚体' '微软雅黑' '方正舒体' '新宋体'
% '幼圆' '楷体' '等线' '隶书' '黑体'%% 给定绘图颜色
C1 = chinesecolors(343);%香水玫瑰
C2 = chinesecolors(150);%靛青
C3 = chinesecolors(523);%玫瑰灰
% C4 = chinesecolors(17);%鹅冠红%% 加载数据
% 以MATLAB自带的北美上空气流的采样数据为例
% 向量 X 和 Y 表示每个箭头的起始点位置(经纬度),U 和 V 表示每个箭头的定向分量。
load('wind','x','y','u','v')
X = x(11:22,11:22,1);
Y = y(11:22,11:22,1);
U = u(11:22,11:22,1);
V = v(11:22,11:22,1);
quiver(X,Y,U,V)
% axis equal%% 修图的标准格式代码
% text(0.5,0.9,'(a) XXX','fontsize',ssize,'FontName',fontnamed);%,'horiz','center'
% title('1000');
xlabel('经度/°','fontsize',ssize,'FontName',fontnamed);
ylabel('纬度/°','fontsize',ssize,'FontName',fontnamed);
% axis([0 10 0 7]);%XY轴的范围
% xticks([1 2 3 4 5 6 7 8 9 10]);%画格网的时候的小刻度
% xticklabels({'1','2','3','4','5','6','7','8','9','10'});%加x轴刻度标注
% yticks([1 2 3 4 5 6]);%画格网的时候的小刻度
% yticklabels({'1','2','3','4','5','6'});%加y轴刻度标注
set(gca,'linewidth',1,'fontsize',ssize,'FontName',fontnamed);
% set(gca,'yticklabel',[]);%y轴不显示
% set(gca,'xticklabel',[]);%x轴不显示
grid on;box on;hold on;%% 画legend
% hLegend1=legend('A1', 'A2', 'A3','Location', 'northeast','Box', 'off','Orientation','horizontal','fontsize',ssize,'FontName',fontnamed);
%方法一
% kk=legend('h1');
% set(kk,'location','NorthEast','Box', 'off','fontsize',ssize,'FontName',fontnamed);%'orientation','horizontal',
%方法二
% columnlegend(2,{'L1','L2','L3','L4','L5','L6'},'North');%表示一行放三个图例以及图例的位置%% Matlab中有许多位置可以选择:
% 'North' inside plot box near top
% 'South' inside bottom
% 'East' inside right
% 'West' inside left
% 'NorthEast' inside top right (default for 2-D plots)
% 'NorthWest' inside top left
% 'SouthEast' inside bottom right
% 'SouthWest' inside bottom left
% 'NorthOutside' outside plot box near top
% 'SouthOutside' outside bottom
% 'EastOutside' outside right
% 'WestOutside' outside left
% 'NorthEastOutside' outside top right (default for 3-D plots)
% 'NorthWestOutside' outside top left
% 'SouthEastOutside' outside bottom right
% 'SouthWestOutside' outside bottom left
% 'Best' least conflict with data in plot 与绘图中的数据冲突最小
% 'BestOutside' least unused space outside plot%% 背景颜色
set(gcf,'Color',[1 1 1]);
%% 设置完毕后,按照所需分辨率、格式输出
figW = figureWidth;
figH = figureHeight;
set(figureHandle,'PaperUnits',figureUnits);
set(figureHandle,'PaperPosition',[0 0 figW figH]);
fileout = 'demo_quiver';
print(figureHandle,[fileout,'.png'],'-r600','-dpng');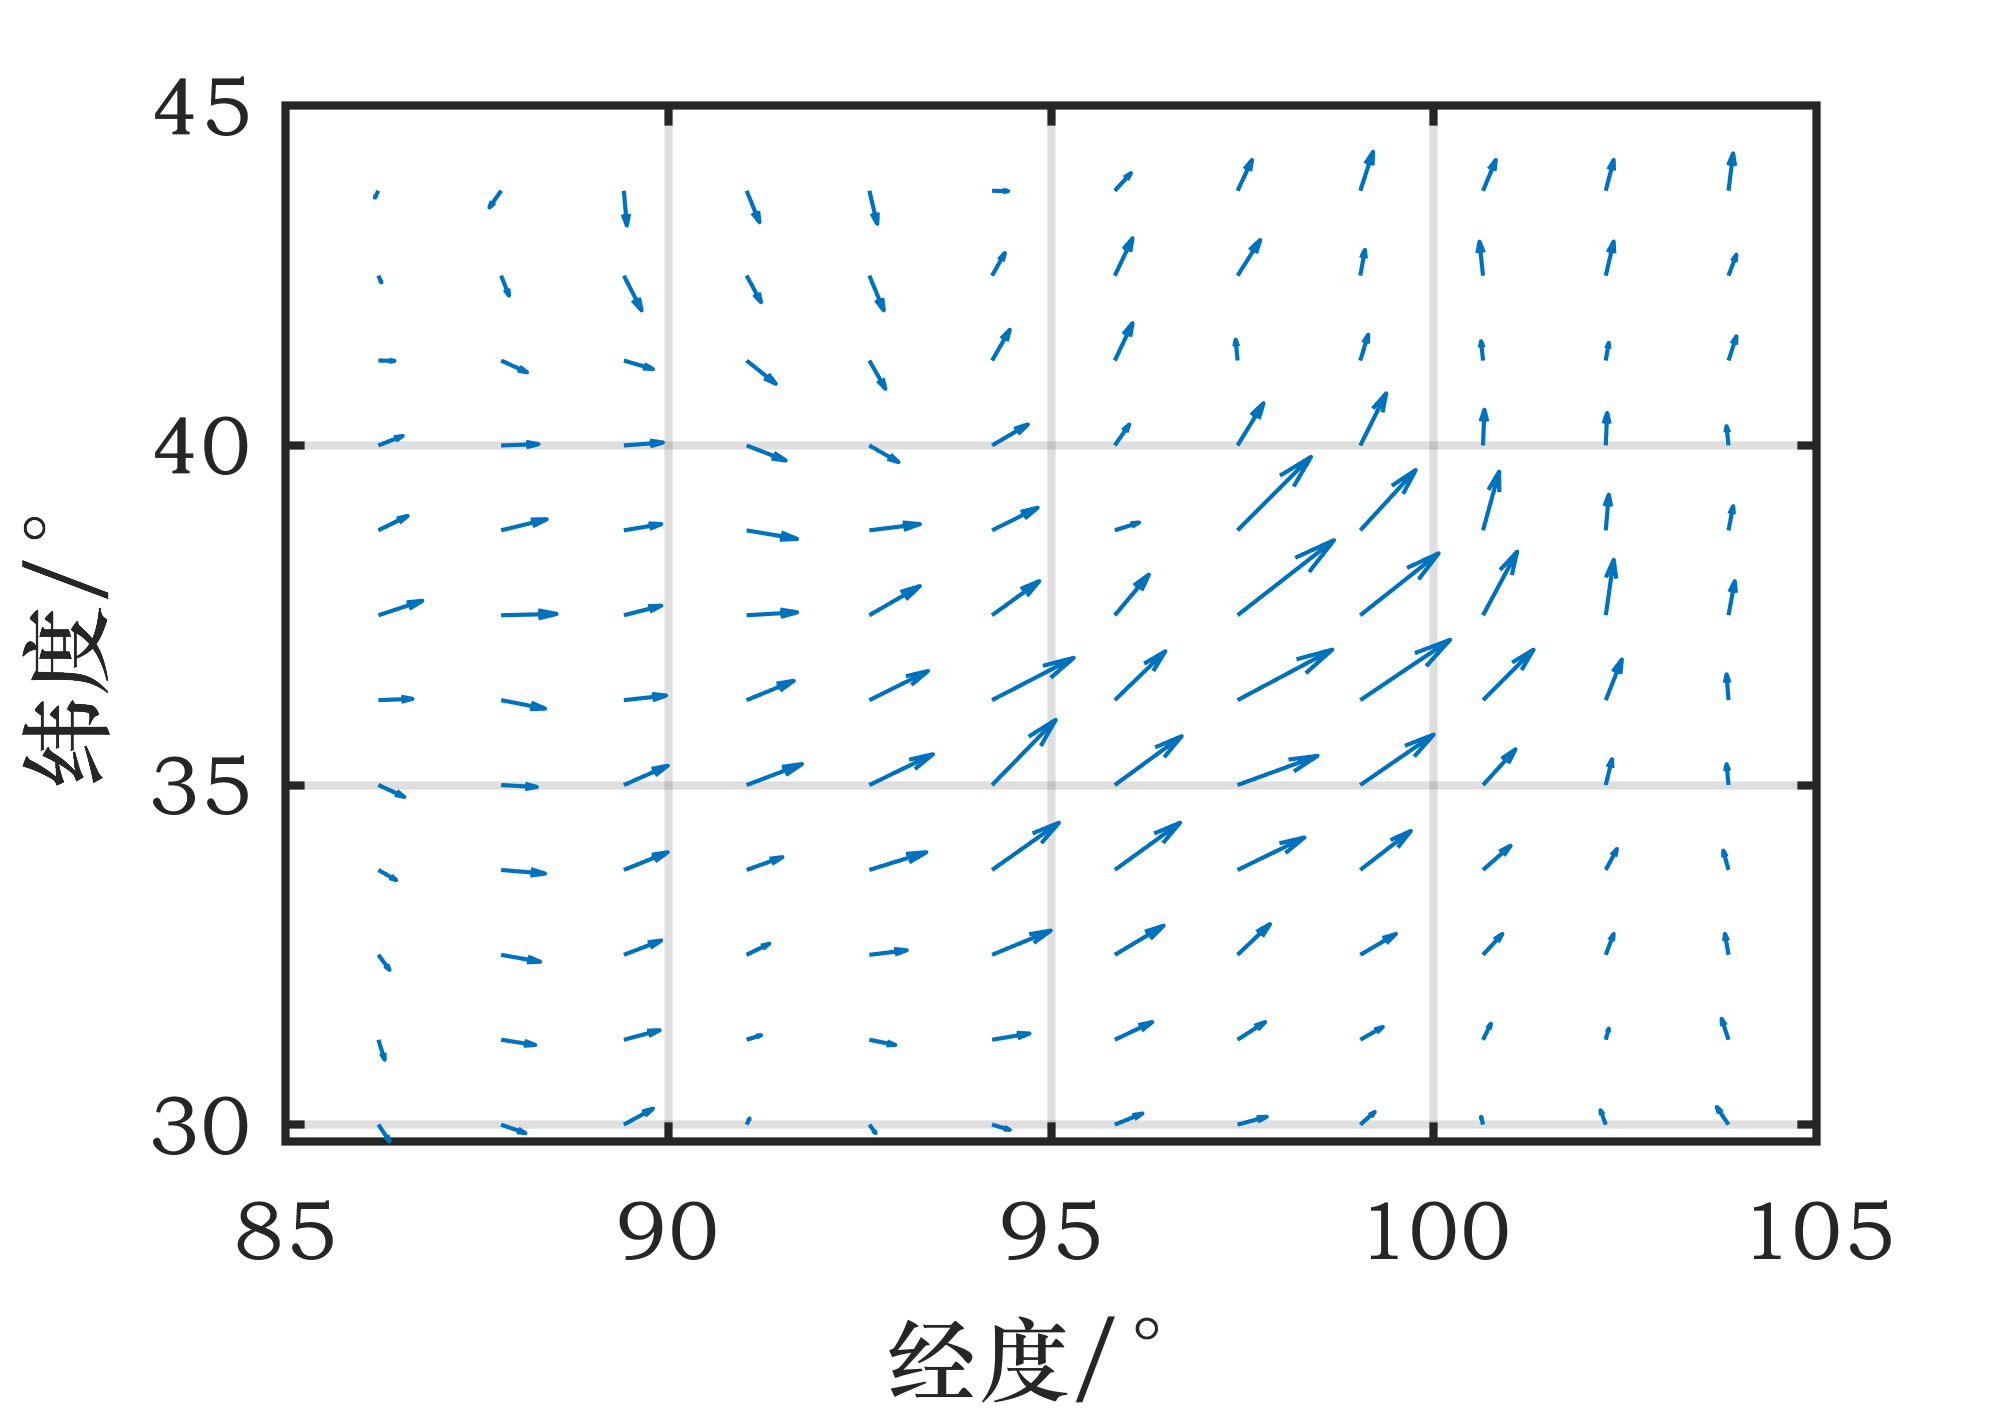
相关文章:
【MATLAB】全网入门快、免费获取、持续更新的科研绘图教程系列2
14 【MATLAB】科研绘图第十四期表示散点分布的双柱状双Y轴统计图 %% 表示散点分布的双柱状双Y轴统计图%% Made by Lwcah (公众号:Lwcah) %% 公众号:Lwcah %% 知乎、B站、小红书、抖音同名账号:Lwcah,感谢关注~ %% 更多…...

git与ssh多账户共存
git与ssh多账户共存 前言git多账户ssh多公钥参考 前言 在使用git与ssh时,经常会遇到多个账户共存的情况 例如使用不同的公钥登陆到不同的服务;使用不同的git信息进行commit git多账户 在默认情况下 git的信息存在 ~/.gitconfig 可以使用命令查看 git…...
BLE协议栈入门学习
蓝牙LE栈 物理层 频带 蓝牙LE在2400MHz到2483.5MHz范围内的2.4GHz免授权频段工作,该频段分为40个信道,每个信道间隔为2MHz。 时分 蓝牙LE是半双工的,可以发送和接收,但不能同时发送和接收,然而,所有的设…...

【反射】简述反射的构造方法,成员变量成员方法
🎊专栏【JavaSE】 🍔喜欢的诗句:更喜岷山千里雪 三军过后尽开颜。 🎆音乐分享【如愿】 🥰欢迎并且感谢大家指出我的问题 文章目录 🎄什么是反射🎄获取class对象的三种方式⭐代码实现 dz…...

acwing算法基础之数学知识--求卡特兰数
目录 1 基础知识2 模板3 工程化 1 基础知识 题目:给定n个0和n个1,它们将按照某种顺序排成长度为2n的序列,求它们能排成的所有序列中,能够满足任意前缀序列中0的个数都不少于1的个数的序列有多少个? 输出的答案对 1 0 …...
《洛谷深入浅出基础篇》P4017最大食物链————拓扑排序
上链接:P4017 最大食物链计数 - 洛谷 | 计算机科学教育新生态 (luogu.com.cn)https://www.luogu.com.cn/problem/P4017 上题干: 题目背景 你知道食物链吗?Delia 生物考试的时候,数食物链条数的题目全都错了,因为她总是…...
设置定时自动请求测试_自动定时循环发送http_post请求---postman工作笔记001
其实就是创建接口文件夹的时候,有个monitor collection 用来监听接口执行情况,这里就可以设置 可以看到多久执行一次对吧,这里可以设置每几分钟执行一次,一共执行多少次等等 但是这里要说明一下,如果需要使用monitor功能,必须需要登录, 所以如果这里点击monitor collection…...

Vue3封装全局插件
定义一个全局加载组件 一、首先定义dom元素 定义一个index.vue文件 <template><div class"loading">loading...</div> </template> <script setup lang"ts"></script> <style scoped> .loading {display: fl…...

【Python 训练营】N_6 求素数
题目 判断101-200之间有多少个素数,并输出所有素数。 分析 判断素数的方法:用一个数分别去除2到sqrt(这个数),如果能被整除,则表明此数不是素数,反之是素数。 答案 h 0 leap 1 from math import sqrt from sys …...
【图论】关键路径求法c++
代码结构如下图: 其中topologicalSort(float**, int, int*, bool*, int, int)用来递归求解拓扑排序,topologicalSort(float**, int*&, int, int, int)传参图的邻接矩阵mat与结点个数n,与一个引用变量数组topo,返回一个布尔值…...
基于51单片机电子钟万年历LCD1602显示
51单片机的电子钟万年历LCD1602显示 🔴 🔵51单片机的电子钟万年历LCD1602显示🔴 🔵主要功能:🔴 🔵讲解视频🔴 🔵仿真图:🔴 🔵程序&…...
时间复杂度和运算
时间复杂度 在算法和数据结构中,有许多时间复杂度比 O(1) 更差的情况。以下是一些常见的时间复杂度,按照从最优到最差的顺序排列: O(1): 常数时间复杂度,操作的运行时间与输入规模无关,是最理想的情况。 O…...

深入Tailwind CSS中的文本样式
深入Tailwind CSS中的文本样式 样式文本是网页设计的一个基本组成部分,而 Tailwind CSS 提供了范围广泛的实用类,使文本样式设计既高效又有效。 在本本中,我们将探索文本样式的常见最佳实践,讨论潜在的陷阱,并推荐设计方法。我们…...
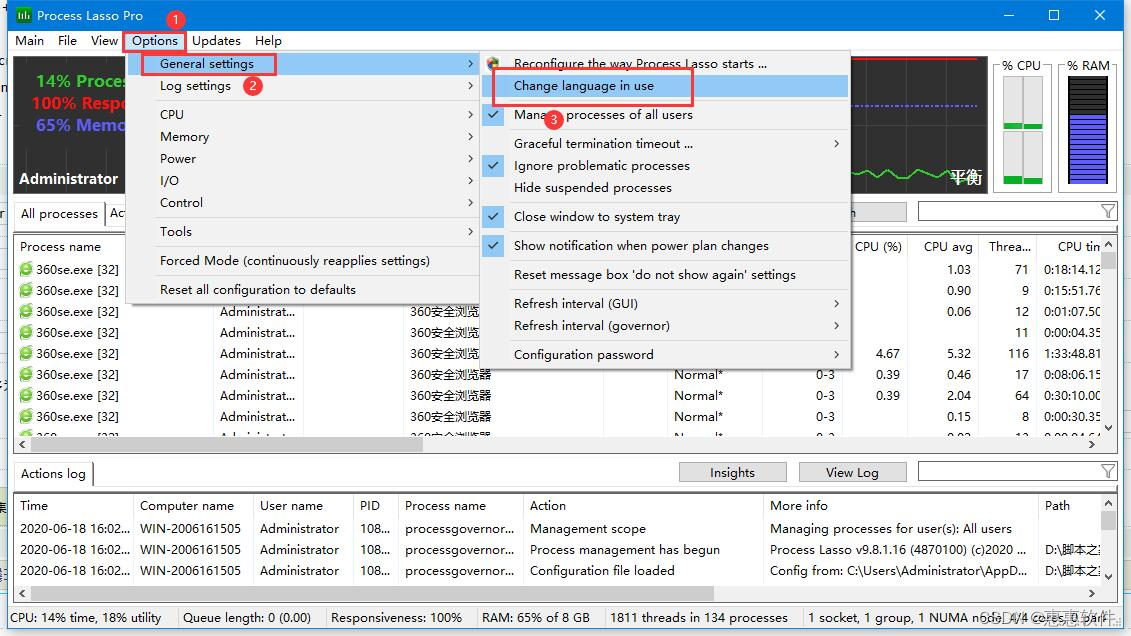
系统优化软件Bitsum Process Lasso Pro v12.4,供大家学习研究参考
1、自动或手动调整进程优先级;将不需要抑制的进程添加到排除列表; 2、设置动态提升前台运行的进程/线程的优先级 3、设置进程黑名单,禁止无用进程(机制为启动即结束,而非拦截其启动)。 4、优化I/O优先级以及电源模式自动化。 5、ProBalance功能。翻译成中文是“进程平衡…...

敏捷DevOps专家王立杰:端到端DevOps持续交付的5P法则 | IDCF
今天有一个流行的英文缩写词用来刻画这个风云变幻的时代:VUCA(乌卡时代)。四个英文字母分别表示动荡性(Volatility)、不确定性(Uncertainty)、复杂性(Complexity)和模糊性…...

分布式锁详解
文章目录 分布式锁1. [传统锁回顾](https://blog.csdn.net/qq_45525848/article/details/134608044?csdn_share_tail%7B%22type%22:%22blog%22,%22rType%22:%22article%22,%22rId%22:%22134608044%22,%22source%22:%22qq_45525848%22%7D)1.1. 从减库存聊起1.2. 环境准备1.3. 简…...
——算术运算符)
Python入门学习篇(二)——算术运算符
1 算术运算符 1.1 分类 类型含义示例注意事项加号12➡3“12”“3"➡"123”数值之间,是加法运算(True为1,False为0)字符串之间,是进行拼接数值和字符串之间是不可以使用加法运算的,会报错-减号1-2➡-1*乘号2*3➡6/除法2/1➡2.0除法的结果永远为小数%取余10%2➡0//取…...

微软发布最新.NET 8长期支持版本,云计算、AI应用支持再强化
11 月 15 日开始的为期三天的 .NET Conf 在线活动的开幕日上,.NET 8作为微软的开源跨平台开发平台正式发布。.NET 团队着重强调云、性能、全栈 Blazor、AI 和 .NET MAUI 是.NET 8的主要亮点。.NET团队在 .NET Conf 2023 [1]活动开幕式上表示:“通过这个版…...
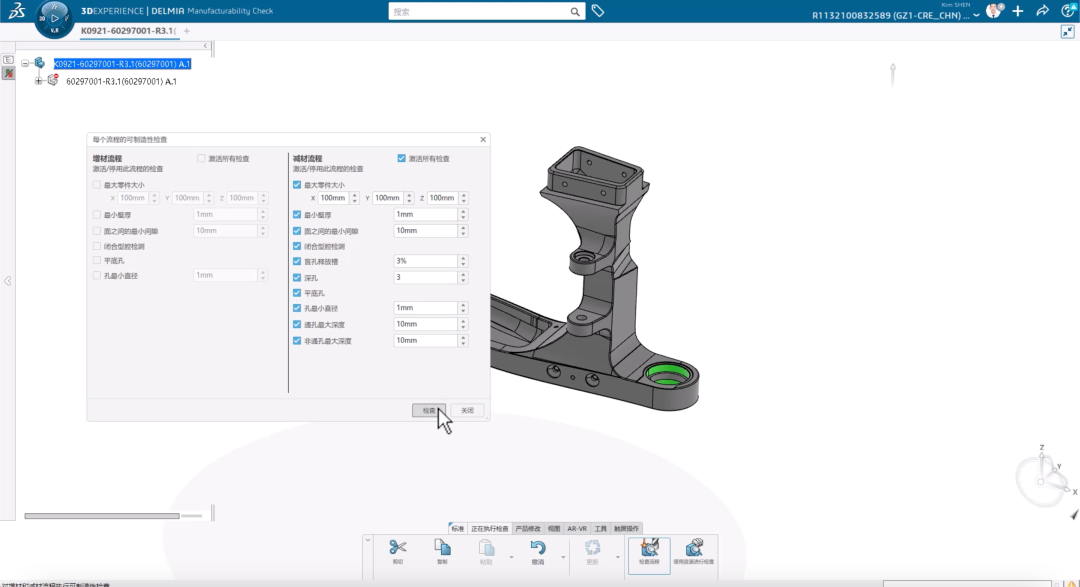
达索系统3DEXPERIENCE WORKS 2024 Fabrication新功能
当发现产品的制造环节,以及因产品模型本身的设计而导致制造环节存在不合理性,从而导致加工制造成本增加。 快速判断,轻松协作 在达索系统3DEXPERIENCE WORKS 2024中我们可以快速的判断产品的可制造性,以及快速与前端设计沟通协作…...

Web3与Web3.0: Web3指的是去中心化和基于区块链的网络,Web3.0指的是链接或语义网络。
目录 Web3与Web3.0: Web3指的是去中心化和基于区块链的网络 Web3.0指的是链接或语义网络。...

损失函数大全:从 MSE 到 Focal Loss,到底该用哪个?
💻 完整代码 对比实验: GitHub 仓库 📖 配套教程: CSDN 专栏 如果觉得有用,欢迎 ⭐ Star 支持! 🎯 为什么损失函数这么重要? 大白话: 损失函数就是告诉模型"你错得…...

2026AI搜索优化必看:这几款GEO监测工具亲测有效
背景随着生成式AI的普及,AI搜索正在成为用户获取信息的主要渠道之一。传统的SEO已经无法满足品牌在AI时代的曝光需求。AI搜索优化(GEO,Generative Engine Optimization)应运而生。从2026年1月到4月,我们团队对市面上主…...

IndexMap排序方法大全:stable、unstable和并行排序对比
IndexMap排序方法大全:stable、unstable和并行排序对比 【免费下载链接】indexmap A hash table with consistent order and fast iteration; access items by key or sequence index 项目地址: https://gitcode.com/gh_mirrors/in/indexmap IndexMap是一个兼…...

3步解决Void编辑器构建时的依赖地狱:从报错到编译通过的实战指南
3步解决Void编辑器构建时的依赖地狱:从报错到编译通过的实战指南 【免费下载链接】void 开源AI代码编辑器,Cursor的替代方案。 项目地址: https://gitcode.com/GitHub_Trending/void2/void Void作为开源AI代码编辑器的新星,为开发者提…...

Linux 的 shuf 命令
Linux 的 shuf 命令是一个用于生成随机排列的实用工具,它可以从输入文件中随机排列行内容,或生成随机数序列。这个命令是 GNU coreutils 包的一部分,通常预装在大多数 Linux 发行版中。 基本语法:shuf [选项]... [文件] 常用选项…...

基于熵分析与强化学习的RTL代码生成技术解析
1. 项目概述在数字电路设计领域,寄存器传输级(RTL)代码是连接高层次设计意图与可综合逻辑的关键桥梁。传统RTL编写需要工程师具备深厚的硬件描述语言(如Verilog)功底和时序逻辑设计经验,这导致硬件设计存在…...
)
Swagger接口文档除了在线看,还能怎么用?我整理了3种本地化导出方案(含Word/Excel)
Swagger接口文档的本地化应用:3种高效导出方案深度解析 在API开发领域,Swagger已经成为事实上的接口文档标准。但很多团队仅仅将其作为在线参考工具,却忽视了这些结构化数据的更大价值。想象一下:当客户要求提供完整的接口规范作为…...
 函数搞定子串验证(附两种方法对比))
C++ 字符串匹配实战:手把手教你用 find() 函数搞定子串验证(附两种方法对比)
C 字符串匹配实战:从基础到进阶的双重解法剖析 在编程竞赛和日常开发中,字符串处理是最基础却最常被考察的技能之一。想象这样一个场景:你需要快速判断用户输入的搜索关键词是否包含在商品数据库中,或者需要验证一段DNA序列是否包…...
【技术解析】Informer:突破Transformer瓶颈,重塑长时序预测的深度学习新范式
1. 长时序预测的挑战与Transformer的瓶颈 想象一下你正在处理电力负荷预测任务,需要根据过去三年的用电记录预测未来一个月的需求。传统方法可能直接截取最近几周数据来训练模型,但这样会丢失季节性、节假日等长期规律。Transformer模型原本是处理这类长…...

告别U盘裸奔!用Win11的BitLocker给移动硬盘加密,出差旅行更安心
商务人士必备:用BitLocker为移动硬盘打造安全数据堡垒 在机场咖啡厅打开笔记本电脑处理文件时,你是否担心过邻座的目光可能窥见屏幕上的商业机密?摄影师带着存满客户作品的移动硬盘辗转各地,是否忧虑过设备遗失导致未发布作品外泄…...