prometheus|云原生|kubernetes内部安装prometheus
架构说明:
prometheus是云原生系统内的事实上的监控标准,而kubernetes集群内部自然还是需要就地取材的部署prometheus服务了
那么,prometheus-server部署的方式其实是非常多的,比如,kubesphere集成方式,helm包方式,yaml文件清单方式,all in one 方式,在本例中,选择使用yaml文件清单方式
部署前需要考虑一个问题,那就是prometheus-server的时序数据库的数据存储问题,在本例中使用的是本地目录挂载方式,也就是host本地挂载,挂载目录 /data
kubernetes集群的版本如下(1.23.16版本,3master,1个工作节点,部署方式为kubekey):
[root@node4 yaml]# k get no -owide
NAME    STATUS   ROLES                  AGE   VERSION    INTERNAL-IP      EXTERNAL-IP   OS-IMAGE                KERNEL-VERSION           CONTAINER-RUNTIME
node1   Ready    control-plane,master   10d   v1.23.16   192.168.123.11   <none>        CentOS Linux 7 (Core)   3.10.0-1062.el7.x86_64   docker://20.10.8
node2   Ready    control-plane,master   10d   v1.23.16   192.168.123.12   <none>        CentOS Linux 7 (Core)   3.10.0-1062.el7.x86_64   docker://20.10.8
node3   Ready    control-plane,master   10d   v1.23.16   192.168.123.13   <none>        CentOS Linux 7 (Core)   3.10.0-1062.el7.x86_64   docker://20.10.8
node4   Ready    worker                 10d   v1.23.16   192.168.123.14   <none>        CentOS Linux 7 (Core)   3.10.0-1062.el7.x86_64   docker://20.10.8
prometheus-server的版本为(v2.2.1):
[root@node4 yaml]# k get deployments.apps -n monitor-sa -owide
NAME                READY   UP-TO-DATE   AVAILABLE   AGE   CONTAINERS   IMAGES                   SELECTOR
prometheus-server   2/2     2            2           9d    prometheus   prom/prometheus:v2.2.1   app=prometheus,component=server
grafana的版本为(rpm 方式安装的9.4.3):
[root@node4 yaml]# rpm -qa |grep grafana
grafana-enterprise-9.4.3-1.x86_64
node-exporter的版本为(v0.16,damonsets控制器):
[root@node4 yaml]# k get ds -n monitor-sa -owide
NAME            DESIRED   CURRENT   READY   UP-TO-DATE   AVAILABLE   NODE SELECTOR   AGE   CONTAINERS      IMAGES                       SELECTOR
node-exporter   4         4         4       4            4           <none>          10d   node-exporter   prom/node-exporter:v0.16.0   name=node-exporter
部署成功的pod状态如下:
[root@node4 yaml]# k get po -n monitor-sa
NAME                                READY   STATUS    RESTARTS      AGE
node-exporter-6ttbl                 1/1     Running   1 (77m ago)   10d
node-exporter-7ls5t                 1/1     Running   1 (76m ago)   10d
node-exporter-r287q                 1/1     Running   3 (77m ago)   10d
node-exporter-z85dm                 1/1     Running   1 (77m ago)   10d
prometheus-server-fb59774d6-bgmn7   1/1     Running   0             62m
prometheus-server-fb59774d6-wrq27   1/1     Running   0             62m
下面就如何在kubernetes内 部署一个prometheus做一个介绍
一,
node-exporter的部署
这里需要说明一下,node-exporter是做数据收集工作的,因此,如何收集数据,哪些数据需要收集,哪些数据需要舍弃这些是应该考虑的,虽然exporter只是收集数据,数据并不主动推送到prometheus,而是由prometheus自己来抓取,因此,无需配置存储,但如果node-exporter什么数据都收集,那毫无疑问的,对prometheus会是一种负担。
本例中相关配置是(表示磁盘挂载点的信息不收集):
- --collector.filesystem.ignored-mount-points
- '"^/(sys|proc|dev|host|etc)($|/)"'
prometheus的优化部分,根据以下内容配置
--collector.arp 启用 arp 收集器(默认值:启用)。
--collector.bcache 启用 bcache 收集器(默认值:启用)。
--collector.bonding 启用绑定收集器(默认值:启用)。
--collector.btrfs 启用 btrfs 收集器(默认值:启用)。
--collector.buddyinfo 启用 buddyinfo 收集器(默认值:禁用)。
--collector.conntrack 启用 conntrack 收集器(默认值:启用)。
--collector.cpu 启用 CPU 收集器(默认值:启用)。
--collector.cpufreq 启用 cpufreq 收集器(默认值:启用)。
--collector.diskstats 启用 diskstats 收集器(默认值:启用)。
--collector.drbd 启用 drbd 收集器(默认值:禁用)。
--collector.edac 启用 edac 收集器(默认值:启用)。
--collector.entropy 启用熵收集器(默认值:启用)。
--collector.ethtool 启用 ethtool 收集器(默认值:禁用)。
--collector.fiberchannel 启用光纤通道收集器(默认值:启用)。
--collector.filefd 启用 filefd 收集器(默认值:启用)。
--collector.filesystem 启用文件系统收集器(默认值:启用)。
--collector.hwmon 启用 hwmon 收集器(默认值:启用)。
--collector.infiniband 启用 infiniband 收集器(默认值:启用)。
--collector.interrupts 启用中断收集器(默认值:禁用)。
--collector.ipvs 启用 ipvs 收集器(默认值:启用)。
--collector.ksmd 启用 ksmd 收集器(默认值:禁用)。
--collector.loadavg 启用 loadavg 收集器(默认值:启用)。
--collector.logind 启用登录收集器(默认值:禁用)。
--collector.mdadm 启用 mdadm 收集器(默认值:启用)。
--collector.meminfo 启用 meminfo 收集器(默认值:启用)。
--collector.meminfo_numa 启用 meminfo_numa 收集器(默认值:禁用)。
--collector.mountstats 启用 mountstats 收集器(默认值:禁用)。
--collector.netclass 启用网络类收集器(默认:启用)。
--collector.netdev 启用 netdev 收集器(默认值:启用)。
--collector.netstat 启用 netstat 收集器(默认值:启用)。
--collector.network_route 启用 network_route 收集器(默认值:禁用)。
--collector.nfs 启用 nfs 收集器(默认值:启用)。 --collector.nfsd 启用 nfsd 收集器(默认值:启用)。
--collector.ntp 启用 ntp 收集器(默认值:禁用)。 --collector.nvme 启用 nvme 收集器(默认值:启用)。
--collector.perf 启用性能收集器(默认值:禁用)。 --collector.powersupplyclass 启用 powersupplyclass 收集器(默认值:启用)。
--collector.pressure 启用压力收集器(默认值:启用)。 --collector.processes 启用进程收集器(默认值:禁用)。
--collector.qdisc 启用 qdisc 收集器(默认值:禁用)。 --collector.rapl 启用 rapl 收集器(默认值:启用)。
--collector.runit 启用 runit 收集器(默认值:禁用)。 --collector.schedstat 启用 schedstat 收集器(默认值:启用)。
--collector.sockstat 启用 sockstat 收集器(默认值:启用)。 --collector.softnet 启用软网络收集器(默认值:启用)。
--collector.stat 启用统计收集器(默认值:启用)。 --collector.supervisord 启用 supervisord 收集器(默认值:禁用)。
--collector.systemd 启用 systemd 收集器(默认值:禁用)。 --collector.tapestats 启用tapestats 收集器(默认值:启用)。
--collector.tcpstat 启用 tcpstat 收集器(默认值:禁用)。 --collector.textfile 启用文本文件收集器(默认值:启用)。
--collector.thermal_zone 启用热区收集器(默认值:启用)。 --collector.time 启用时间收集器(默认:启用)。
--collector.timex 启用 timex 收集器(默认值:启用)。 --collector.udp_queues 启用 udp_queues 收集器(默认值:启用)。
--collector.uname 启用 uname 收集器(默认值:启用)。 --collector.vmstat 启用 vmstat 收集器(默认值:启用)。
--collector.wifi 启用 wifi 收集器(默认值:禁用)。 --collector.xfs 启用 xfs 收集器(默认值:启用)。
--collector.zfs 启用 zfs 收集器(默认值:启用)。 --collector.zoneinfo 启用 zoneinfo 收集器(默认值:禁用)。
Example:
--collector.filesystem.mount-points-exclude=^/(dev|proc|sys|var/lib/docker/.+|var/lib/kubelet/.+)($|/)List:
Collector Scope Include Flag Exclude Flag arp device --collector.arp.device-include --collector.arp.device-exclude cpu bugs --collector.cpu.info.bugs-include N/A cpu flags --collector.cpu.info.flags-include N/A diskstats device --collector.diskstats.device-include --collector.diskstats.device-exclude ethtool device --collector.ethtool.device-include --collector.ethtool.device-exclude ethtool metrics --collector.ethtool.metrics-include N/A filesystem fs-types N/A --collector.filesystem.fs-types-exclude filesystem mount-points N/A --collector.filesystem.mount-points-exclude hwmon chip --collector.hwmon.chip-include --collector.hwmon.chip-exclude netdev device --collector.netdev.device-include --collector.netdev.device-exclude qdisk device --collector.qdisk.device-include --collector.qdisk.device-exclude sysctl all --collector.sysctl.include N/A systemd unit --collector.systemd.unit-include --collector.systemd.unit-exclude Enabled by default
Name Description OS arp Exposes ARP statistics from /proc/net/arp.Linux bcache Exposes bcache statistics from /sys/fs/bcache/.Linux bonding Exposes the number of configured and active slaves of Linux bonding interfaces. Linux btrfs Exposes btrfs statistics Linux boottime Exposes system boot time derived from the kern.boottimesysctl.Darwin, Dragonfly, FreeBSD, NetBSD, OpenBSD, Solaris conntrack Shows conntrack statistics (does nothing if no /proc/sys/net/netfilter/present).Linux cpu Exposes CPU statistics Darwin, Dragonfly, FreeBSD, Linux, Solaris, OpenBSD cpufreq Exposes CPU frequency statistics Linux, Solaris diskstats Exposes disk I/O statistics. Darwin, Linux, OpenBSD dmi Expose Desktop Management Interface (DMI) info from /sys/class/dmi/id/Linux edac Exposes error detection and correction statistics. Linux entropy Exposes available entropy. Linux exec Exposes execution statistics. Dragonfly, FreeBSD fibrechannel Exposes fibre channel information and statistics from /sys/class/fc_host/.Linux filefd Exposes file descriptor statistics from /proc/sys/fs/file-nr.Linux filesystem Exposes filesystem statistics, such as disk space used. Darwin, Dragonfly, FreeBSD, Linux, OpenBSD hwmon Expose hardware monitoring and sensor data from /sys/class/hwmon/.Linux infiniband Exposes network statistics specific to InfiniBand and Intel OmniPath configurations. Linux ipvs Exposes IPVS status from /proc/net/ip_vsand stats from/proc/net/ip_vs_stats.Linux loadavg Exposes load average. Darwin, Dragonfly, FreeBSD, Linux, NetBSD, OpenBSD, Solaris mdadm Exposes statistics about devices in /proc/mdstat(does nothing if no/proc/mdstatpresent).Linux meminfo Exposes memory statistics. Darwin, Dragonfly, FreeBSD, Linux, OpenBSD netclass Exposes network interface info from /sys/class/net/Linux netdev Exposes network interface statistics such as bytes transferred. Darwin, Dragonfly, FreeBSD, Linux, OpenBSD netisr Exposes netisr statistics FreeBSD netstat Exposes network statistics from /proc/net/netstat. This is the same information asnetstat -s.Linux nfs Exposes NFS client statistics from /proc/net/rpc/nfs. This is the same information asnfsstat -c.Linux nfsd Exposes NFS kernel server statistics from /proc/net/rpc/nfsd. This is the same information asnfsstat -s.Linux nvme Exposes NVMe info from /sys/class/nvme/Linux os Expose OS release info from /etc/os-releaseor/usr/lib/os-releaseany powersupplyclass Exposes Power Supply statistics from /sys/class/power_supplyLinux pressure Exposes pressure stall statistics from /proc/pressure/.Linux (kernel 4.20+ and/or CONFIG_PSI) rapl Exposes various statistics from /sys/class/powercap.Linux schedstat Exposes task scheduler statistics from /proc/schedstat.Linux selinux Exposes SELinux statistics. Linux sockstat Exposes various statistics from /proc/net/sockstat.Linux softnet Exposes statistics from /proc/net/softnet_stat.Linux stat Exposes various statistics from /proc/stat. This includes boot time, forks and interrupts.Linux tapestats Exposes statistics from /sys/class/scsi_tape.Linux textfile Exposes statistics read from local disk. The --collector.textfile.directoryflag must be set.any thermal Exposes thermal statistics like pmset -g therm.Darwin thermal_zone Exposes thermal zone & cooling device statistics from /sys/class/thermal.Linux time Exposes the current system time. any timex Exposes selected adjtimex(2) system call stats. Linux udp_queues Exposes UDP total lengths of the rx_queue and tx_queue from /proc/net/udpand/proc/net/udp6.Linux uname Exposes system information as provided by the uname system call. Darwin, FreeBSD, Linux, OpenBSD vmstat Exposes statistics from /proc/vmstat.Linux xfs Exposes XFS runtime statistics. Linux (kernel 4.4+) zfs Exposes ZFS performance statistics. FreeBSD, Linux, Solaris
node-exporter的部署文件:
cat >node-export.yaml <<EOF
apiVersion: apps/v1
kind: DaemonSet
metadata:name: node-exporternamespace: monitor-salabels:name: node-exporter
spec:selector:matchLabels:name: node-exportertemplate:metadata:labels:name: node-exporterspec:hostPID: truehostIPC: truehostNetwork: truecontainers:- name: node-exporterimage: prom/node-exporter:v0.16.0ports:- containerPort: 9100resources:requests:cpu: 0.15securityContext:privileged: trueargs:- --path.procfs- /host/proc- --path.sysfs- /host/sys- --collector.filesystem.ignored-mount-points- '"^/(sys|proc|dev|host|etc)($|/)"'volumeMounts:- name: devmountPath: /host/dev- name: procmountPath: /host/proc- name: sysmountPath: /host/sys- name: rootfsmountPath: /rootfstolerations:- key: "node-role.kubernetes.io/master"operator: "Exists"effect: "NoSchedule"volumes:- name: prochostPath:path: /proc- name: devhostPath:path: /dev- name: syshostPath:path: /sys- name: rootfshostPath:path: /
EOF
二,
kube-state-metrics收集器的部署
kube-state-metrics是kubernetes内部专门收集pod,deployment,ds,sts等等资源的状态的收集器,该收集器收集到的数据由prometheus-server 服务自己主动来抓取
例如,我们查询该服务的日志可以看到,有一些资源它没有收集到,原因是sa权限不足,但这些无需担心,和node-exporter一样,某些数据我们是并不需要收集的:
E1202 13:10:33.591335       1 reflector.go:156] pkg/mod/k8s.io/client-go@v0.0.0-20191109102209-3c0d1af94be5/tools/cache/reflector.go:108: Failed to list *v1.Secret: secrets is forbidden: User "system:serviceaccount:kube-system:kube-state-metrics" cannot list resource "secrets" in API group "" at the cluster scope
E1202 13:10:33.592118       1 reflector.go:156] pkg/mod/k8s.io/client-go@v0.0.0-20191109102209-3c0d1af94be5/tools/cache/reflector.go:108: Failed to list *v1beta1.MutatingWebhookConfiguration: mutatingwebhookconfigurations.admissionregistration.k8s.io is forbidden: User "system:serviceaccount:kube-system:kube-state-metrics" cannot list resource "mutatingwebhookconfigurations" in API group "admissionregistration.k8s.io" at the cluster scope
E1202 13:10:33.593079       1 reflector.go:156] pkg/mod/k8s.io/client-go@v0.0.0-20191109102209-3c0d1af94be5/tools/cache/reflector.go:108: Failed to list *v1.Namespace: networkpolicies.networking.k8s.io is forbidden: User "system:serviceaccount:kube-system:kube-state-metrics" cannot list resource "networkpolicies" in API group "networking.k8s.io" at the cluster scope
E1202 13:10:33.597030       1 reflector.go:156] pkg/mod/k8s.io/client-go@v0.0.0-20191109102209-3c0d1af94be5/tools/cache/reflector.go:108: Failed to list *v1.ReplicaSet: replicasets.apps is forbidden: User "system:serviceaccount:kube-system:kube-state-metrics" cannot list resource "replicasets" in API group "apps" at the cluster scope
E1202 13:10:33.599890       1 reflector.go:156] pkg/mod/k8s.io/client-go@v0.0.0-20191109102209-3c0d1af94be5/tools/cache/reflector.go:108: Failed to list *v1beta1.ValidatingWebhookConfiguration: validatingwebhookconfigurations.admissionregistration.k8s.io is forbidden: User "system:serviceaccount:kube-system:kube-state-metrics" cannot list resource "validatingwebhookconfigurations" in API group "admissionregistration.k8s.io" at the cluster scope
E1202 13:10:34.580372       1 reflector.go:156] pkg/mod/k8s.io/client-go@v0.0.0-20191109102209-3c0d1af94be5/tools/cache/reflector.go:108: Failed to list *v1.StorageClass: storageclasses.storage.k8s.io is forbidden: User "system:serviceaccount:kube-system:kube-state-metrics" cannot list resource "storageclasses" in API group "storage.k8s.io" at the cluster scope
E1202 13:10:34.580373       1 reflector.go:156] pkg/mod/k8s.io/client-go@v0.0.0-20191109102209-3c0d1af94be5/tools/cache/reflector.go:108: Failed to list *v1.ConfigMap: configmaps is forbidden: User "system:serviceaccount:kube-system:kube-state-metrics" cannot list resource "configmaps" in API group "" at the cluster scope
E1202 13:10:34.586583       1 reflector.go:156] pkg/mod/k8s.io/client-go@v0.0.0-20191109102209-3c0d1af94be5/tools/cache/reflector.go:108: Failed to list *v1beta1.PodDisruptionBudget: poddisruptionbudgets.policy is forbidden: User "system:serviceaccount:kube-system:kube-state-metrics" cannot list resource "poddisruptionbudgets" in API group "policy" at the cluster scope
E1202 13:10:34.586669       1 reflector.go:156] pkg/mod/k8s.io/client-go@v0.0.0-20191109102209-3c0d1af94be5/tools/cache/reflector.go:108: Failed to list *v1.Deployment: deployments.apps is forbidden: User "system:serviceaccount:kube-system:kube-state-metrics" cannot list resource "deployments" in API group "apps" at the cluster scope
E1202 13:10:34.587055       1 reflector.go:156] pkg/mod/k8s.io/client-go@v0.0.0-20191109102209-3c0d1af94be5/tools/cache/reflector.go:108: Failed to list *v1beta1.VolumeAttachment: volumeattachments.storage.k8s.io is forbidden: User "system:serviceaccount:kube-system:kube-state-metrics" cannot list resource "volumeattachments" in API group "storage.k8s.io" at the cluster scope
kube-state-metrics的RBAC:
这里上面的缺的收集cm的权限我已经补上了
cat> kube-state-metrics-rbac.yaml <<EOF
---
apiVersion: v1
kind: ServiceAccount
metadata:name: kube-state-metricsnamespace: kube-system
---
apiVersion: rbac.authorization.k8s.io/v1
kind: ClusterRole
metadata:name: kube-state-metrics
rules:
- apiGroups: [""]resources: ["nodes", "pods", "services", "resourcequotas", "replicationcontrollers", "limitranges", "persistentvolumeclaims", "persistentvolumes", "namespaces", "endpoints"]verbs: ["list", "watch"]
- apiGroups: ["extensions"]resources: ["daemonsets", "deployments", "replicasets"]verbs: ["list", "watch"]
- apiGroups: ["apps"]resources: ["statefulsets","daemonsets","replicasets","deployments"]verbs: ["list", "watch"]
- apiGroups: ["batch"]resources: ["cronjobs", "jobs"]verbs: ["list", "watch"]
- apiGroups: ["autoscaling"]resources: ["horizontalpodautoscalers"]verbs: ["list", "watch"]
- apiGroups: [""]resources: ["configmaps","secrets"]verbs: ["list", "watch"]
---
apiVersion: rbac.authorization.k8s.io/v1
kind: ClusterRoleBinding
metadata:name: kube-state-metrics
roleRef:apiGroup: rbac.authorization.k8s.iokind: ClusterRolename: kube-state-metrics
subjects:
- kind: ServiceAccountname: kube-state-metricsnamespace: kube-system
EOF
kube-state-metrics的svc:
这里有一个注解,prometheus.io/scrape: 'true' 表示允许prometheus收集数据
cat> kube-state-metrics-svc.yaml <<EOF
apiVersion: v1
kind: Service
metadata:annotations:prometheus.io/scrape: 'true'name: kube-state-metricsnamespace: kube-systemlabels:app: kube-state-metrics
spec:ports:- name: kube-state-metricsport: 8080protocol: TCPselector:app: kube-state-metrics
EOF
kube-state-metrics的deployment:
cat >kube-state-metrics-deploy.yaml <<EOF
apiVersion: apps/v1
kind: Deployment
metadata:name: kube-state-metricsnamespace: kube-system
spec:replicas: 1selector:matchLabels:app: kube-state-metricstemplate:metadata:labels:app: kube-state-metricsspec:serviceAccountName: kube-state-metricscontainers:- name: kube-state-metrics
#        image: gcr.io/google_containers/kube-state-metrics-amd64:v1.3.1image: quay.io/coreos/kube-state-metrics:v1.9.0ports:- containerPort: 8080
EOF
三,
prometheus-server的部署
1,
prometheus-svc
cat >prometheus-cfg.yaml <<EOF
---
kind: ConfigMap
apiVersion: v1
metadata:labels:app: prometheusname: prometheus-confignamespace: monitor-sa
data:prometheus.yml: |global:scrape_interval: 15sscrape_timeout: 10sevaluation_interval: 1mscrape_configs:- job_name: 'kubernetes-node'kubernetes_sd_configs:- role: noderelabel_configs:- source_labels: [__address__]regex: '(.*):10250'replacement: '${1}:9100'target_label: __address__action: replace- action: labelmapregex: __meta_kubernetes_node_label_(.+)- job_name: 'kubernetes-node-cadvisor'kubernetes_sd_configs:- role:  nodescheme: httpstls_config:ca_file: /var/run/secrets/kubernetes.io/serviceaccount/ca.crtbearer_token_file: /var/run/secrets/kubernetes.io/serviceaccount/tokenrelabel_configs:- action: labelmapregex: __meta_kubernetes_node_label_(.+)- target_label: __address__replacement: kubernetes.default.svc:443- source_labels: [__meta_kubernetes_node_name]regex: (.+)target_label: __metrics_path__replacement: /api/v1/nodes/${1}/proxy/metrics/cadvisor- job_name: 'kubernetes-apiserver'kubernetes_sd_configs:- role: endpointsscheme: httpstls_config:ca_file: /var/run/secrets/kubernetes.io/serviceaccount/ca.crtbearer_token_file: /var/run/secrets/kubernetes.io/serviceaccount/tokenrelabel_configs:- source_labels: [__meta_kubernetes_namespace, __meta_kubernetes_service_name, __meta_kubernetes_endpoint_port_name]action: keepregex: default;kubernetes;https
EOF
2,
prometheus-svc:
cat >prometheus-svc.yaml <<EOF
---
apiVersion: v1
kind: Service
metadata:name: prometheusnamespace: monitor-salabels:app: prometheus
spec:type: NodePortports:- port: 9090targetPort: 9090protocol: TCPselector:app: prometheuscomponent: server
EOF
3,
cat >prometheus-deploy.yaml <<EOF
---
apiVersion: apps/v1
kind: Deployment
metadata:name: prometheus-servernamespace: monitor-salabels:app: prometheus
spec:replicas: 2selector:matchLabels:app: prometheuscomponent: server#matchExpressions:#- {key: app, operator: In, values: [prometheus]}#- {key: component, operator: In, values: [server]}template:metadata:labels:app: prometheuscomponent: serverannotations:prometheus.io/scrape: 'false'spec:nodeName: node4serviceAccountName: monitorcontainers:- name: prometheusimage: prom/prometheus:v2.2.1imagePullPolicy: IfNotPresentcommand:- prometheus- --config.file=/etc/prometheus/prometheus.yml- --storage.tsdb.path=/prometheus- --storage.tsdb.retention=720hports:- containerPort: 9090protocol: TCPvolumeMounts:- mountPath: /etc/prometheus/prometheus.ymlname: prometheus-configsubPath: prometheus.yml- mountPath: /prometheus/name: prometheus-storage-volumevolumes:- name: prometheus-configconfigMap:name: prometheus-configitems:- key: prometheus.ymlpath: prometheus.ymlmode: 0644- name: prometheus-storage-volumehostPath:path: /datatype: Directory
EOF
以上所有部署执行完毕后,查看prometheus-server的svc:
[root@node4 yaml]# k get svc -n monitor-sa
NAME         TYPE       CLUSTER-IP    EXTERNAL-IP   PORT(S)          AGE
prometheus   NodePort   10.96.0.120   <none>        9090:32661/TCP   10d
根据该port,打开浏览器,进入prometheus的web界面:

至此,kubernetes集群内的prometheus-server服务就安装完毕了!!!!!!
grafana默认安装就可以了,rpm方式安装,没什么好说的,主要是数据源设置如下:

相关文章:
prometheus|云原生|kubernetes内部安装prometheus
架构说明: prometheus是云原生系统内的事实上的监控标准,而kubernetes集群内部自然还是需要就地取材的部署prometheus服务了 那么,prometheus-server部署的方式其实是非常多的,比如,kubesphere集成方式,h…...
利用Python中的Manim进行数学绘画和创作
相信很多同学就算没听过3Blue1Brown,也一定曾看过他们出品的视频,其从独特的视觉角度解说各种数学概念,内容包括线性代数、微积分、神经网络、傅里叶变换以及四元数等晦涩难懂的知识点。例如最火的《线性代数本质》系列视频。 那么这些视频是…...

Uniapp
UniApp是一个强大的跨平台应用开发框架 随着移动互联网的快速发展,跨平台应用开发成为了一个重要的需求。UniApp就是一个能够满足这一需求的强大框架。本文将介绍UniApp的基本概念、优势、使用方法和未来发展。 一、UniApp概述 UniApp是一个基于Vue.js开发的跨平…...

HNU-青蛙与蚊子
【问题描述】 有 n 只青蛙位于坐标轴 OX 上,对于每只青蛙,有两个已知值 xi、ti,表示第 i 只青蛙在坐标的位置(各不相同)以及它的舌头的长度。同样有 m 只蚊子一只接一只的落到坐标轴上,对于每只蚊子&#x…...

【新论文】【模型攻击】DiffAttack 针对基于扩散的对抗性净化的逃避攻击
DiffAttack: Evasion Attacks Against Diffusion-Based Adversarial Purification 作者: Mintong Kang; Dawn Song; Bo Li 链接: http://arxiv.org/pdf/2311.16124v1 备注: Accepted to NeurIPS 2023 摘要: 基于扩散的净化防御利用扩散模型去除对抗样本的精心设计的扰动&#…...
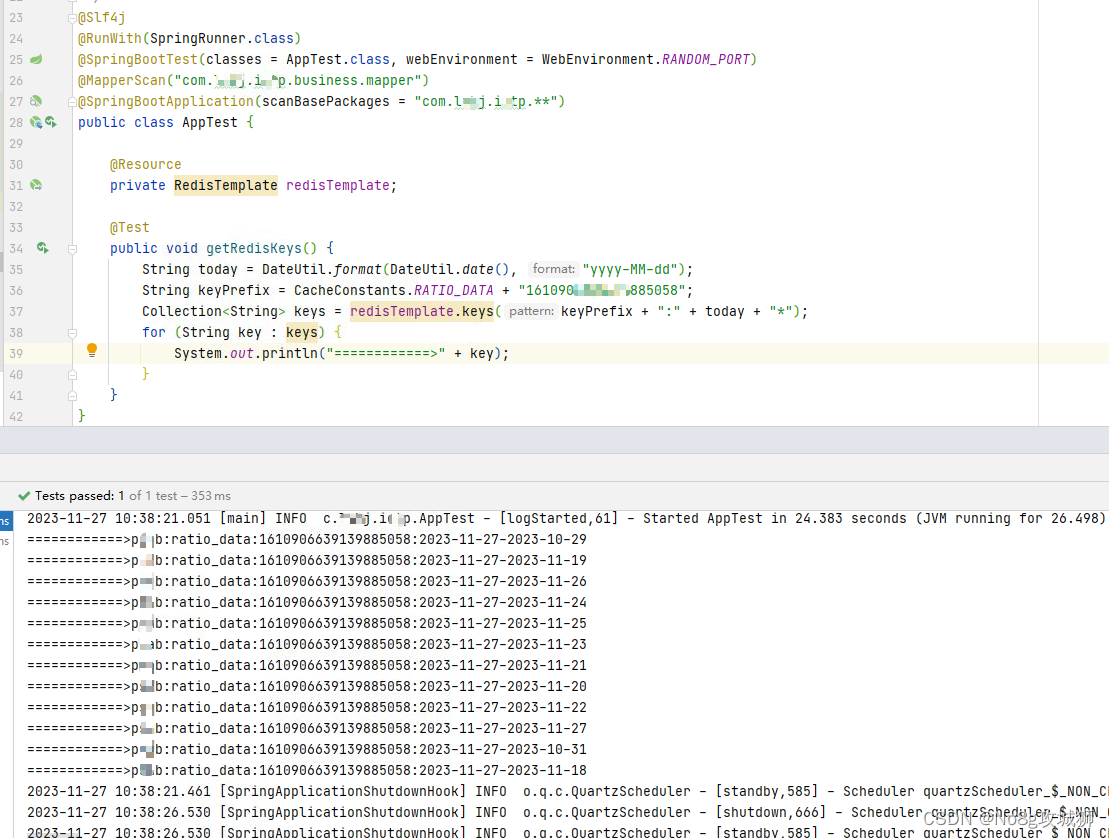
【Redis缓存】RedisTemplate如何获取符合要求的key,批量获取key
RedisTemplate如何获取符合要求的key,批量获取key 一、方法/命令二、数据使用 一、方法/命令 如果使用命令的形式,输入以下命令即可 keys *如果使用RedisTemplate,则方法为 redisTemplate.keys()获取所有符合条件的key。 二、数据使用 redis中缓存了…...
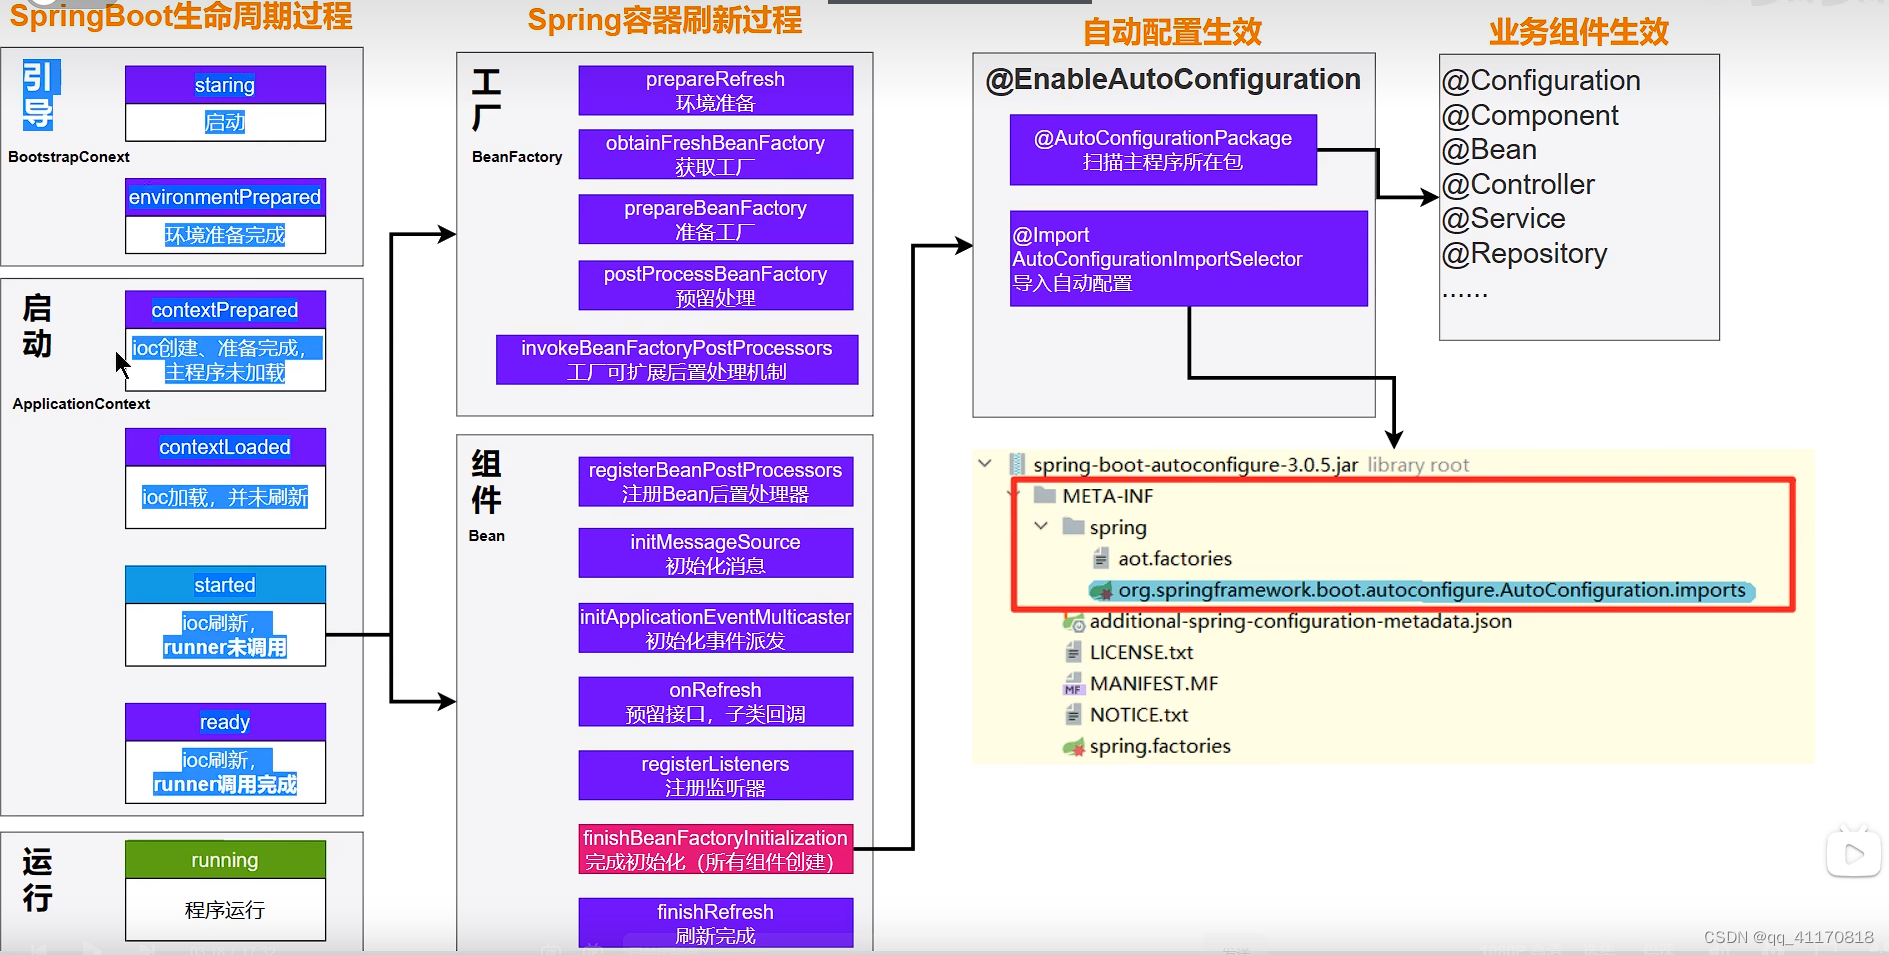
springboot核心原理之@SpringbootApplication
1.SpringbootApplication Configuration标志的类 在spring ioc启动的时候就会加载创建这个类对象 EnableAutoConfiguration 中有两个注解 (1)AutoConfigurationPackage 扫描主程序包(主程序main所在包及其子包) 可以看到这个类 : static c…...
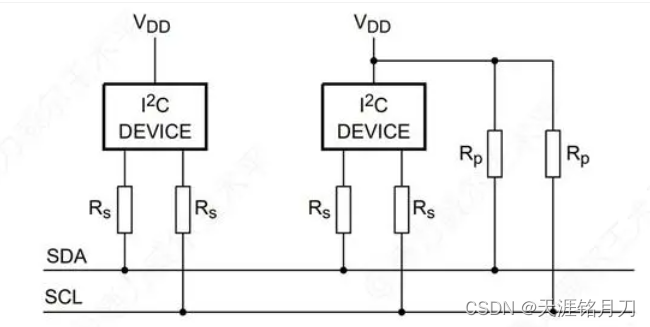
阻抗匹配电阻原理及其应用
一、匹配电阻的作用 1、阻抗匹配 当信号频率比较高,上升沿比较陡时,电子信号经过阻抗不同的地方时也会产设反射。 PCB的单线阻抗一般会设计成50Ω,发射端阻抗一般是17到40,而接收端一般是MOS管的输入,阻抗是比较大的…...
IDEA2023安装教程(超详细)
文章目录 前言安装IntelliJ IDEA1. 下载IntelliJ IDEA2. 运行安装程序3. 选择安装路径4. 选择启动器设置5. 等待安装完成6. 启动IntelliJ IDEA7. 配置和设置8. 激活或选择许可证9. 开始使用 总结 前言 随着软件开发的不断发展,IntelliJ IDEA成为了许多开发人员首选…...
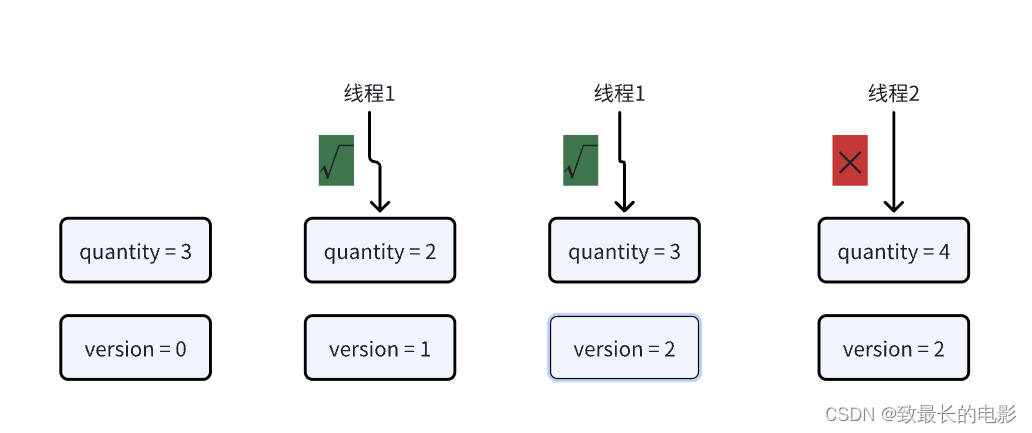
【MySql】悲观锁和乐观锁的介绍
一、并发控制 当程序中可能出现并发的情况时,就需要保证在并发情况下数据的准确性,以此确保当前用户和其他用户一起操作时,所得到的结果和他单独操作时的结果是一样的。这就叫做并发控制。并发控制的目的是保证一个用户的工作不会对另一个用…...

手写实现一个动态代理框架
手写实现一个动态代理框架 什么是代理模式什么是动态代理动态代理中的编译、类加载与对象实例化手写实现一个动态代理框架实现细节DynamicProxyHandlerProxy生成代码写入代码到磁盘文件调用编译器进行编译调用类加载器进行类加载反射实例化删除前面生成的java文件和class文件 C…...
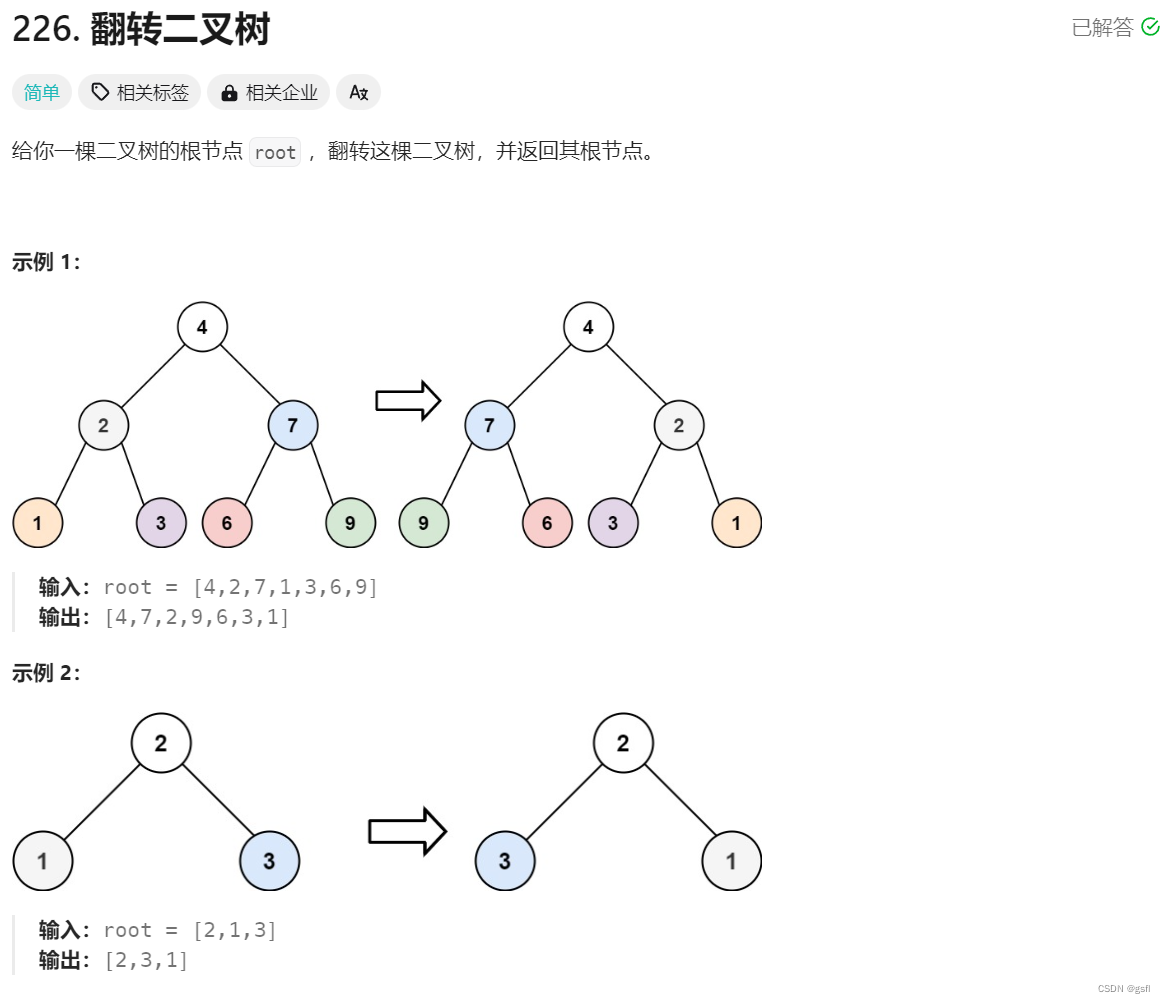
Leetcode226. 翻转二叉树
文章目录 题目介绍题目分析解题思路边界条件:节点为空时返回空子问题:交换左右子节点 整体代码 题目介绍 题目分析 题目要求我们将树中每个节点的左右子节点全部交换,最后返回交换后的树的根节点。 解题思路 这题是比较常见的递归,直接找边…...
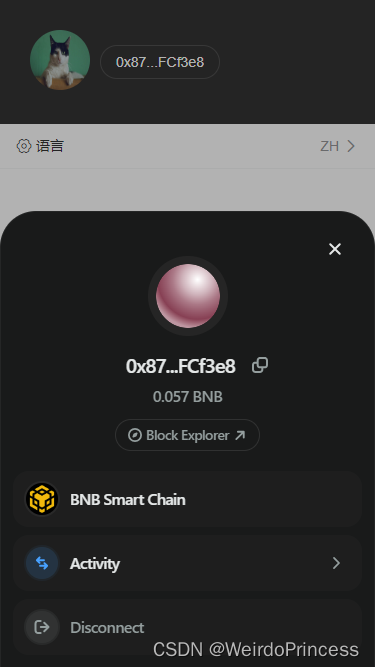
使用WalletConnect Web3Modal v3 链接钱包基础教程
我使用的是vueethers 官方文档:WalletConnect 1.安装 yarn add web3modal/ethers ethers 或者 npm install web3modal/ethers ethers2.引用 新建一个js文件,在main.js中引入,初始化配置sdk import {createWeb3Modal,defaultConfig, } from…...

黄金比例设计软件Goldie App mac中文版介绍
Goldie App mac是一款测量可视化黄金比例的工具。专门为设计师打造,可以帮助他们在Mac上测量和可视化黄金比例,从而轻松创建出完美、平衡的设计。 Goldie App mac体积小巧,可以驻留在系统的菜单栏之上,随时提供给用户调用。 拥有独…...
实现搜索 以及 回车选中搜索项)
el-select实现可复制一段“关键词“(多个)实现搜索 以及 回车选中搜索项
el-select实现可复制一段"关键词"(多个)实现搜索 以及 回车选中搜索项 <el-selectref"productRef"filterableclearablev-model"fItem.productName"multiple:reserve-keyword"true"remote:filter-method&quo…...
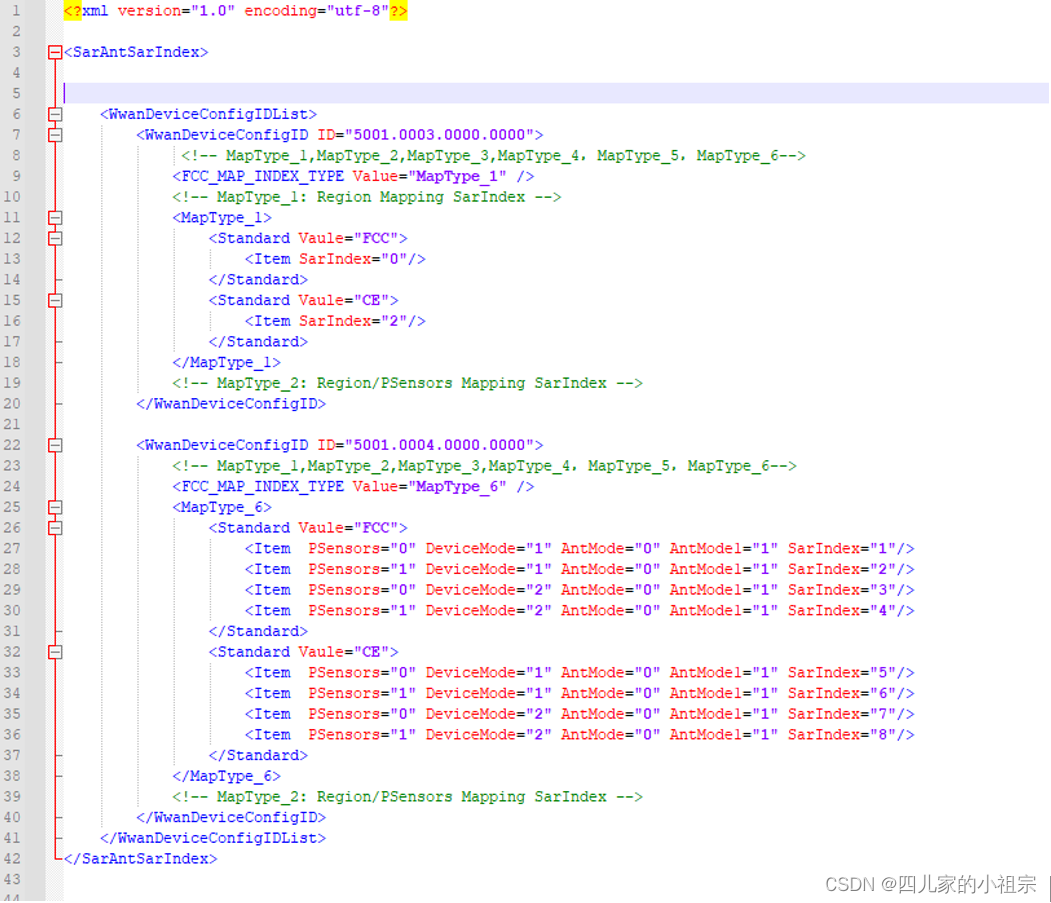
C++解析xml示例
C解析xml示例 1. Xml文档介绍1.1 特点及作用1.2 Xml优点1.2.1 良好的可拓展性1.2.2 内容与形式分离 1.3 Xml组成1.3.1 Xml声明1.3.2 根元素1.3.3 元素1.3.4 属性1.3.5 实体1.3.6 注释 2 C解析Xml2.1 tinyXml2类库2.2 关键接口2.2.1 LoadFile2.2.2 RootElement2.2.3 FirstChildE…...

记录 | linux find+rm查找并直接删除
findrm查找并直接删除: find ./ -name "xx_name" |xargs rm -rf...

24.有哪些生命周期回调方法?有哪几种实现方式?
有哪些生命周期回调方法?有哪几种实现方式? 有两个重要的bean 生命周期方法, 第一个是init , 它是在容器加载bean的时候被调用。第二个方法是 destroy 它是在容器卸载类的时候被调用。bean 标签有两个重要的属性(init-method和destroy-method)。用它们你可以自己定制初始…...

C++详解
//7.用new建立一个动态一维数组,并初始化int[10]{1,2,3,4,5,6,7,8,9,10},用指针输出,最后销毁数组所占空间。 #include<iostream> #include<string> using namespace std; int main() { int *p; pnew int[10]; for(i…...
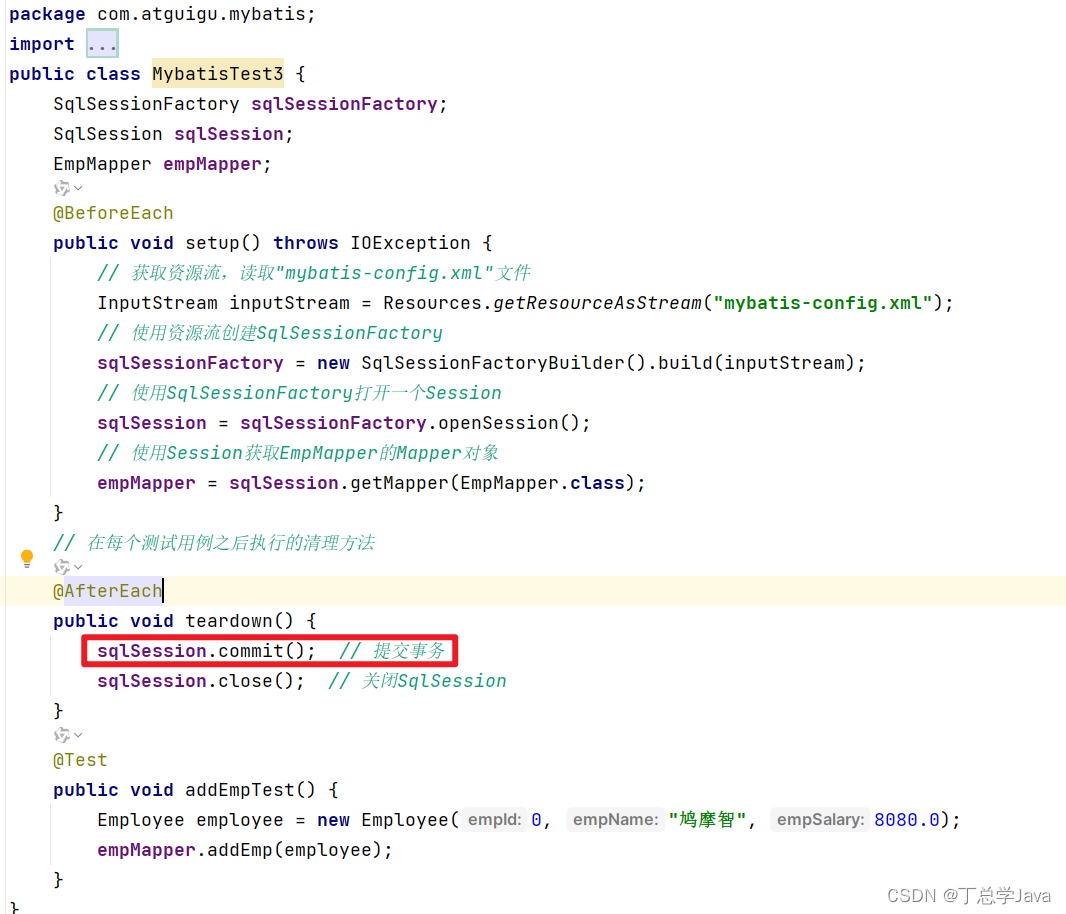
mybatis数据输入-实体类型的参数
1、建库建表 CREATE DATABASE mybatis-example;USE mybatis-example;CREATE TABLE t_emp(emp_id INT AUTO_INCREMENT,emp_name CHAR(100),emp_salary DOUBLE(10,5),PRIMARY KEY(emp_id) );INSERT INTO t_emp(emp_name,emp_salary) VALUES("tom",200.33); INSERT INTO…...
)
Excel数据透视表实战:5分钟搞定销售数据分析(附常见错误排查)
Excel数据透视表实战:5分钟搞定销售数据分析(附常见错误排查) 当你面对密密麻麻的销售数据表格时,是否曾感到无从下手?数据透视表就是Excel中最强大的"数据翻译官",它能将杂乱无章的销售记录瞬间…...
)
DCDC电路设计必看:如何根据BLE SoC特性精准选择电感(附GR551x/552x实测数据)
DCDC电路设计进阶指南:BLE SoC电感选型实战与GR551x/552x深度优化 在物联网设备设计中,电源管理模块的效能往往决定了产品的续航表现和稳定性。对于采用BLE SoC的智能穿戴、传感器终端等低功耗设备而言,DCDC电路中的电感选型更是直接影响射频…...

Arduino R4 WiFi 12×8点阵数字显示库:零依赖轻量级实现
1. 项目概述Pantalla12x8 是一个专为 Arduino R4 WiFi 平台设计的轻量级图形显示库,面向物理尺寸为 128 像素的单色点阵显示屏。该库不依赖任何外部显示驱动芯片(如 MAX7219、HT16K33)或复杂图形框架,而是直接以位图数据形式驱动硬…...
)
架构演进与性能压榨:在金融 RAG 中引入条款森林 (FoC)
业务痛点:在金融/医疗等强层级长文档场景中,传统向量检索(含混合检索)面对“跨章节逻辑对比”问题时,存在结构性召回缺失。架构破局:设计了 FoC (Forest of Clauses) 条款森林 架构,将文档目录树…...

python+flask+vue3基于web的社区物业管理平台开题
目录技术选型与架构设计项目模块划分开发环境搭建关键API设计示例前端数据交互数据模型设计开发进度安排测试策略部署方案项目技术支持源码获取详细视频演示 :文章底部获取博主联系方式!同行可合作技术选型与架构设计 后端采用PythonFlask框架ÿ…...

Pistache高级特性揭秘:流式处理、Cookie管理和内容编码
Pistache高级特性揭秘:流式处理、Cookie管理和内容编码 【免费下载链接】pistache A high-performance REST toolkit written in C 项目地址: https://gitcode.com/gh_mirrors/pi/pistache Pistache是一个高性能的C REST工具包,提供了丰富的高级特…...

Go Gin示例项目数据库连接池调优:从频繁超时到秒级响应终极指南
Go Gin示例项目数据库连接池调优:从频繁超时到秒级响应终极指南 【免费下载链接】go-gin-example An example of gin 项目地址: https://gitcode.com/gh_mirrors/go/go-gin-example 在Go Web开发中,数据库连接池的配置优化是提升应用性能的关键环…...
的3个常见坑:First()/Dequeue()实战避雷指南)
避开Unity队列(Queue)的3个常见坑:First()/Dequeue()实战避雷指南
Unity队列(Queue)实战避坑指南:从First()到Dequeue()的深度解析 在Unity开发中,队列(Queue)作为一种基础但强大的数据结构,经常被用于处理需要先进先出(FIFO)逻辑的场景。然而,许多开发者在实际使用Queue时,往往会陷入…...

MAX7219四合一点阵驱动原理与同步显示设计
1. 项目概述MAX7219四合一点阵显示模块是一种面向嵌入式系统设计的高集成度LED驱动解决方案,其核心目标是通过极简的硬件接口和确定性的时序控制,实现多片88点阵的稳定、无闪烁显示。该模块并非通用显示终端,而是专为需要紧凑空间部署、低资源…...

系统发育多样性分析避坑指南:从Faith‘s PD计算到树文件修剪的常见错误解析
系统发育多样性分析避坑指南:从Faiths PD计算到树文件修剪的常见错误解析 1. 为什么你的Faiths PD计算结果总是出错? 刚接触系统发育分析的同学们经常会遇到一个令人困惑的现象:明明按照教程步骤操作,pd()函数却频繁报错。这往往与…...