【监控】Linux部署postgres_exporter及PG配置(非Docker)
目录
- 一、下载及部署
- 二、postgres_exporter配置
- 1. 停止脚本stop.sh
- 2. 启动脚本start.sh
- 3. queries.yaml
- 三、PostgreSQL数据库配置
- 1. 修改postgresql.conf配置文件
- 2. 创建用户、表、扩展等
- 四、参考
一、下载及部署
下载地址
选一个amd64下载
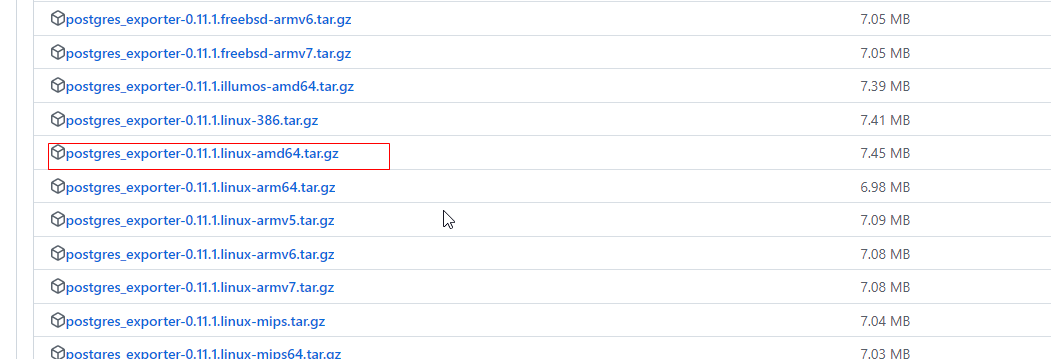
上传至服务器,解压
tax -xvf postgres_exporter-0.11.1.linux-amd64.tar.gz
进入解压后的目录
二、postgres_exporter配置
1. 停止脚本stop.sh
建立停止脚本 stop.sh 。注意unix编码
#!/bin/sh
echo "stop"
#!/bin/bashPID=$(ps -ef | grep postgres_exporter | grep -v grep | awk '{ print $2 }')
if [ "${PID}" ]
thenecho 'Application is stpping...'echo kill $PID DONEkill $PID
elseecho 'Application is already stopped...'
fi
2. 启动脚本start.sh
启动脚本start.sh
-
后面会建立postgres_exporter用户,密码为password
-
–web.listen-address为监听的端口
-
–extend.query-path为自定义查询的文件
sh stop.sh
export DATA_SOURCE_NAME=postgresql://postgres_exporter:password@数据库IP:数据库端口/postgres?sslmode=disablenohup ./postgres_exporter --web.listen-address=0.0.0.0:8001 --extend.query-path=queries.yaml >nohup.out 2>&1 &
3. queries.yaml
pg_replication:query: "SELECT CASE WHEN NOT pg_is_in_recovery() THEN 0 ELSE GREATEST (0, EXTRACT(EPOCH FROM (now() - pg_last_xact_replay_timestamp()))) END AS lag"master: truemetrics:- lag:usage: "GAUGE"description: "Replication lag behind master in seconds"pg_postmaster:query: "SELECT pg_postmaster_start_time as start_time_seconds from pg_postmaster_start_time()"master: truemetrics:- start_time_seconds:usage: "GAUGE"description: "Time at which postmaster started"pg_stat_user_tables:query: |SELECTcurrent_database() datname,schemaname,relname,seq_scan,seq_tup_read,idx_scan,idx_tup_fetch,n_tup_ins,n_tup_upd,n_tup_del,n_tup_hot_upd,n_live_tup,n_dead_tup,n_mod_since_analyze,COALESCE(last_vacuum, '1970-01-01Z') as last_vacuum,COALESCE(last_autovacuum, '1970-01-01Z') as last_autovacuum,COALESCE(last_analyze, '1970-01-01Z') as last_analyze,COALESCE(last_autoanalyze, '1970-01-01Z') as last_autoanalyze,vacuum_count,autovacuum_count,analyze_count,autoanalyze_countFROMpg_stat_user_tablesmetrics:- datname:usage: "LABEL"description: "Name of current database"- schemaname:usage: "LABEL"description: "Name of the schema that this table is in"- relname:usage: "LABEL"description: "Name of this table"- seq_scan:usage: "COUNTER"description: "Number of sequential scans initiated on this table"- seq_tup_read:usage: "COUNTER"description: "Number of live rows fetched by sequential scans"- idx_scan:usage: "COUNTER"description: "Number of index scans initiated on this table"- idx_tup_fetch:usage: "COUNTER"description: "Number of live rows fetched by index scans"- n_tup_ins:usage: "COUNTER"description: "Number of rows inserted"- n_tup_upd:usage: "COUNTER"description: "Number of rows updated"- n_tup_del:usage: "COUNTER"description: "Number of rows deleted"- n_tup_hot_upd:usage: "COUNTER"description: "Number of rows HOT updated (i.e., with no separate index update required)"- n_live_tup:usage: "GAUGE"description: "Estimated number of live rows"- n_dead_tup:usage: "GAUGE"description: "Estimated number of dead rows"- n_mod_since_analyze:usage: "GAUGE"description: "Estimated number of rows changed since last analyze"- last_vacuum:usage: "GAUGE"description: "Last time at which this table was manually vacuumed (not counting VACUUM FULL)"- last_autovacuum:usage: "GAUGE"description: "Last time at which this table was vacuumed by the autovacuum daemon"- last_analyze:usage: "GAUGE"description: "Last time at which this table was manually analyzed"- last_autoanalyze:usage: "GAUGE"description: "Last time at which this table was analyzed by the autovacuum daemon"- vacuum_count:usage: "COUNTER"description: "Number of times this table has been manually vacuumed (not counting VACUUM FULL)"- autovacuum_count:usage: "COUNTER"description: "Number of times this table has been vacuumed by the autovacuum daemon"- analyze_count:usage: "COUNTER"description: "Number of times this table has been manually analyzed"- autoanalyze_count:usage: "COUNTER"description: "Number of times this table has been analyzed by the autovacuum daemon"pg_statio_user_tables:query: "SELECT current_database() datname, schemaname, relname, heap_blks_read, heap_blks_hit, idx_blks_read, idx_blks_hit, toast_blks_read, toast_blks_hit, tidx_blks_read, tidx_blks_hit FROM pg_statio_user_tables"metrics:- datname:usage: "LABEL"description: "Name of current database"- schemaname:usage: "LABEL"description: "Name of the schema that this table is in"- relname:usage: "LABEL"description: "Name of this table"- heap_blks_read:usage: "COUNTER"description: "Number of disk blocks read from this table"- heap_blks_hit:usage: "COUNTER"description: "Number of buffer hits in this table"- idx_blks_read:usage: "COUNTER"description: "Number of disk blocks read from all indexes on this table"- idx_blks_hit:usage: "COUNTER"description: "Number of buffer hits in all indexes on this table"- toast_blks_read:usage: "COUNTER"description: "Number of disk blocks read from this table's TOAST table (if any)"- toast_blks_hit:usage: "COUNTER"description: "Number of buffer hits in this table's TOAST table (if any)"- tidx_blks_read:usage: "COUNTER"description: "Number of disk blocks read from this table's TOAST table indexes (if any)"- tidx_blks_hit:usage: "COUNTER"description: "Number of buffer hits in this table's TOAST table indexes (if any)"# WARNING: This set of metrics can be very expensive on a busy server as every unique query executed will create an additional time series
pg_stat_statements:query: "SELECT t2.rolname, t3.datname, queryid, calls, total_time / 1000 as total_time_seconds, min_time / 1000 as min_time_seconds, max_time / 1000 as max_time_seconds, mean_time / 1000 as mean_time_seconds, stddev_time / 1000 as stddev_time_seconds, rows, shared_blks_hit, shared_blks_read, shared_blks_dirtied, shared_blks_written, local_blks_hit, local_blks_read, local_blks_dirtied, local_blks_written, temp_blks_read, temp_blks_written, blk_read_time / 1000 as blk_read_time_seconds, blk_write_time / 1000 as blk_write_time_seconds FROM pg_stat_statements t1 JOIN pg_roles t2 ON (t1.userid=t2.oid) JOIN pg_database t3 ON (t1.dbid=t3.oid) WHERE t2.rolname != 'rdsadmin'"master: truemetrics:- rolname:usage: "LABEL"description: "Name of user"- datname:usage: "LABEL"description: "Name of database"- queryid:usage: "LABEL"description: "Query ID"- calls:usage: "COUNTER"description: "Number of times executed"- total_time_seconds:usage: "COUNTER"description: "Total time spent in the statement, in milliseconds"- min_time_seconds:usage: "GAUGE"description: "Minimum time spent in the statement, in milliseconds"- max_time_seconds:usage: "GAUGE"description: "Maximum time spent in the statement, in milliseconds"- mean_time_seconds:usage: "GAUGE"description: "Mean time spent in the statement, in milliseconds"- stddev_time_seconds:usage: "GAUGE"description: "Population standard deviation of time spent in the statement, in milliseconds"- rows:usage: "COUNTER"description: "Total number of rows retrieved or affected by the statement"- shared_blks_hit:usage: "COUNTER"description: "Total number of shared block cache hits by the statement"- shared_blks_read:usage: "COUNTER"description: "Total number of shared blocks read by the statement"- shared_blks_dirtied:usage: "COUNTER"description: "Total number of shared blocks dirtied by the statement"- shared_blks_written:usage: "COUNTER"description: "Total number of shared blocks written by the statement"- local_blks_hit:usage: "COUNTER"description: "Total number of local block cache hits by the statement"- local_blks_read:usage: "COUNTER"description: "Total number of local blocks read by the statement"- local_blks_dirtied:usage: "COUNTER"description: "Total number of local blocks dirtied by the statement"- local_blks_written:usage: "COUNTER"description: "Total number of local blocks written by the statement"- temp_blks_read:usage: "COUNTER"description: "Total number of temp blocks read by the statement"- temp_blks_written:usage: "COUNTER"description: "Total number of temp blocks written by the statement"- blk_read_time_seconds:usage: "COUNTER"description: "Total time the statement spent reading blocks, in milliseconds (if track_io_timing is enabled, otherwise zero)"- blk_write_time_seconds:usage: "COUNTER"description: "Total time the statement spent writing blocks, in milliseconds (if track_io_timing is enabled, otherwise zero)"pg_process_idle:query: |WITHmetrics AS (SELECTapplication_name,SUM(EXTRACT(EPOCH FROM (CURRENT_TIMESTAMP - state_change))::bigint)::float AS process_idle_seconds_sum,COUNT(*) AS process_idle_seconds_countFROM pg_stat_activityWHERE state = 'idle'GROUP BY application_name),buckets AS (SELECTapplication_name,le,SUM(CASE WHEN EXTRACT(EPOCH FROM (CURRENT_TIMESTAMP - state_change)) <= leTHEN 1ELSE 0END)::bigint AS bucketFROMpg_stat_activity,UNNEST(ARRAY[1, 2, 5, 15, 30, 60, 90, 120, 300]) AS leGROUP BY application_name, leORDER BY application_name, le)SELECTapplication_name,process_idle_seconds_sum as seconds_sum,process_idle_seconds_count as seconds_count,ARRAY_AGG(le) AS seconds,ARRAY_AGG(bucket) AS seconds_bucketFROM metrics JOIN buckets USING (application_name)GROUP BY 1, 2, 3metrics:- application_name:usage: "LABEL"description: "Application Name"- seconds:usage: "HISTOGRAM"description: "Idle time of server processes"
三、PostgreSQL数据库配置
1. 修改postgresql.conf配置文件
- 先根据命令在服务器上找到配置文件在哪
find / -name postgresql.conf
- 修改配置文件postgresql.conf,添加下面三行
shared_preload_libraries = 'pg_stat_statements'
pg_stat_statements.max = 1000
pg_stat_statements.track = all
- 重启pg服务(pg不同安装方式启动方式可能不同)
pg_ctl restart
2. 创建用户、表、扩展等
官网的文档里提示比pg10高或低版本的数据库执行的SQL不同,但是我pg11只执行高版本的SQL失败了。最终高低版本都执行成功。
最好在postgres库下的public模式执行
版本>=10的pg,以下三段SQL都要执行
-- To use IF statements, hence to be able to check if the user exists before
-- attempting creation, we need to switch to procedural SQL (PL/pgSQL)
-- instead of standard SQL.
-- More: https://www.postgresql.org/docs/9.3/plpgsql-overview.html
-- To preserve compatibility with <9.0, DO blocks are not used; instead,
-- a function is created and dropped.
CREATE OR REPLACE FUNCTION __tmp_create_user() returns void as $$
BEGINIF NOT EXISTS (SELECT                       -- SELECT list can stay empty for thisFROM   pg_catalog.pg_userWHERE  usename = 'postgres_exporter') THENCREATE USER postgres_exporter;END IF;
END;
$$ language plpgsql;SELECT __tmp_create_user();
DROP FUNCTION __tmp_create_user();ALTER USER postgres_exporter WITH PASSWORD 'password';
ALTER USER postgres_exporter SET SEARCH_PATH TO postgres_exporter,pg_catalog;-- If deploying as non-superuser (for example in AWS RDS), uncomment the GRANT
-- line below and replace <MASTER_USER> with your root user.
-- GRANT postgres_exporter TO <MASTER_USER>;GRANT CONNECT ON DATABASE postgres TO postgres_exporter;
GRANT pg_monitor to postgres_exporter;
版本<10的pg,只执行下面的SQL
CREATE SCHEMA IF NOT EXISTS postgres_exporter;
GRANT USAGE ON SCHEMA postgres_exporter TO postgres_exporter;CREATE OR REPLACE FUNCTION get_pg_stat_activity() RETURNS SETOF pg_stat_activity AS
$$ SELECT * FROM pg_catalog.pg_stat_activity; $$
LANGUAGE sql
VOLATILE
SECURITY DEFINER;CREATE OR REPLACE VIEW postgres_exporter.pg_stat_activity
ASSELECT * from get_pg_stat_activity();GRANT SELECT ON postgres_exporter.pg_stat_activity TO postgres_exporter;CREATE OR REPLACE FUNCTION get_pg_stat_replication() RETURNS SETOF pg_stat_replication AS
$$ SELECT * FROM pg_catalog.pg_stat_replication; $$
LANGUAGE sql
VOLATILE
SECURITY DEFINER;CREATE OR REPLACE VIEW postgres_exporter.pg_stat_replication
ASSELECT * FROM get_pg_stat_replication();GRANT SELECT ON postgres_exporter.pg_stat_replication TO postgres_exporter;CREATE EXTENSION IF NOT EXISTS pg_stat_statements;
CREATE OR REPLACE FUNCTION get_pg_stat_statements() RETURNS SETOF pg_stat_statements AS
$$ SELECT * FROM public.pg_stat_statements; $$
LANGUAGE sql
VOLATILE
SECURITY DEFINER;CREATE OR REPLACE VIEW postgres_exporter.pg_stat_statements
ASSELECT * FROM get_pg_stat_statements();GRANT SELECT ON postgres_exporter.pg_stat_statements TO postgres_exporter;
来到postgres_exporter安装目录,启动postgres_exporter
sh start.sh
观察nohup.out文件,看是否有报错信息。
如果集成了Grafana,可以发现页面已经能采集到数据了
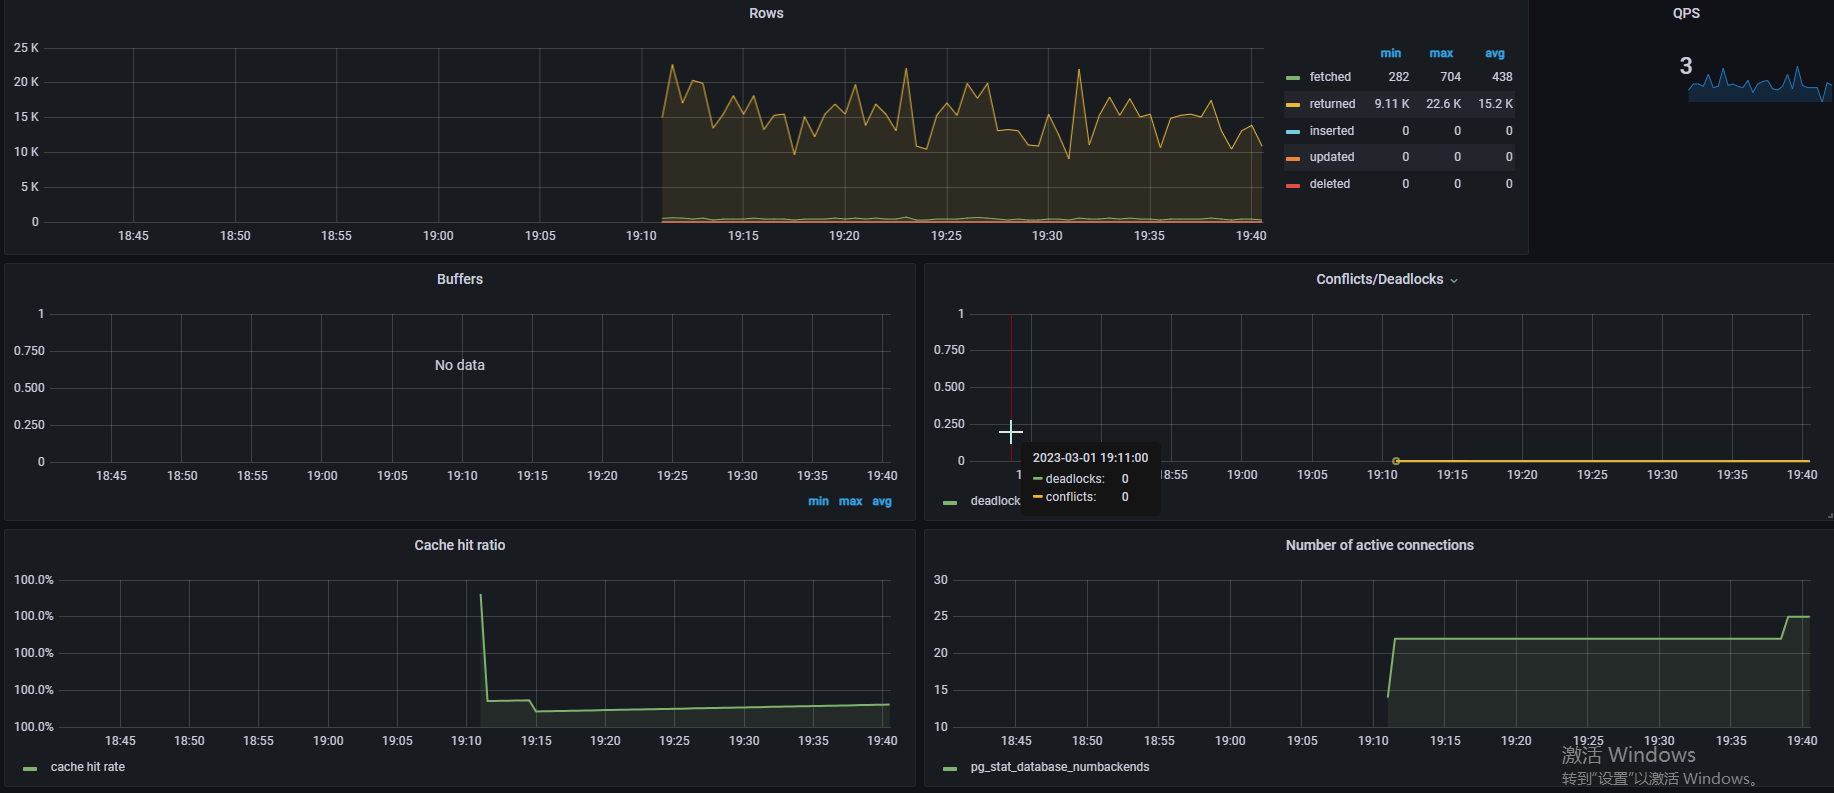
Grafana+prometheus+postgres_exporter参考
四、参考
- Github地址
- postgres_exporter使用过程中的注意事项
相关文章:
【监控】Linux部署postgres_exporter及PG配置(非Docker)
目录一、下载及部署二、postgres_exporter配置1. 停止脚本stop.sh2. 启动脚本start.sh3. queries.yaml三、PostgreSQL数据库配置1. 修改postgresql.conf配置文件2. 创建用户、表、扩展等四、参考一、下载及部署 下载地址 选一个amd64下载 上传至服务器,解压 tax…...

基于Java+SpringBoot+Vue+Uniapp(有教程)前后端分离健身预约系统设计与实现
博主介绍:✌全网粉丝3W,全栈开发工程师,从事多年软件开发,在大厂呆过。持有软件中级、六级等证书。可提供微服务项目搭建与毕业项目实战✌ 博主作品:《微服务实战》专栏是本人的实战经验总结,《Spring家族及…...

【2023】DevOps、SRE、运维开发面试宝典之Redis相关面试题
文章目录 1、redis主从复制原理2、redis哨兵模式的原理3、reids集群原理4、Redis 哈希表进行的触发时机是什么?5、Redis 的 RDB 和 AOF 机制各自的优缺点是什么?这两种机制是否可以混合使用?6、Redis 经常被称为单线程的系统,你如何理解 Redis 的单线程模型7、redis 的事务…...
十五、MyBatis使用PageHelper
1.limit分页 limit分页原理 mysql的limit后面两个数字: 第一个数字:startIndex(起始下标。下标从0开始。) 第二个数字:pageSize(每页显示的记录条数) 假设已知页码pageNum,还有每页…...

【MySQL】B+ 树索引
一、索引是什么 ? 为什么需要索引 ? 索引就是目录,目录就是索引。 索引从 InnoDB 存储引擎数据存储结构上来看,就是为各个页建立的目录。保证我们在查询时,可以通过二分法快速定位到页,再在页内通过二分法…...

Android Gradle Plugin Version 和 Gradle Version 的对应关系
官网参考 以下是插件版本和Gradle 版本对应关系: 插件版本所需的最低 Gradle 版本Android Gradle Plugin VersionGradle Version1.0.0 - 1.1.32.2.1 - 2.31.2.0 - 1.3.12.2.1 - 2.91.5.02.2.1 - 2.132.0.0 - 2.1.22.10 - 2.132.1.3 - 2.2.32.14.1 - 3.52.3.03.33.0…...
)
更多单词/词组/短语补充和总结(二)
auto 美 /[ˈɔːtoʊ] n.汽车adj.与汽车有关的,汽车的。不要记成“自动的” mobile 美 /[ˈmoʊbl] adj.可移动的;流动的;不要记成“手机”,手机是mobile phone automobile 美 /[ˈɔːtəməbiːl] n.汽车adj.自动的 automatic 美 /[ˌɔːtəˈmtɪk]…...

HEC-HMS和HEC-RAS快速入门、防洪评价报告编制及洪水建模、洪水危险性评价等应用
目录 ①HEC-RAS一维、二维建模方法及实践技术应用 ②HEC-HMS水文模型实践技术应用 ③新导则下的防洪评价报告编制方法及洪水建模实践技术应用 ④基于ArcGIS水文分析、HEC-RAS模拟技术在洪水危险性及风险评估 ⑤山洪径流过程模拟及洪水危险性评价 ①HEC-RAS一维、二维建模方…...

全面了解 B 端产品设计 — 基础扫盲篇
在今天,互联网的影响力与作用与日俱增,除了我们日常生活领域的改变以外,对于商业领域的渗透也见效颇丰。 越来越多的企业开始使用数字化的解决方案来助力企业发展,包括日常管理、运营、统计等等。或者通过互联网的方式开发出新的业务形态,进行产业升级,如这几年风头正劲的…...
)
顺序表(增删查改)
目录一、什么是顺序表二、顺序表的增删查改2.1 结构体的声明2.2 顺序表的初始化2.3 顺序表检查容量2.4 顺序表尾部插入数据2.5 顺序表头部插入数据2.6 顺序表尾部删除数据2.7 顺序表头部删除数据2.8 顺序表查找数据2.9 顺序表任意位置插入数据2.10 顺序表任意位置删除数据2.11 …...

一款优秀的低代码开发平台是什么样的?
目录 一、一款优秀的低代码平台应该是什么样的? 二、低代码核心能力 01、全栈可视化编程: 02、全生命周期管理: 03、低代码扩展能力: 三、小结 一、一款优秀的低代码平台应该是什么样的? 从企业角度来说&#x…...
ElasticSearch 学习笔记总结(四)
文章目录一、ES继承 Spring Data 框架二、SpringData 功能集成三、ES SpringData 文档搜索四、ES 优化 硬件选择五、ES 优化 分片策略六、ES 优化 路由选择七、ES 优化 写入速度优化七、ES 优化 内存设置八、ES 优化 重要配置一、ES继承 Spring Data 框架 Spring Data 是一个用…...

HDFS文件块大小
HDFS中的文件在物理上是分块存储(Block),块的大小可以通过配置参数(dfs.blocksize)来规定,默认大小在Hadooop2X版本中是128M,老版本中是64M。 思考:为什么块的大小不能设置太小&…...

C++——优先级队列(priority_queue)的使用及实现
目录 一.priority_queue的使用 1.1、基本介绍 1.2、优先级队列的定义 1.3、基本操作(常见接口的使用) 1.4、重写仿函数支持自定义数据类型 二.priority_queue的模拟实现 2.1、构造&&重要的调整算法 2.2、常见接口的实现 push() pop() top() empt…...

Linux学习记录——십일 环境变量
文章目录1、认识2、通过代码获取环境变量1、手动获取2、函数获取3、重新认识环境变量1、认识 在云服务器上写程序时,最终的执行需要./文件名,点表示当前目录,/是文件分隔符,之后就会打印程序,这是用户的操作ÿ…...
【人工智能 Open AI 】我们程序员真的要下岗了- 全能写Go / C / Java / C++ / Python / JS 人工智能机器人
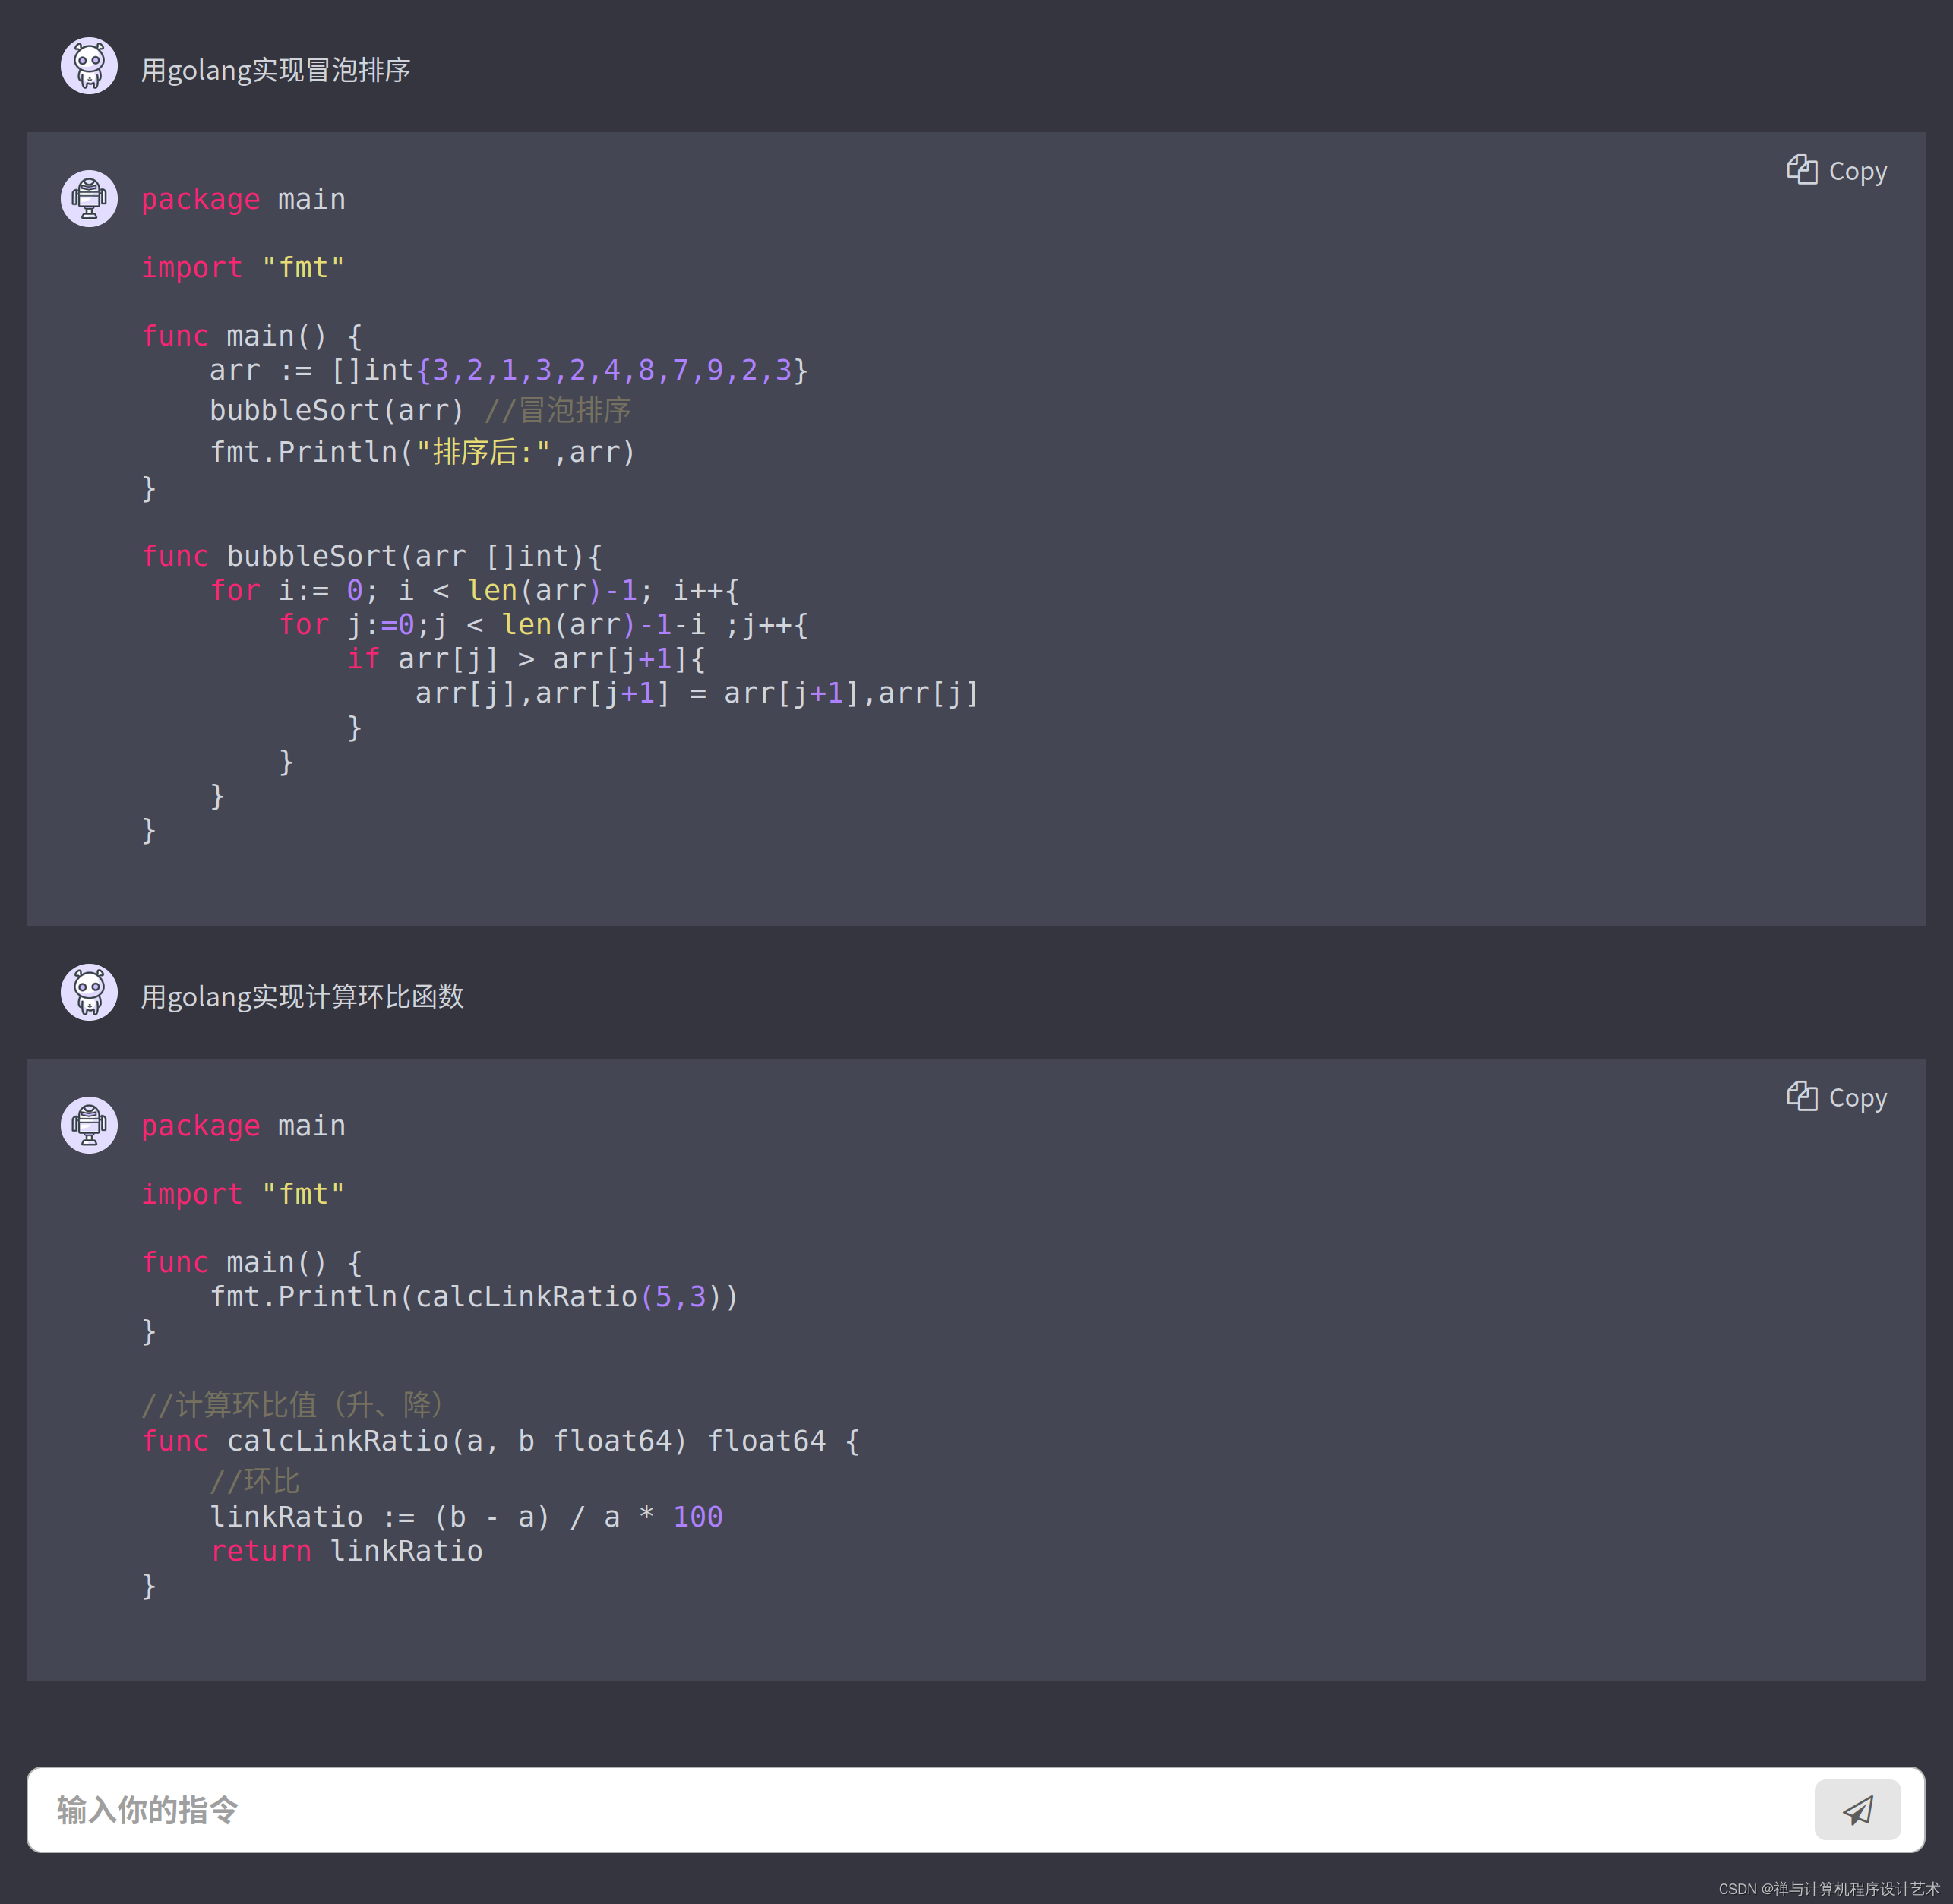
文章目录[toc]人工智能 AI Code 写代码测试用golang实现冒泡排序用golang实现计算环比函数goroutine and channel用golang实现二叉树遍历代码用golang实现线程安全的HashMap操作代码using C programming language write a tiny Operation Systemuse C language write a tiny co…...
STM32 EXTI外部中断
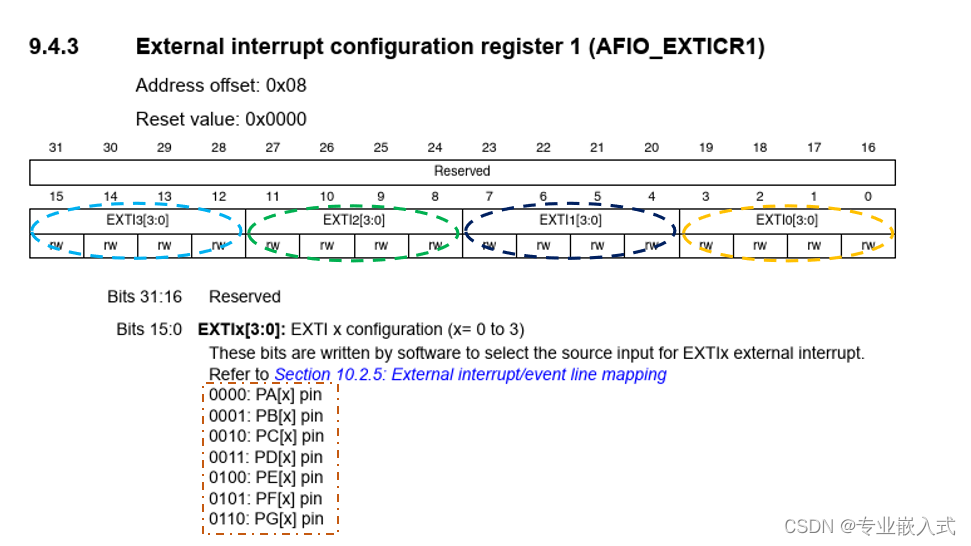
本文代码使用 HAL 库。 文章目录前言一、什么是外部中断?二、外部中断中断线三、STM32F103的引脚复用四、相关函数:总结前言 一、什么是外部中断? 外部中断 是单片机实时地处理外部事件的一种内部机制。当某种外部事件发生时,单片…...
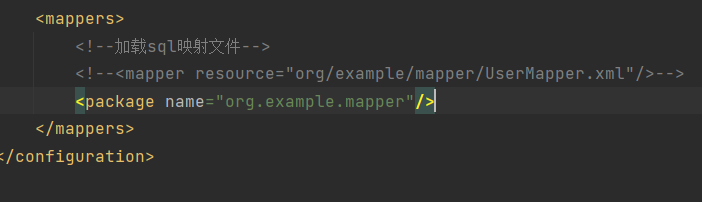
Mapper代理开发——书接MaBatis的简单使用
在这个mybatis的普通使用中依旧存在硬编码问题,虽然静态语句比原生jdbc都写更少了但是还是要写,Mapper就是用来解决原生方式中的硬编码还有简化后期执行SQL UserMapper是一个接口,里面有很多方法,都是一一和配置文件里面的sql语句的id名称所对…...

实体对象说明
1.工具类层Utilutil 工具顾明思义,util层就是存放工具类的地方,对于一些独立性很高的小功能,或重复性很高的代码片段,可以提取出来放到Util层中。2.数据层POJO对象(概念比较大) 包含了以下POJO plain ord…...
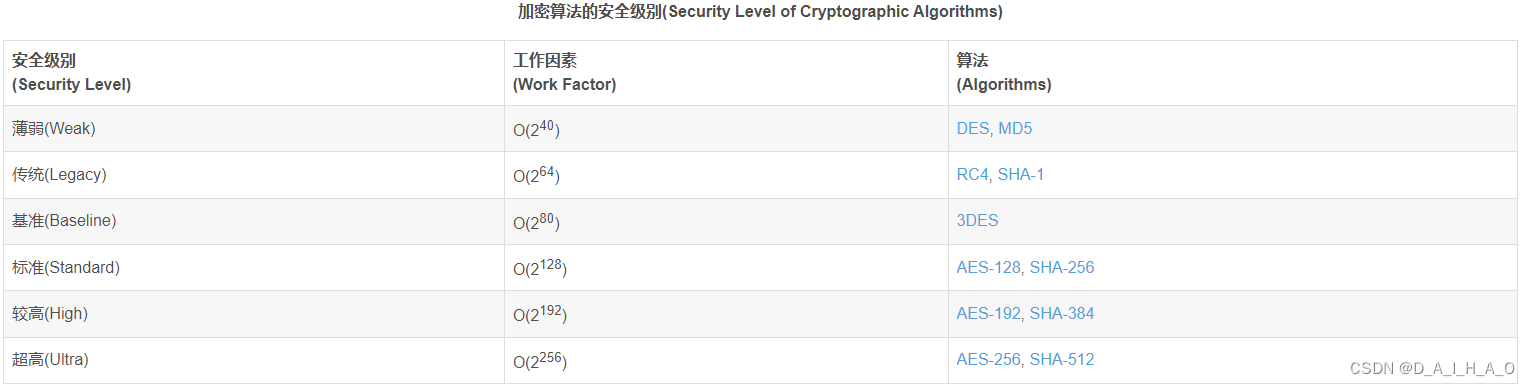
JAVA中加密与解密
BASE64加密/解密 Base64 编码会将字符串编码得到一个含有 A-Za-z0-9/ 的字符串。标准的 Base64 并不适合直接放在URL里传输,因为URL编码器会把标准 Base64 中的“/”和“”字符变为形如 “%XX” 的形式,而这些 “%” 号在存入数据库时还需要再进行转换&…...

基于 4SAPI 的企业文档智能处理系统:效率提升 20 倍,信息提取准确率 95%
前言 在数字化转型的今天,企业积累了海量的非结构化文档数据,包括合同、财务报表、技术手册、产品说明书、会议纪要、法律文件等。这些文档中蕴含着企业最核心的知识和资产,但传统的人工文档处理模式已经成为企业数字化的最大瓶颈࿱…...

ClawSuite:模块化网络安全工具集的设计原理与实战应用
1. 项目概述:ClawSuite,一个被低估的网络安全工具集如果你在网络安全领域摸爬滚打过几年,尤其是做过渗透测试或者红队评估,那你肯定对Metasploit、Nmap、Burp Suite这些名字如数家珍。但今天我想聊一个在GitHub上相对低调…...

别再让数码管显示拖垮你的51单片机!频率计项目中CPU时间分配的优化实战
51单片机频率计项目中的CPU时间优化艺术:从阻塞式刷新到状态机重构 当你在深夜调试51单片机频率计项目时,是否经历过这样的绝望时刻——测量数据明明准确,但数码管显示却闪烁不定;或者当输入信号频率升高时,整个系统突…...

免费LLM API资源全攻略:从开源模型到工程化实践
1. 项目概述:一个汇集免费LLM API资源的宝藏仓库 如果你正在开发一个需要集成大语言模型(LLM)的应用,无论是聊天机器人、内容生成工具,还是数据分析助手,第一个拦路虎往往就是API成本。OpenAI、Anthropic这…...
)
告别串口助手:用STM32CubeIDE和HAL库,手把手教你打造自己的IAP上位机(附源码)
从零构建STM32 IAP上位机:C#实战与协议解析全指南 在嵌入式开发中,IAP(In Application Programming)技术为设备固件升级提供了极大便利,但一个稳定可靠的上位机软件往往是整个流程中最薄弱的环节。市面上通用的串口助手…...

CentOS 8系统下EMQX 4.3.8安装避坑实录:解决crypto和libncurses依赖报错
CentOS 8系统下EMQX 4.3.8深度部署指南:从依赖解析到高可用架构 在物联网和边缘计算领域,MQTT协议凭借其轻量级和高效性已成为设备通信的事实标准。而EMQX作为基于Erlang/OTP平台开发的开源MQTT消息服务器,其单节点支持200万连接的能力使其成…...

从虚拟到物理:电子系统原型设计的工程化策略与实战解析
1. 原型设计全景:从概念到实物的工程化思维 在电子系统设计领域,尤其是面对航空航天、汽车电子、通信设备这类高复杂、高可靠性要求的项目时,“原型”这个词的分量远超一个简单的模型。它不是一个可有可无的步骤,而是连接创意与产…...

Windows 10/11终极指南:如何快速解决PL2303驱动兼容性问题
Windows 10/11终极指南:如何快速解决PL2303驱动兼容性问题 【免费下载链接】pl2303-win10 Windows 10 driver for end-of-life PL-2303 chipsets. 项目地址: https://gitcode.com/gh_mirrors/pl/pl2303-win10 还在为Windows 10/11系统上的PL2303串口设备无法…...

AI智能体安全策略引擎:AgentEnforcer框架设计与实战应用
1. 项目概述:一个为AI智能体量身定制的“行为守门员” 最近在折腾AI智能体(Agent)的开发,尤其是在构建那些需要自主执行任务、与外部API交互的复杂系统时,一个核心痛点总是挥之不去: 如何确保智能体的行为…...

从Hello-World到Nginx:5个真实案例详解如何让Docker容器在后台稳定运行
从Hello-World到Nginx:5个真实案例详解如何让Docker容器在后台稳定运行 当你在终端输入docker run后,容器却像一阵风一样消失无踪——这种"闪退"现象往往是Docker新手遭遇的第一个认知颠覆点。不同于传统虚拟机,容器本质上是隔离的…...