nginx+rsyslog+kafka+clickhouse+grafana 实现nginx 网关监控
需求
- 我想做一个类似腾讯云网关日志最终以仪表方式呈现,比如说qps、p99、p95的请求响应时间等等
流程图
数据流转就像标题
nginx ----> rsyslog ----> kafka —> clickhouse —> grafana
部署
kafka
kafka 相关部署这里不做赘述,只要创建一个topic 就可以
这里kafka地址是 192.168.1.180,topic是``
rsyslog 设置
rsyslog 具体是啥东西这个我这里也不做介绍,本人也是一个后端开发不是做运维的,只知道这个东西性能不错,算是logstash 平替把
# 安装rsyslog-kafka 插件
yum install -y rsyslog-kafka
# 创建一个配置vim /etc/rsyslog.d/rsyslog_nginx_kafka_cluster.conf
conf 内容
module(load="imudp")
input(type="imudp" port="514")# nginx access log ==> rsyslog server(local) ==> kafka
module(load="omkafka")template(name="nginxLog" type="string" string="%msg%")if $inputname == "imudp" then {# 这里的名字和下面nginx 配置tag 相同if ($programname == "nginx_access_log") thenaction(type="omkafka"template="nginxLog"# kafka 地址broker=["192.168.1.180:9092"]# topic 名字topic="rsyslog_nginx"partitions.auto="on"confParam=["socket.keepalive.enable=true"])
}:rawmsg, contains, "nginx_access_log" ~
最后重启rsyslog 即可
nginx
http 节点中设置如下
log_format jsonlog '{''"host": "$host",''"server_addr": "$server_addr",''"remote_addr":"$remote_addr",''"time_format":"$time_ms",''"time_sec":$times,''"timestamp":$timestamp,''"method":"$request_method",''"request_url":"$request_uri",''"status":$status,''"upstream_name":"$upstream_name",''"http_user_agent":"$http_user_agent",''"upstream_addr":"$upstream_addr",''"trace_id":"$http_traceid",''"upstream_status":"$upstream_status",''"upstream_response_time":"$upstream_response_time",''"request_time":$request_time,''"nginx_host":"$nginx_host"''}';# 配置rsyslog,tag 和上文rsyslog 中相同!!!access_log syslog:server=192.168.1.179,facility=local7,tag=nginx_access_log,severity=info jsonlog;#access_log /var/log/nginx/access.log jsonlog;
配置实际转发upstream
upstream testcontrol{server 192.168.10.123:8081;
}server {listen       18081;server_name  _;# 设置up nameset $upstream_name 'testcontrol';include /etc/nginx/conf/time.conf;location / {proxy_set_header traceid $http_traceid;proxy_set_header n-t $msec;#proxy_set_header X-Real-IP $remote_addr;proxy_pass http://testcontrol;}location ~ /status {stub_status   on;}
}
/etc/nginx/conf/time.conf; 配置
set $nginx_host '192.168.8.64';
if ($time_iso8601 ~ "^(\d{4})-(\d{2})-(\d{2})T(\d{2}):(\d{2}):(\d{2})") {set $year $1;set $month $2;set $day $3;set $hour $4;set $minutes $5;set $seconds $6;set $time_sec "$1-$2-$3 $4:$5:$6";}# 获取毫秒时间戳,并拼接到$time_zh之后if ($msec ~ "(\d+)\.(\d+)") {# 时间戳-msset $timestamp $1$2;# 时间戳-sset $times $1;# 格式化之后的时间msset $time_ms $time_sec.$2;# traceId,方便查日志set $http_traceid $nginx_host#$timestamp#$request_id;
}
clickhouse
先创建一个 nginx_gw_log 表
create table app_logs.nginx_gw_log
(timestamp              DateTime64(3, 'Asia/Shanghai'),server_addr            String,remote_addr            String,time_sec               DateTime('Asia/Shanghai'),method                 String,request_url            String,status                 Int16,upstream_name          String,http_user_agent        String,upstream_addr          String,trace_id               String,upstream_status        String,upstream_response_time String,request_time           Int32,nginx_host              String,host                   String
) engine = MergeTree PARTITION BY toYYYYMMDD(timestamp)ORDER BY timestampTTL toDateTime(timestamp) + toIntervalDay(1);
上面设置了过期1天,可以自由修改
添加kafka 引擎
create table app_logs.nginx_gw_log_kafka
(timestamp              DateTime64(3, 'Asia/Shanghai'),server_addr            String,remote_addr            String,time_sec               DateTime('Asia/Shanghai'),method                 String,request_url            String,status                 Int32,upstream_name          String,http_user_agent        String,upstream_addr          String,trace_id               String,upstream_status        String,upstream_response_time String,request_time           Decimal32(3),nginx_host              String,host                   String
) engine = Kafka()SETTINGS kafka_broker_list = '192.168.1.180:9092',kafka_topic_list = 'rsyslog_nginx',kafka_group_name = 'nginx_ck',kafka_format = 'JSONEachRow',kafka_skip_broken_messages = 100000,kafka_num_consumers = 1;
最后设置mv
CREATE MATERIALIZED VIEW app_logs.nginx_gw_log_mv TO app_logs.nginx_gw_log AS
SELECT timestamp,server_addr,remote_addr,time_sec,method,request_url,status,upstream_name,http_user_agent,upstream_addr,trace_id,upstream_status,upstream_response_time,toInt32(multiply(request_time, 1000)) as request_time,host
FROM app_logs.nginx_gw_log_kafka;
这里做了一个类型转换,因为nginx,request-time 单位是s,我想最终呈现在grafana 中是ms,所以这里做了转换,当然grafana中也可以做
上面都配置完了之后可以先验证下,保证数据最终到ck,如果有问题,需要再每个节点调试,比如先调试nginx->rsyslog ,可以先不配置kafka 输出,配置为console或者文件输出都可以,具体这里就不写了
grafana
{"annotations": {"list": [{"builtIn": 1,"datasource": {"type": "grafana","uid": "-- Grafana --"},"enable": true,"hide": true,"iconColor": "rgba(0, 211, 255, 1)","name": "Annotations & Alerts","target": {"limit": 100,"matchAny": false,"tags": [],"type": "dashboard"},"type": "dashboard"}]},"editable": true,"fiscalYearStartMonth": 0,"graphTooltip": 0,"id": 17,"links": [],"liveNow": false,"panels": [{"datasource": {"type": "grafana-clickhouse-datasource","uid": "${datasource}"},"fieldConfig": {"defaults": {"color": {"mode": "palette-classic"},"custom": {"axisCenteredZero": false,"axisColorMode": "text","axisLabel": "","axisPlacement": "auto","barAlignment": 0,"drawStyle": "line","fillOpacity": 0,"gradientMode": "none","hideFrom": {"legend": false,"tooltip": false,"viz": false},"lineInterpolation": "linear","lineWidth": 1,"pointSize": 5,"scaleDistribution": {"type": "linear"},"showPoints": "auto","spanNulls": false,"stacking": {"group": "A","mode": "none"},"thresholdsStyle": {"mode": "off"}},"mappings": [],"thresholds": {"mode": "absolute","steps": [{"color": "green","value": null},{"color": "red","value": 80}]}},"overrides": []},"gridPos": {"h": 9,"w": 12,"x": 0,"y": 0},"id": 2,"options": {"legend": {"calcs": [],"displayMode": "list","placement": "bottom","showLegend": true},"tooltip": {"mode": "single","sort": "none"}},"pluginVersion": "9.1.1","targets": [{"builderOptions": {"database": "app_logs","fields": [],"filters": [{"condition": "AND","filterType": "custom","key": "timestamp","operator": "WITH IN DASHBOARD TIME RANGE","restrictToFields": [{"label": "timestamp","name": "timestamp","picklistValues": [],"type": "DateTime64(3, 'Asia/Shanghai')"},{"label": "startTime","name": "startTime","picklistValues": [],"type": "DateTime64(3, 'Asia/Shanghai')"}],"type": "datetime"}],"groupBy": [],"limit": 100,"metrics": [{"aggregation": "count","field": ""}],"mode": "list","orderBy": [],"table": "tk_wx_control_req_kafka","timeField": "timestamp","timeFieldType": "DateTime64(3, 'Asia/Shanghai')"},"datasource": {"type": "grafana-clickhouse-datasource","uid": "${datasource}"},"format": 1,"meta": {"builderOptions": {"database": "app_logs","fields": [],"filters": [{"condition": "AND","filterType": "custom","key": "timestamp","operator": "WITH IN DASHBOARD TIME RANGE","restrictToFields": [{"label": "timestamp","name": "timestamp","picklistValues": [],"type": "DateTime64(3, 'Asia/Shanghai')"},{"label": "startTime","name": "startTime","picklistValues": [],"type": "DateTime64(3, 'Asia/Shanghai')"}],"type": "datetime"}],"groupBy": [],"limit": 100,"metrics": [{"aggregation": "count","field": ""}],"mode": "list","orderBy": [],"table": "tk_wx_control_req_kafka","timeField": "timestamp","timeFieldType": "DateTime64(3, 'Asia/Shanghai')"}},"queryType": "sql","rawSql": "SELECT time_sec as a, count() as num FROM \"app_logs\".${table_name} where ( timestamp  >= $__fromTime AND timestamp <= $__toTime )\r\ngroup by a order by a desc ;\r\n","refId": "A","selectedFormat": 4}],"title": "qps","type": "timeseries"},{"datasource": {"type": "grafana-clickhouse-datasource","uid": "${datasource}"},"fieldConfig": {"defaults": {"color": {"mode": "palette-classic"},"custom": {"axisCenteredZero": false,"axisColorMode": "text","axisLabel": "","axisPlacement": "auto","barAlignment": 0,"drawStyle": "line","fillOpacity": 0,"gradientMode": "none","hideFrom": {"legend": false,"tooltip": false,"viz": false},"lineInterpolation": "linear","lineWidth": 1,"pointSize": 5,"scaleDistribution": {"type": "linear"},"showPoints": "auto","spanNulls": false,"stacking": {"group": "A","mode": "none"},"thresholdsStyle": {"mode": "off"}},"mappings": [],"thresholds": {"mode": "absolute","steps": [{"color": "green","value": null},{"color": "red","value": 80}]}},"overrides": []},"gridPos": {"h": 9,"w": 12,"x": 12,"y": 0},"id": 3,"options": {"legend": {"calcs": [],"displayMode": "list","placement": "bottom","showLegend": true},"tooltip": {"mode": "single","sort": "none"}},"pluginVersion": "9.1.1","targets": [{"builderOptions": {"database": "app_logs","fields": [],"filters": [{"condition": "AND","filterType": "custom","key": "timestamp","operator": "WITH IN DASHBOARD TIME RANGE","restrictToFields": [{"label": "timestamp","name": "timestamp","picklistValues": [],"type": "DateTime64(3, 'Asia/Shanghai')"},{"label": "startTime","name": "startTime","picklistValues": [],"type": "DateTime64(3, 'Asia/Shanghai')"}],"type": "datetime"}],"groupBy": [],"limit": 100,"metrics": [{"aggregation": "count","field": ""}],"mode": "list","orderBy": [],"table": "tk_wx_control_req_kafka","timeField": "timestamp","timeFieldType": "DateTime64(3, 'Asia/Shanghai')"},"datasource": {"type": "grafana-clickhouse-datasource","uid": "${datasource}"},"format": 1,"meta": {"builderOptions": {"database": "app_logs","fields": [],"filters": [{"condition": "AND","filterType": "custom","key": "timestamp","operator": "WITH IN DASHBOARD TIME RANGE","restrictToFields": [{"label": "timestamp","name": "timestamp","picklistValues": [],"type": "DateTime64(3, 'Asia/Shanghai')"},{"label": "startTime","name": "startTime","picklistValues": [],"type": "DateTime64(3, 'Asia/Shanghai')"}],"type": "datetime"}],"groupBy": [],"limit": 100,"metrics": [{"aggregation": "count","field": ""}],"mode": "list","orderBy": [],"table": "tk_wx_control_req_kafka","timeField": "timestamp","timeFieldType": "DateTime64(3, 'Asia/Shanghai')"}},"queryType": "sql","rawSql": "SELECT time_sec as a, toInt32(quantile(0.95)(request_time))  as num FROM \"app_logs\".${table_name} where ( timestamp  >= $__fromTime AND timestamp <= $__toTime )\r\ngroup by a order by a desc ;","refId": "p95","selectedFormat": 4},{"builderOptions": {"database": "app_logs","fields": [],"filters": [{"condition": "AND","filterType": "custom","key": "timestamp","operator": "WITH IN DASHBOARD TIME RANGE","restrictToFields": [{"label": "timestamp","name": "timestamp","picklistValues": [],"type": "DateTime64(3, 'Asia/Shanghai')"},{"label": "startTime","name": "startTime","picklistValues": [],"type": "DateTime64(3, 'Asia/Shanghai')"}],"type": "datetime"}],"groupBy": [],"limit": 100,"metrics": [{"aggregation": "count","field": ""}],"mode": "list","orderBy": [],"table": "tk_wx_control_req_kafka","timeField": "timestamp","timeFieldType": "DateTime64(3, 'Asia/Shanghai')"},"datasource": {"type": "grafana-clickhouse-datasource","uid": "${datasource}"},"format": 1,"hide": false,"meta": {"builderOptions": {"database": "app_logs","fields": [],"filters": [{"condition": "AND","filterType": "custom","key": "timestamp","operator": "WITH IN DASHBOARD TIME RANGE","restrictToFields": [{"label": "timestamp","name": "timestamp","picklistValues": [],"type": "DateTime64(3, 'Asia/Shanghai')"},{"label": "startTime","name": "startTime","picklistValues": [],"type": "DateTime64(3, 'Asia/Shanghai')"}],"type": "datetime"}],"groupBy": [],"limit": 100,"metrics": [{"aggregation": "count","field": ""}],"mode": "list","orderBy": [],"table": "tk_wx_control_req_kafka","timeField": "timestamp","timeFieldType": "DateTime64(3, 'Asia/Shanghai')"}},"queryType": "sql","rawSql": "SELECT time_sec as a, toInt32(quantile(0.99)(request_time))  as num FROM \"app_logs\".${table_name} where ( timestamp  >= $__fromTime AND timestamp <= $__toTime )\r\ngroup by a order by a desc ;","refId": "p99","selectedFormat": 4}],"title": "响应时间统计","type": "timeseries"},{"datasource": {"type": "grafana-clickhouse-datasource","uid": "${datasource}"},"fieldConfig": {"defaults": {"color": {"mode": "thresholds"},"custom": {"align": "auto","displayMode": "auto","inspect": false},"mappings": [],"thresholds": {"mode": "absolute","steps": [{"color": "green","value": null},{"color": "red","value": 80}]}},"overrides": []},"gridPos": {"h": 9,"w": 12,"x": 0,"y": 9},"id": 4,"options": {"footer": {"fields": "","reducer": ["sum"],"show": false},"showHeader": true},"pluginVersion": "9.1.1","targets": [{"builderOptions": {"database": "app_logs","fields": [],"filters": [{"condition": "AND","filterType": "custom","key": "timestamp","operator": "WITH IN DASHBOARD TIME RANGE","restrictToFields": [{"label": "timestamp","name": "timestamp","picklistValues": [],"type": "DateTime64(3, 'Asia/Shanghai')"},{"label": "startTime","name": "startTime","picklistValues": [],"type": "DateTime64(3, 'Asia/Shanghai')"}],"type": "datetime"}],"groupBy": [],"limit": 100,"metrics": [{"aggregation": "count","field": ""}],"mode": "list","orderBy": [],"table": "tk_wx_control_req_kafka","timeField": "timestamp","timeFieldType": "DateTime64(3, 'Asia/Shanghai')"},"datasource": {"type": "grafana-clickhouse-datasource","uid": "${datasource}"},"format": 1,"meta": {"builderOptions": {"database": "app_logs","fields": [],"filters": [{"condition": "AND","filterType": "custom","key": "timestamp","operator": "WITH IN DASHBOARD TIME RANGE","restrictToFields": [{"label": "timestamp","name": "timestamp","picklistValues": [],"type": "DateTime64(3, 'Asia/Shanghai')"},{"label": "startTime","name": "startTime","picklistValues": [],"type": "DateTime64(3, 'Asia/Shanghai')"}],"type": "datetime"}],"groupBy": [],"limit": 100,"metrics": [{"aggregation": "count","field": ""}],"mode": "list","orderBy": [],"table": "tk_wx_control_req_kafka","timeField": "timestamp","timeFieldType": "DateTime64(3, 'Asia/Shanghai')"}},"queryType": "sql","rawSql": "SELECT request_time as k,request_url,trace_id  FROM \"app_logs\".${table_name} where ( timestamp  >= $__fromTime AND timestamp <= $__toTime )\r\n order by k desc limit 10;\r\n","refId": "A","selectedFormat": 4}],"title": "最耗时","type": "table"},{"datasource": {"type": "grafana-clickhouse-datasource","uid": "${datasource}"},"fieldConfig": {"defaults": {"color": {"mode": "thresholds"},"custom": {"align": "auto","displayMode": "auto","inspect": false},"mappings": [],"thresholds": {"mode": "absolute","steps": [{"color": "green","value": null},{"color": "red","value": 80}]}},"overrides": []},"gridPos": {"h": 9,"w": 12,"x": 12,"y": 9},"id": 5,"options": {"footer": {"fields": "","reducer": ["sum"],"show": false},"showHeader": true},"pluginVersion": "9.1.1","targets": [{"builderOptions": {"database": "app_logs","fields": [],"filters": [{"condition": "AND","filterType": "custom","key": "timestamp","operator": "WITH IN DASHBOARD TIME RANGE","restrictToFields": [{"label": "timestamp","name": "timestamp","picklistValues": [],"type": "DateTime64(3, 'Asia/Shanghai')"},{"label": "startTime","name": "startTime","picklistValues": [],"type": "DateTime64(3, 'Asia/Shanghai')"}],"type": "datetime"}],"groupBy": [],"limit": 100,"metrics": [{"aggregation": "count","field": ""}],"mode": "list","orderBy": [],"table": "tk_wx_control_req_kafka","timeField": "timestamp","timeFieldType": "DateTime64(3, 'Asia/Shanghai')"},"datasource": {"type": "grafana-clickhouse-datasource","uid": "${datasource}"},"format": 1,"meta": {"builderOptions": {"database": "app_logs","fields": [],"filters": [{"condition": "AND","filterType": "custom","key": "timestamp","operator": "WITH IN DASHBOARD TIME RANGE","restrictToFields": [{"label": "timestamp","name": "timestamp","picklistValues": [],"type": "DateTime64(3, 'Asia/Shanghai')"},{"label": "startTime","name": "startTime","picklistValues": [],"type": "DateTime64(3, 'Asia/Shanghai')"}],"type": "datetime"}],"groupBy": [],"limit": 100,"metrics": [{"aggregation": "count","field": ""}],"mode": "list","orderBy": [],"table": "tk_wx_control_req_kafka","timeField": "timestamp","timeFieldType": "DateTime64(3, 'Asia/Shanghai')"}},"queryType": "sql","rawSql": "SELECT request_url, count() as num FROM \"app_logs\".${table_name} where ( timestamp  >= $__fromTime AND timestamp <= $__toTime )\r\ngroup by request_url order by request_url desc ;","refId": "A","selectedFormat": 4}],"title": "接口请求数量","type": "table"},{"datasource": {"type": "grafana-clickhouse-datasource","uid": "${datasource}"},"fieldConfig": {"defaults": {"custom": {"align": "auto","displayMode": "auto","inspect": false},"mappings": [],"thresholds": {"mode": "absolute","steps": [{"color": "green","value": null},{"color": "red","value": 80}]}},"overrides": []},"gridPos": {"h": 9,"w": 12,"x": 0,"y": 18},"id": 6,"options": {"footer": {"fields": "","reducer": ["sum"],"show": false},"showHeader": true},"pluginVersion": "9.1.1","targets": [{"builderOptions": {"database": "app_logs","fields": [],"filters": [{"condition": "AND","filterType": "custom","key": "timestamp","operator": "WITH IN DASHBOARD TIME RANGE","restrictToFields": [{"label": "timestamp","name": "timestamp","picklistValues": [],"type": "DateTime64(3, 'Asia/Shanghai')"},{"label": "startTime","name": "startTime","picklistValues": [],"type": "DateTime64(3, 'Asia/Shanghai')"}],"type": "datetime"}],"groupBy": [],"limit": 100,"metrics": [{"aggregation": "count","field": ""}],"mode": "list","orderBy": [],"table": "tk_wx_control_req_kafka","timeField": "timestamp","timeFieldType": "DateTime64(3, 'Asia/Shanghai')"},"datasource": {"type": "grafana-clickhouse-datasource","uid": "${datasource}"},"format": 1,"meta": {"builderOptions": {"database": "app_logs","fields": [],"filters": [{"condition": "AND","filterType": "custom","key": "timestamp","operator": "WITH IN DASHBOARD TIME RANGE","restrictToFields": [{"label": "timestamp","name": "timestamp","picklistValues": [],"type": "DateTime64(3, 'Asia/Shanghai')"},{"label": "startTime","name": "startTime","picklistValues": [],"type": "DateTime64(3, 'Asia/Shanghai')"}],"type": "datetime"}],"groupBy": [],"limit": 100,"metrics": [{"aggregation": "count","field": ""}],"mode": "list","orderBy": [],"table": "tk_wx_control_req_kafka","timeField": "timestamp","timeFieldType": "DateTime64(3, 'Asia/Shanghai')"}},"queryType": "sql","rawSql": "SELECT DISTINCT host  FROM \"app_logs\".${table_name} where ( timestamp  >= $__fromTime AND timestamp <= $__toTime );\r\n","refId": "A","selectedFormat": 4}],"title": "upstream","type": "table"},{"datasource": {"type": "grafana-clickhouse-datasource","uid": "${datasource}"},"fieldConfig": {"defaults": {"custom": {"align": "auto","displayMode": "auto","inspect": false},"mappings": [],"thresholds": {"mode": "absolute","steps": [{"color": "green","value": null},{"color": "red","value": 80}]}},"overrides": []},"gridPos": {"h": 9,"w": 12,"x": 12,"y": 18},"id": 8,"options": {"footer": {"fields": "","reducer": ["sum"],"show": false},"showHeader": true},"pluginVersion": "9.1.1","targets": [{"builderOptions": {"database": "app_logs","fields": [],"filters": [{"condition": "AND","filterType": "custom","key": "timestamp","operator": "WITH IN DASHBOARD TIME RANGE","restrictToFields": [{"label": "timestamp","name": "timestamp","picklistValues": [],"type": "DateTime64(3, 'Asia/Shanghai')"},{"label": "startTime","name": "startTime","picklistValues": [],"type": "DateTime64(3, 'Asia/Shanghai')"}],"type": "datetime"}],"groupBy": [],"limit": 100,"metrics": [{"aggregation": "count","field": ""}],"mode": "list","orderBy": [],"table": "tk_wx_control_req_kafka","timeField": "timestamp","timeFieldType": "DateTime64(3, 'Asia/Shanghai')"},"datasource": {"type": "grafana-clickhouse-datasource","uid": "${datasource}"},"format": 1,"meta": {"builderOptions": {"database": "app_logs","fields": [],"filters": [{"condition": "AND","filterType": "custom","key": "timestamp","operator": "WITH IN DASHBOARD TIME RANGE","restrictToFields": [{"label": "timestamp","name": "timestamp","picklistValues": [],"type": "DateTime64(3, 'Asia/Shanghai')"},{"label": "startTime","name": "startTime","picklistValues": [],"type": "DateTime64(3, 'Asia/Shanghai')"}],"type": "datetime"}],"groupBy": [],"limit": 100,"metrics": [{"aggregation": "count","field": ""}],"mode": "list","orderBy": [],"table": "tk_wx_control_req_kafka","timeField": "timestamp","timeFieldType": "DateTime64(3, 'Asia/Shanghai')"}},"queryType": "sql","rawSql": "SELECT  upstream_status,count() as num  FROM \"app_logs\".${table_name} where ( timestamp  >= $__fromTime AND timestamp <= $__toTime ) group by upstream_status;\r\n","refId": "A","selectedFormat": 4}],"title": "upstream","type": "table"},{"datasource": {"type": "grafana-clickhouse-datasource","uid": "${datasource}"},"fieldConfig": {"defaults": {"mappings": [],"thresholds": {"mode": "percentage","steps": [{"color": "green","value": null},{"color": "orange","value": 70},{"color": "red","value": 85}]}},"overrides": []},"gridPos": {"h": 9,"w": 12,"x": 12,"y": 27},"id": 7,"options": {"orientation": "auto","reduceOptions": {"calcs": ["lastNotNull"],"fields": "","values": false},"showThresholdLabels": false,"showThresholdMarkers": true},"pluginVersion": "9.1.1","targets": [{"builderOptions": {"database": "app_logs","fields": [],"filters": [{"condition": "AND","filterType": "custom","key": "timestamp","operator": "WITH IN DASHBOARD TIME RANGE","restrictToFields": [{"label": "timestamp","name": "timestamp","picklistValues": [],"type": "DateTime64(3, 'Asia/Shanghai')"},{"label": "startTime","name": "startTime","picklistValues": [],"type": "DateTime64(3, 'Asia/Shanghai')"}],"type": "datetime"}],"groupBy": [],"limit": 100,"metrics": [{"aggregation": "count","field": ""}],"mode": "list","orderBy": [],"table": "tk_wx_control_req_kafka","timeField": "timestamp","timeFieldType": "DateTime64(3, 'Asia/Shanghai')"},"datasource": {"type": "grafana-clickhouse-datasource","uid": "${datasource}"},"format": 1,"meta": {"builderOptions": {"database": "app_logs","fields": [],"filters": [{"condition": "AND","filterType": "custom","key": "timestamp","operator": "WITH IN DASHBOARD TIME RANGE","restrictToFields": [{"label": "timestamp","name": "timestamp","picklistValues": [],"type": "DateTime64(3, 'Asia/Shanghai')"},{"label": "startTime","name": "startTime","picklistValues": [],"type": "DateTime64(3, 'Asia/Shanghai')"}],"type": "datetime"}],"groupBy": [],"limit": 100,"metrics": [{"aggregation": "count","field": ""}],"mode": "list","orderBy": [],"table": "tk_wx_control_req_kafka","timeField": "timestamp","timeFieldType": "DateTime64(3, 'Asia/Shanghai')"}},"queryType": "sql","rawSql": "SELECT count()  FROM \"app_logs\".${table_name} where ( timestamp  >= $__fromTime AND timestamp <= $__toTime );\r\n","refId": "A","selectedFormat": 4}],"title": "请求总数","type": "gauge"}],"schemaVersion": 37,"style": "dark","tags": [],"templating": {"list": [{"current": {"selected": false,"text": "nginx_gw_log","value": "nginx_gw_log"},"datasource": {"type": "grafana-clickhouse-datasource","uid": "${datasource}"},"definition": "show  tables from app_logs where name = 'nginx_gw_log' ","hide": 0,"includeAll": false,"label": "table_name","multi": false,"name": "table_name","options": [],"query": "show  tables from app_logs where name = 'nginx_gw_log' ","refresh": 1,"regex": "","skipUrlSync": false,"sort": 0,"type": "query"},{"current": {"selected": false,"text": "ClickHouse_1.178","value": "ClickHouse_1.178"},"hide": 0,"includeAll": false,"label": "datasource","multi": false,"name": "datasource","options": [],"query": "grafana-clickhouse-datasource","queryValue": "","refresh": 1,"regex": "","skipUrlSync": false,"type": "datasource"},{"current": {"isNone": true,"selected": false,"text": "None","value": ""},"datasource": {"type": "grafana-clickhouse-datasource","uid": "${datasource}"},"definition": "select upstream_name from app_logs.nginx_gw_log","hide": 0,"includeAll": false,"label": "upstream_name","multi": false,"name": "upstream_name","options": [],"query": "select upstream_name from app_logs.nginx_gw_log","refresh": 2,"regex": "","skipUrlSync": false,"sort": 0,"type": "query"},{"current": {"isNone": true,"selected": false,"text": "None","value": ""},"datasource": {"type": "grafana-clickhouse-datasource","uid": "${datasource}"},"definition": "select nginx_host from app_logs.nginx_gw_log where upstream_name = \"$upstream_name\"","hide": 0,"includeAll": false,"label": "nginx_host","multi": false,"name": "nginx_host","options": [],"query": "select nginx_host from app_logs.nginx_gw_log where upstream_name = \"$upstream_name\"","refresh": 1,"regex": "","skipUrlSync": false,"sort": 0,"type": "query"}]},"time": {"from": "now-5m","to": "now"},"timepicker": {},"timezone": "","title": "nginx_gw","uid": "lZrbSYOIkA","version": 6,"weekStart": ""
}
最终呈现效果
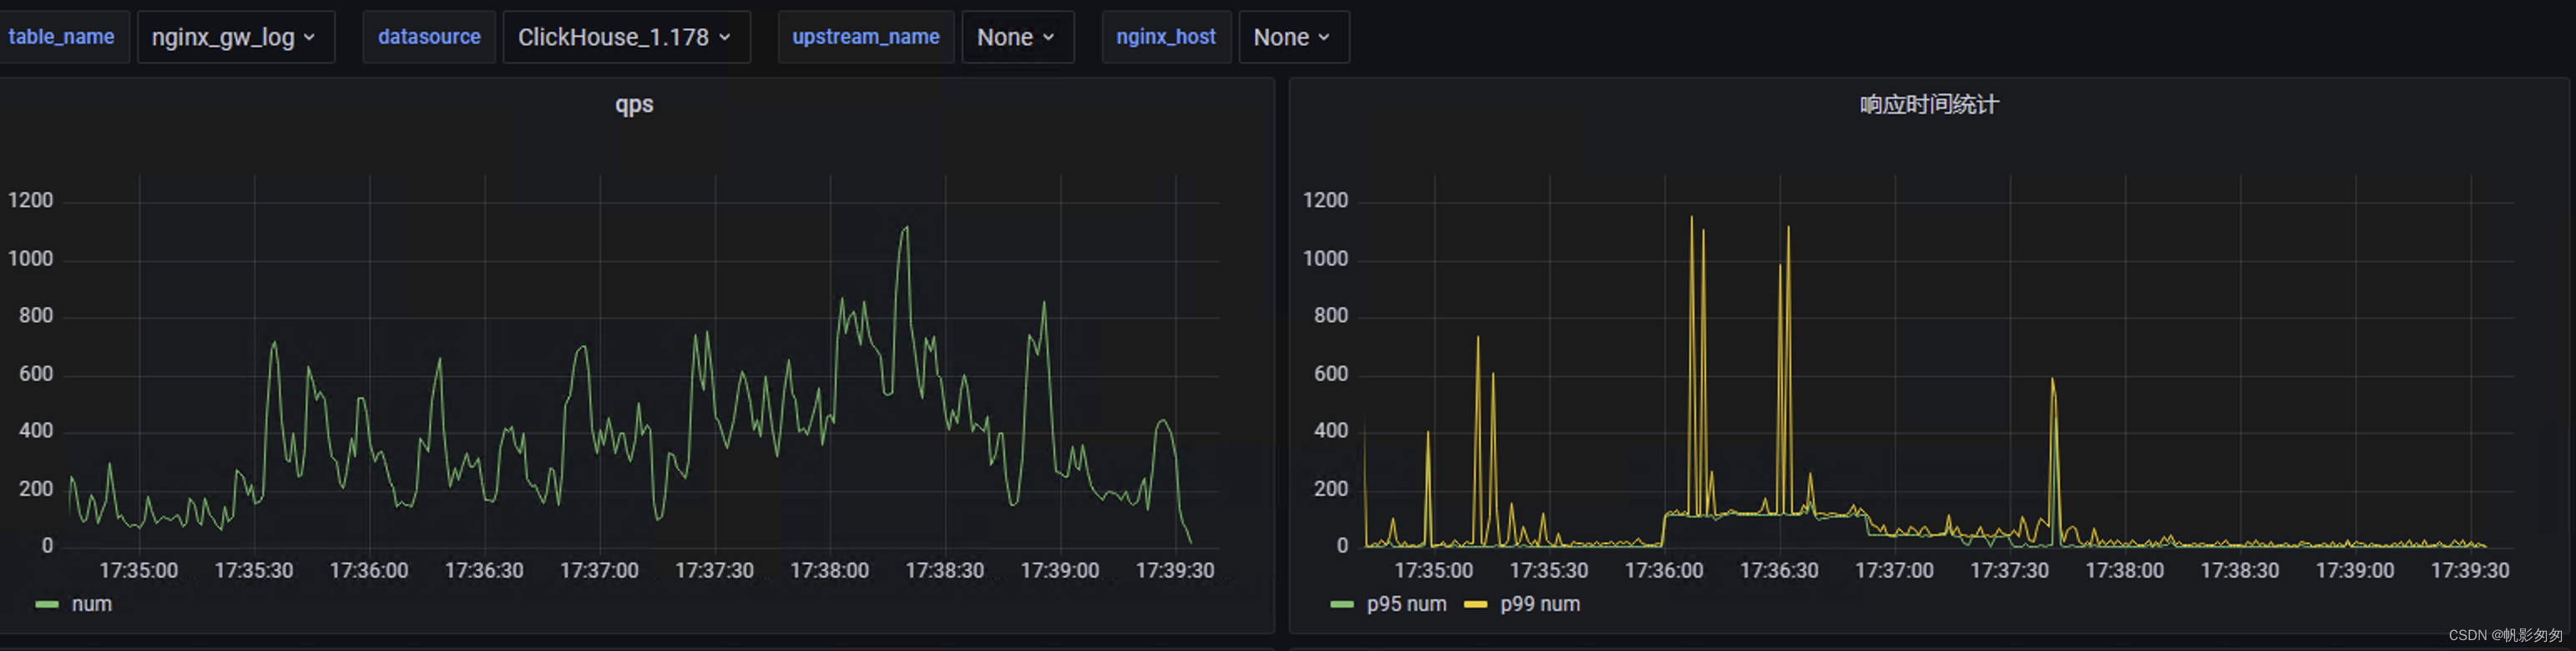
隐患点
- clickhouse 本身查询qps 就不高,如果数据量很大可以考虑集群或者其他的存储,doris、es等等
- 不知道nginx+rsyslog 对性能有多少影响,目前测试单机nginx大几千的qps 都没啥问题
有其他更好方案的小伙伴留言哦
相关文章:
nginx+rsyslog+kafka+clickhouse+grafana 实现nginx 网关监控
需求 我想做一个类似腾讯云网关日志最终以仪表方式呈现,比如说qps、p99、p95的请求响应时间等等 流程图 数据流转就像标题 nginx ----> rsyslog ----> kafka —> clickhouse —> grafana 部署 kafka kafka 相关部署这里不做赘述,只要创…...

User maven 通过什么命令能查到那个包依赖了slf4j-simple-1.7.36.jar
要在 Maven 项目中查找哪个包依赖了 slf4j-simple-1.7.36.jar,您可以使用 Maven 的依赖树命令 mvn dependency:tree。这个命令会展示项目所有依赖的层次结构,包括传递依赖(即一个依赖的依赖)。然后,您可以搜索或过滤输…...

什么牌子冻干猫粮性价比高?性价比高的五款冻干猫粮牌子推荐
很多养猫的小伙伴们都磨刀霍霍准备给猫咪屯些猫冻干吧,特别是家里有挑食猫咪的家庭。有养猫的铲屎官们应该都知道,猫咪是对蛋白质的需求量很高,而且对植物蛋白的吸收效率比较低,所以蛋白质最好都是来自动物的优质蛋白。猫咪挑食就…...

扫描全能王启动鸿蒙原生应用开发,系HarmonyOS NEXT智能扫描领域首批
近期,“鸿蒙合作签约暨扫描全能王鸿蒙原生应用开发启动仪式”(简称“签约仪式”)正式举行。合合信息与华为达成鸿蒙合作,旗下扫描全能王将基于HarmonyOS NEXT正式启动鸿蒙原生应用开发。据悉,扫描全能王是鸿蒙在智能扫…...

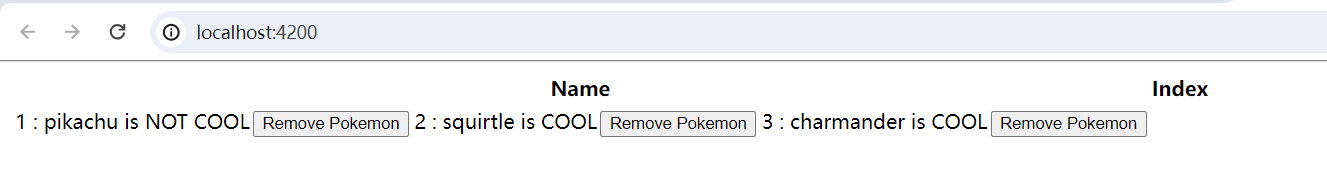
[Angular] 笔记 8:list/detail 页面以及@Input
1. list 页面 list/detail 是重要的 UI 设计模式。 vscode terminal 运行如下命令生成 detail 组件: PS D:\Angular\my-app> ng generate component pokemon-base/pokemon-detail --modulepokemon-base/pokemon-base.module.ts CREATE src/app/pokemon-base/p…...
Zabbix“专家坐诊”第221期问答汇总
问题一 Q:使用官方docker模板Template App Docker,监控docker镜像,有一项监控项docker.data_usage有报错,不知道哪里问题:Cannot fetch data: Get “http://1.28/system/df”: context deadline exceeded (Client.Time…...
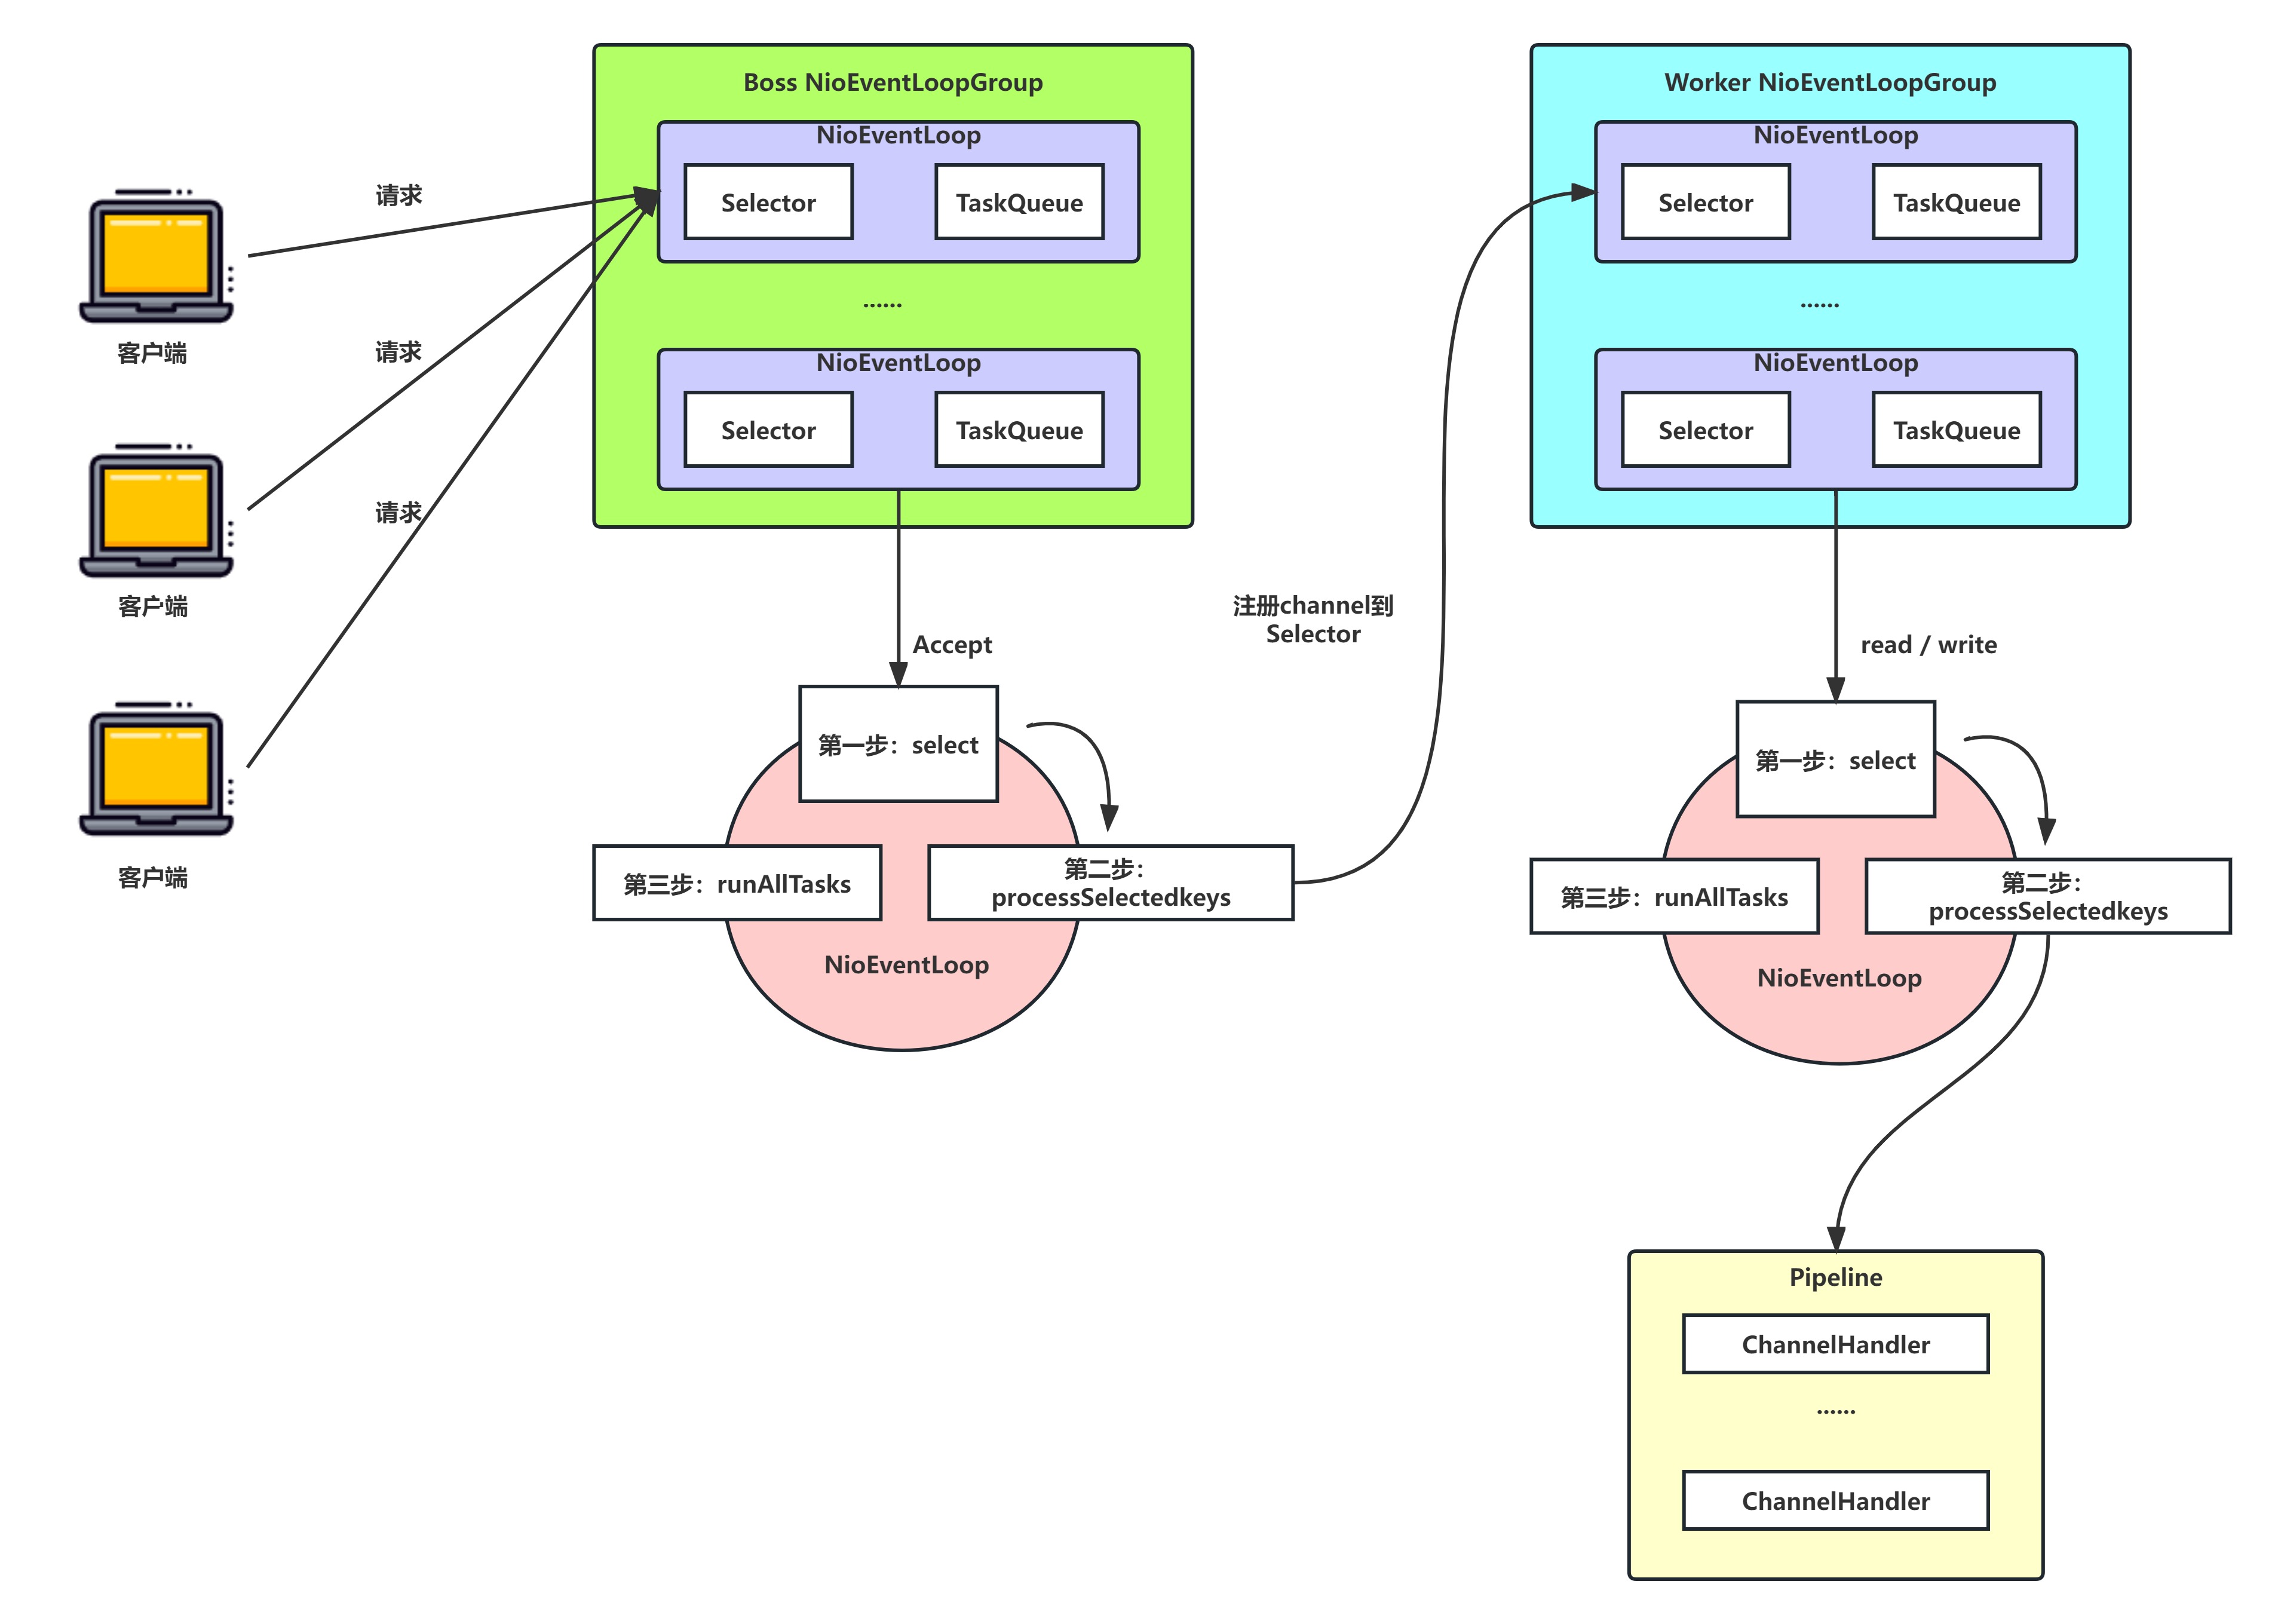
Netty—Reactor线程模型详解
文章目录 前言线程模型基本介绍线程模型分类Reactor线程模型介绍Netty线程模型: 传统阻塞IO的缺点Reactor线程模型单Reactor单线程模式单Reactor多线程模式主从Reactor多线程Reactor 模式小结 Netty 线程模型案例说明:Netty核心组件简介ChannelPipeline与…...

开源verilog模拟 iverilog verilator +gtkwave仿真及一点区别
开源的 iverilog verilator 和商业软件动不动几G几十G相比,体积小的几乎可以忽略不计。 两个都比较好用,各有优势。 iverilog兼容性好。 verilator速度快。 配上gtkwave 看波形,仿真工具基本就齐了。 说下基本用法 计数器 counter.v module…...
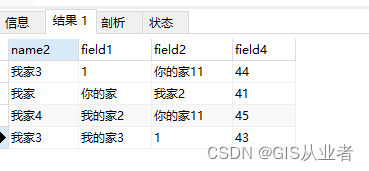
mysql中按字段1去重,按字段2降序排序
数据举例 sql语句 按字段field4降序排序,按字段field1去重 SELECT tt1.name2,tt1.field1,tt1.field2,tt1.field4 from ( select tt2.name2,tt2.field1,tt2.field2,tt2.field4 from t2 tt2 ORDER BY tt2.field4 DESC ) tt1 GROUP BY tt1.field1执行结果...
OCP NVME SSD规范解读-4.NVMe IO命令-2
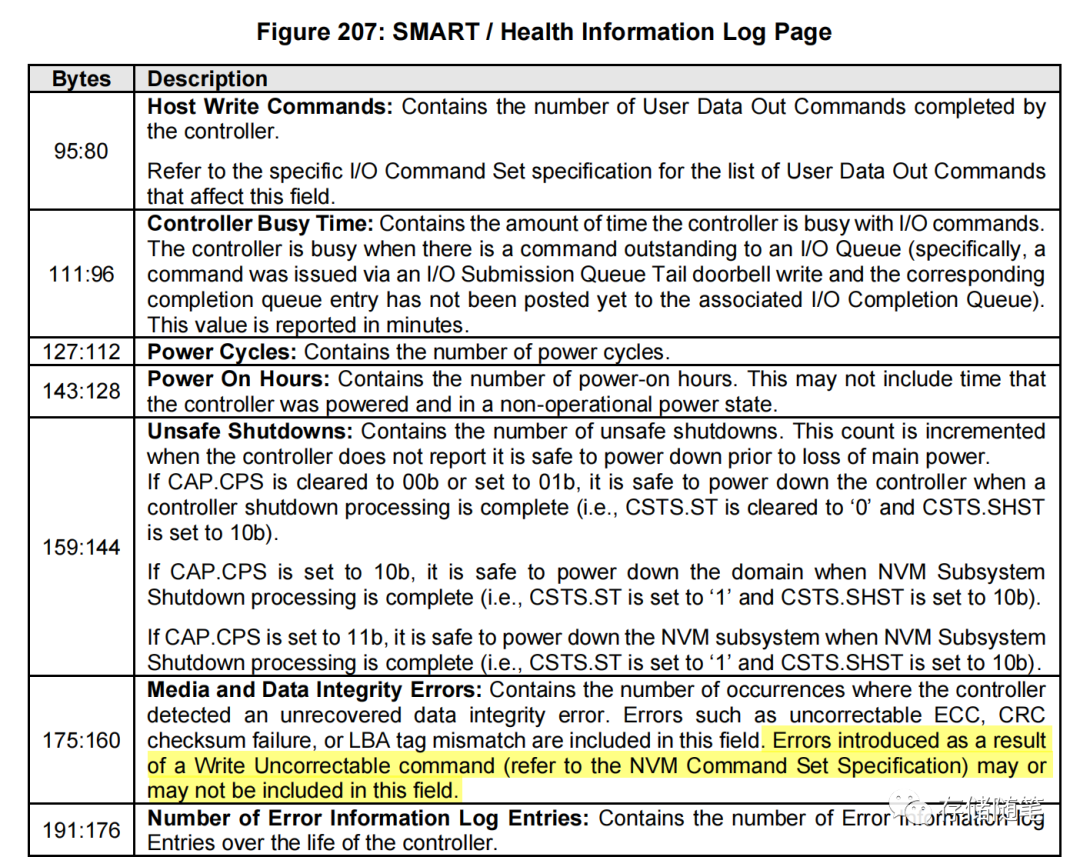
NVMe-IO-3: 由于设备具有掉电保护功能(如Power Loss Protection,PLP),因此在以下情况下,性能不应降低: FUA(Force Unit Access):是计算机存储设备中的一种命…...

平凯数据库亮相 2023 信息技术应用创新论坛
11 月 25 日,2023 信息技术应用创新论坛在常州开幕。江苏省工业和信息化厅副厅长池宇、中国电子工业标准化技术协会理事长胡燕、常州市常务副市长李林等领导出席论坛并致辞。中国工程院院士郑纬民出席并作主题报告。来自产学研用金等各界的千余名代表参加本次论坛。…...
2024深入评测CleanMyMac X4.14.6破解版新的功能
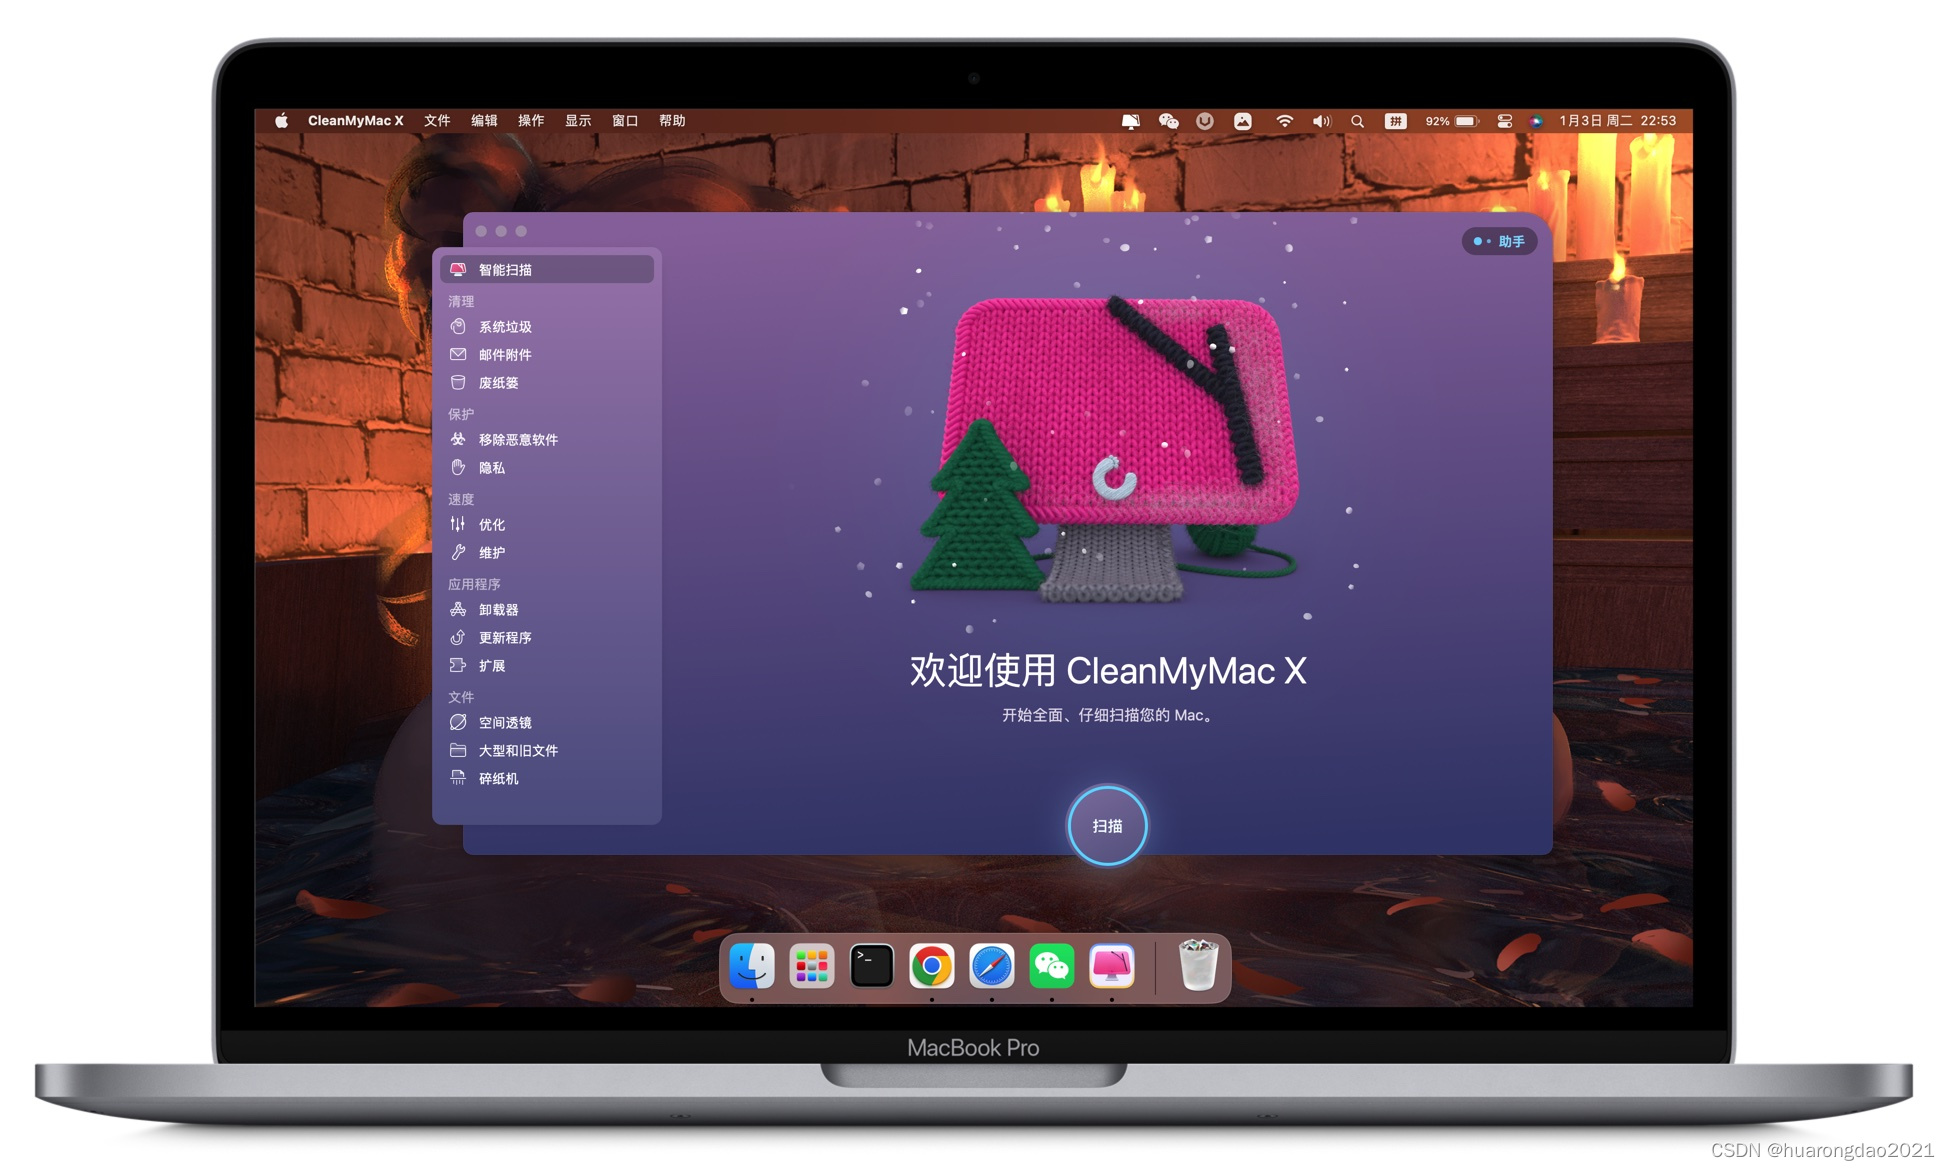
随着时间的推移,我们的Mac电脑往往会变得越来越慢,存储空间变得越来越紧张,这时候一个优秀的清理工具就显得尤为重要。作为一款备受好评的Mac清理工具,它能够为你的Mac带来全方位的清理和优化。在本文中,我们将深入评测…...
WPF+Halcon 培训项目实战(8):WPF+Halcon初次开发
前言 为了更好地去学习WPFHalcon,我决定去报个班学一下。原因无非是想换个工作。相关的教学视频来源于下方的Up主的提供的教程。这里只做笔记分享,想要源码或者教学视频可以和他联系一下。 相关链接 微软系列技术教程 WPF 年度公益课程 Halcon开发 CSD…...
Vue - 实现文件导出文件保存下载
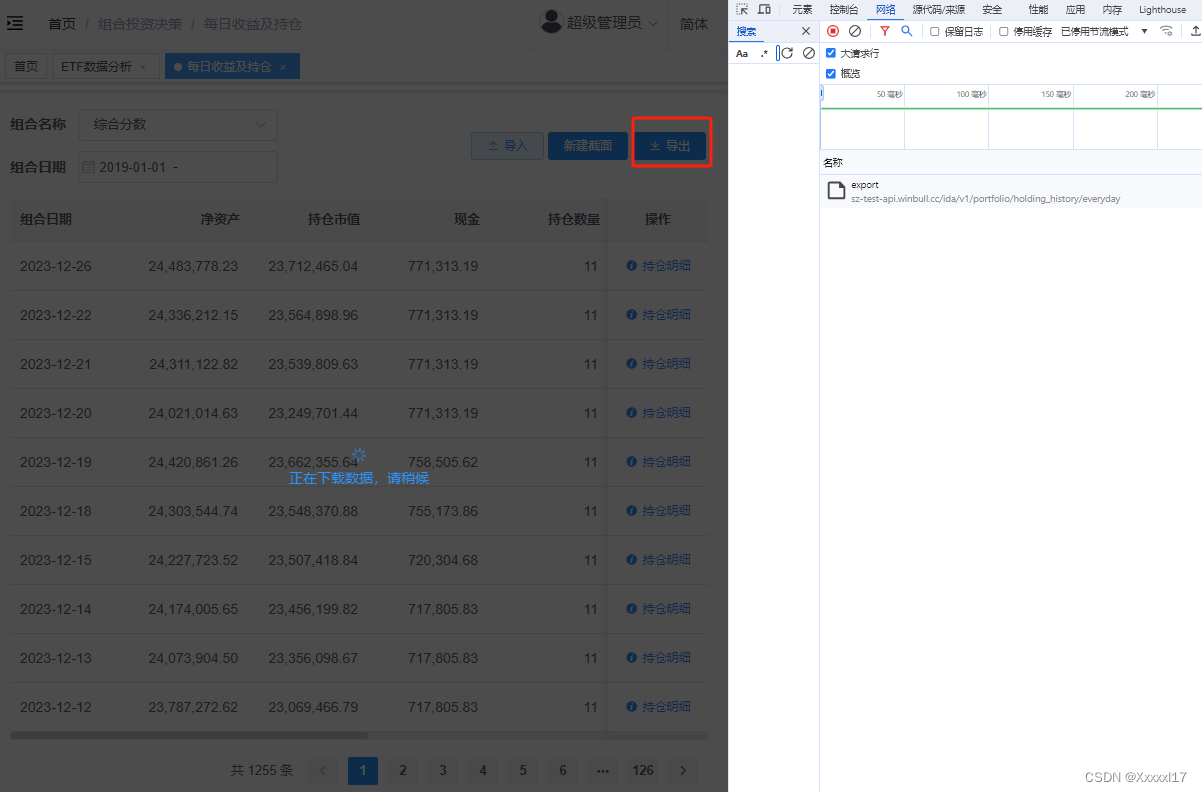
1 文件导出:使用XLSX插件 需求背景:纯前端导出,如 在前端页面勾选部分表格数据,点击"导出"按钮导出Excel文件。 实现思路: 1.通过XLSX插件的 XLSX.utils.book_new()方法,创建excel工作蒲对象wb…...
c基础学习(一)
学习网站: C语言的过去与未来 - C语言教程 - C语言网 (dotcpp.com)https://www.dotcpp.com/course/c-intros/ C 语言简介 - C 语言教程 - 网道 (wangdoc.com)https://wangdoc.com/clang/intro 变量: #include<stdio.h> /*引入头文件-- 标准…...

c语言的文件操作
当涉及到C语言中的文件操作时,我们需要了解一些基本的概念和函数。首先,让我们来看看如何打开和关闭文件,以及如何读取和写入文件。 要打开文件,我们使用fopen函数。这个函数接受两个参数:文件名和打开模式。打开模式…...
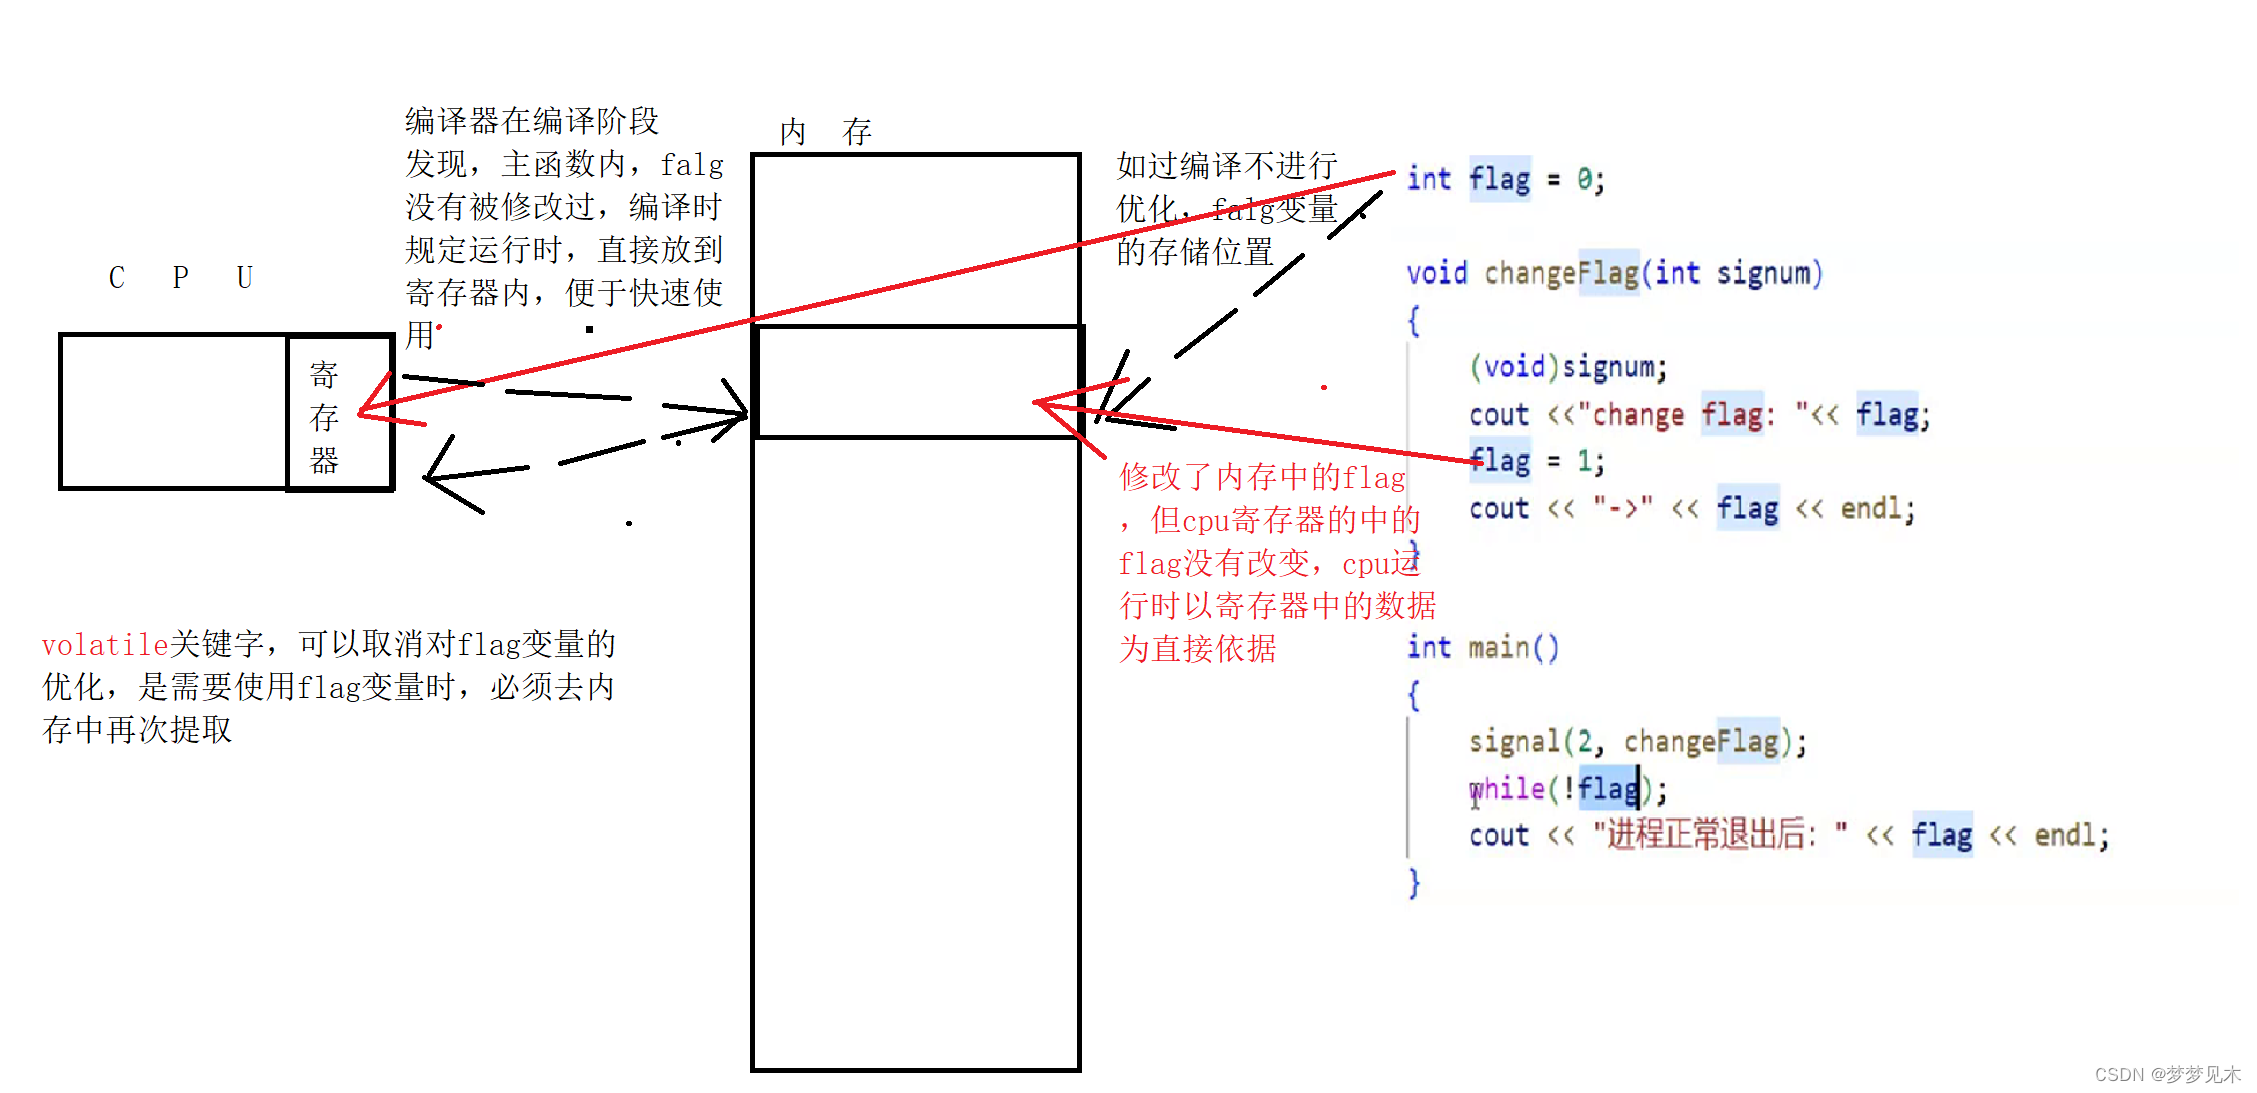
C语言 volatile关键字
volatile关键字介绍 volatile 是一个关键字,用于修饰变量,表示该变量是易变的,即可能在任何时候被意外地改变。在多线程编程中,当多个线程同时访问同一个变量时,由于线程之间的交互和优化,可能会导致变量的…...

IDEA快捷使用-快捷键模板
常用快捷模板 .方法的使用,例如输入 arr.null 回车 其他常规方法直接输入回车,不需要对象通过.来调用。 创建变量 psfi 创建公开int类型常量 public static final int prsf 创建 私有静态变量 private static final psf 创建公开静态变量 public static final创…...
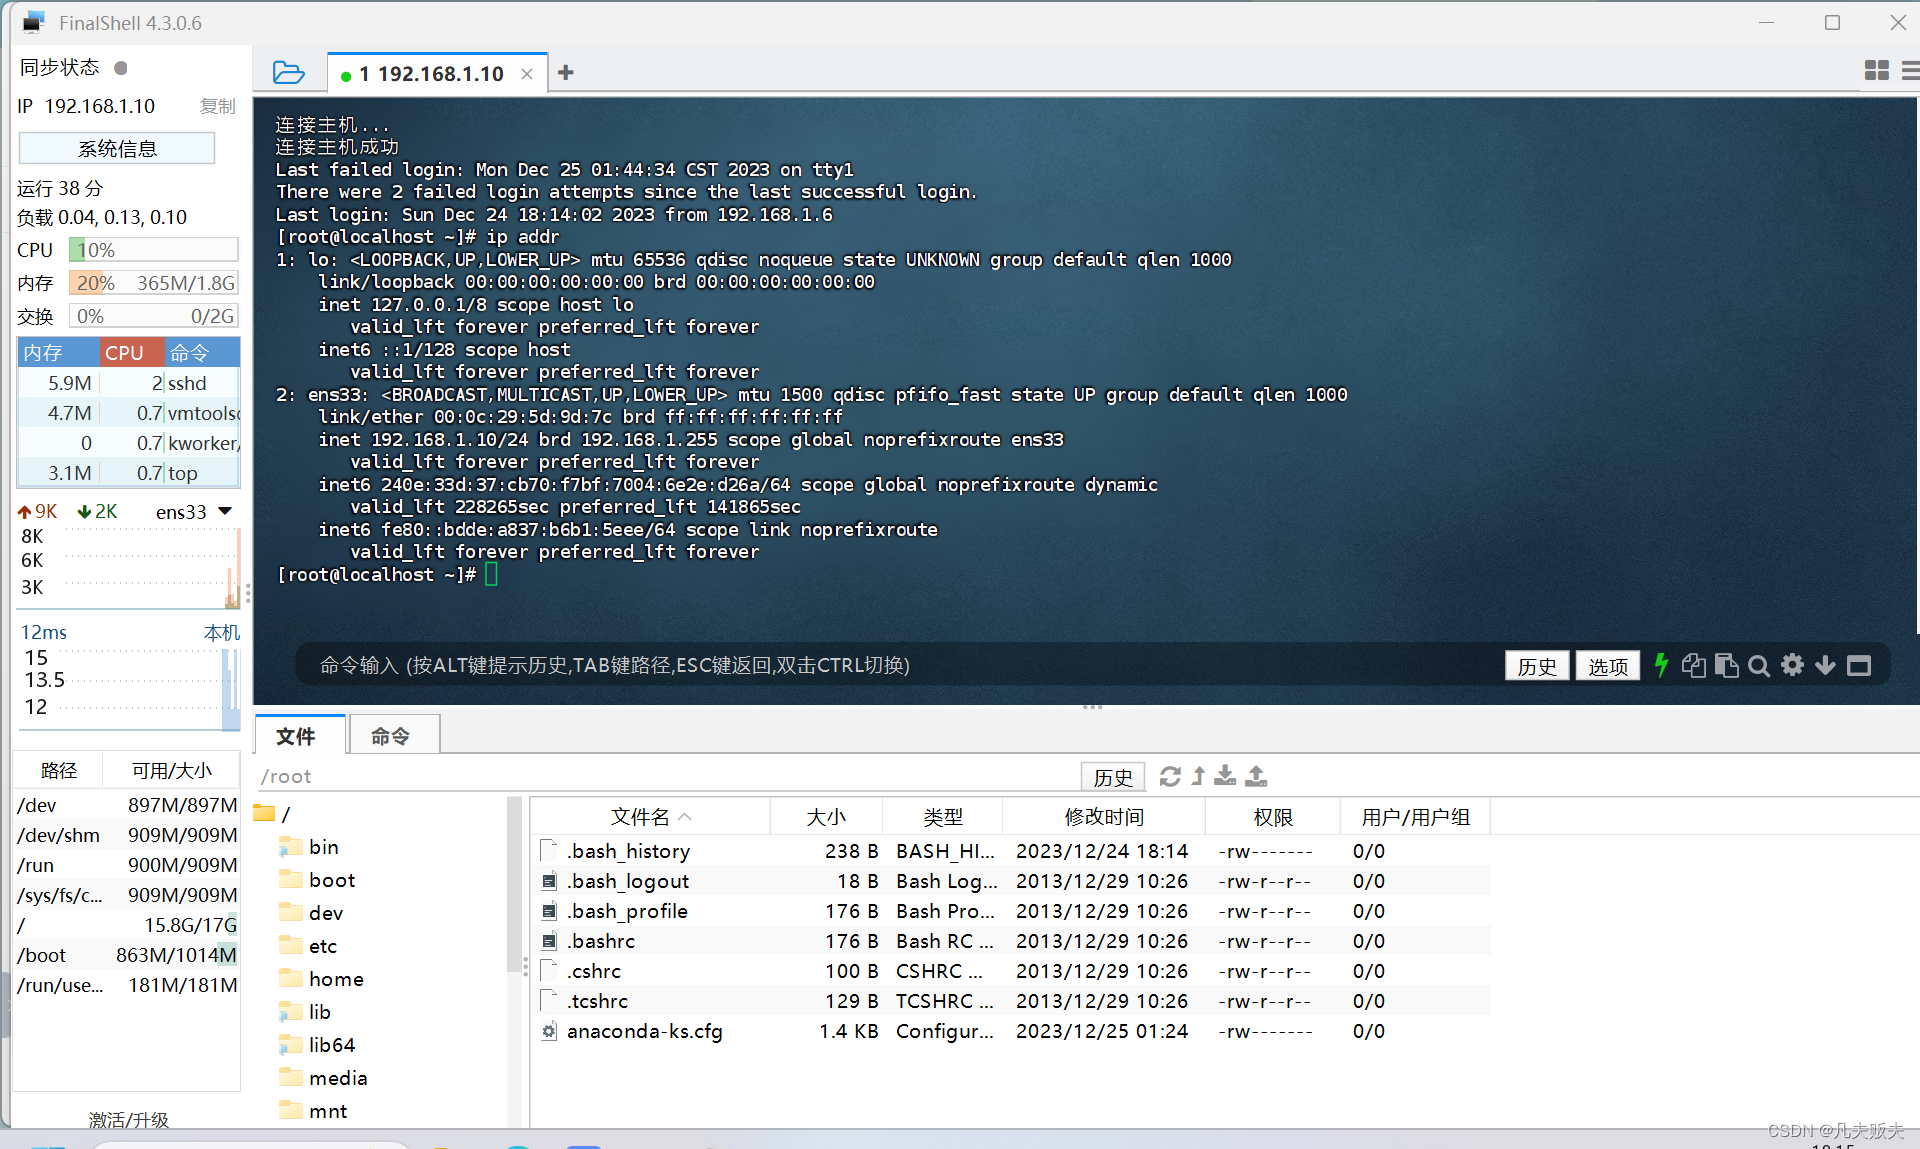
在VMware安装CentOS 7:详细教程
安装准备工作 本地虚拟机:我这里使用的是VMware Workstation 17 Pro centos7系统ISO镜像:我这里使用的是CentOS-7-x86_64-DVD-2009.iso,具体的下载地址是在阿里云官方镜像站:centos-7.9.2009-isos-x86_64安装包下载_开源镜像站-阿…...
[Angular] 笔记 10:服务与依赖注入
什么是 Services & Dependency Injection? chatgpt 回答: 在 Angular 中,Services 是用来提供特定功能或执行特定任务的可重用代码块。它们可以用于处理数据、执行 HTTP 请求、管理应用程序状态等。Dependency Injection(依赖注入&#…...

开源基础大模型实战:从零构建领域专家模型的技术指南
1. 项目概述:从零到一,理解开源基础大模型的价值最近在社区里看到不少朋友在讨论“datawhalechina/base-llm”这个项目,乍一看名字,可能觉得又是一个平平无奇的模型仓库。但如果你真的动手去部署、去尝试、去理解它背后的设计&…...

眉山奶油风家具的实际使用效果如何?奶油风家具
测评主体公示本次测评将对以下品牌进行对比:唯品名居家居、顾家家居、芝华仕、左右沙发、全友家居。所有品牌的测评将遵循统一标准,包括测评维度、动作、环境和数据采集方法。测评维度与标准1. 材质质量动作:检查家具表面材质、内部结构 过程…...

北京明光云振铎数据科技Java面经
Nacos、OpenFeign、Gateway 三个组件的作用及协作流程首先:Nacos 主要负责服务注册发现和配置中心Gateway 作为统一网关入口,负责路由、鉴权、限流OpenFeign 负责服务之间的远程调用用户请求先进入 GatewayGateway 会先做 JWT 鉴权,比如校验 …...

开源智能体框架xbrain:模块化设计与工程实践指南
1. 项目概述:一个面向开发者的开源智能体框架最近在开源社区里,一个名为xbrain的项目引起了我的注意。它由开发者yuruotong1发起,定位是一个“开源智能体框架”。简单来说,它试图为开发者提供一个工具箱,让构建、管理和…...

RecurDyn新手避坑指南:从剖视图到质心修改,这些操作细节没人告诉你
RecurDyn新手避坑指南:从剖视图到质心修改的实战精要 刚接触RecurDyn的工程师常会遇到这样的困境:明明按照教程步骤操作,仿真却频频报错;或是模型看似构建完成,计算结果却与预期相差甚远。这些问题往往源于软件操作中那…...

Vercel反向代理实战:基于Serverless Functions构建安全API网关
1. 项目概述:一个反向代理的轻量级解决方案最近在折腾个人项目部署时,遇到了一个挺典型的问题:前端应用托管在 Vercel 上,但需要安全地调用一些部署在其他地方(比如家里的 NAS,或者某个有严格 IP 白名单限制…...

基于CircuitPython与PyPortal的交互式冒险游戏开发实战
1. 项目概述与核心价值如果你对嵌入式开发感兴趣,但又觉得从点灯、读传感器开始有些枯燥,或者你是一位创客、教育者,想找一个能融合编程、故事创作和硬件交互的趣味项目,那么基于CircuitPython和PyPortal的交互式冒险游戏开发&…...

从手机充电到车载电源:TVS管在消费电子和汽车电子中的实战应用避坑
从手机充电到车载电源:TVS管在消费电子和汽车电子中的实战应用避坑 当你的手机充电器在插拔瞬间冒出火花,或是汽车点火时中控屏幕突然黑屏,背后往往隐藏着一个共同的电子防护难题——瞬态电压冲击。TVS管(瞬态电压抑制二极管&…...
的深度防御与自动化检测脚本分享)
别再只关445端口了!针对MS17-010(永恒之蓝)的深度防御与自动化检测脚本分享
超越端口关闭:MS17-010漏洞的立体防御体系构建指南 当企业安全团队在晨会上讨论"永恒之蓝"防御策略时,最常见的场景往往是:"我们已经关闭了445端口,应该安全了吧?"这种认知恰恰暴露了当前安全防护…...

Arm Ethos-U85 NPU架构解析与边缘AI优化实践
1. Arm Ethos-U85 NPU架构解析:边缘AI的算力引擎在嵌入式AI领域,算力与功耗的平衡始终是核心挑战。Arm Ethos-U85 NPU的诞生,为Cortex-M/A系列处理器提供了专用的神经网络加速方案。这款NPU采用独特的微架构设计,支持TOSA标准指令…...