【go语言开发】性能分析工具pprof使用
本文主要介绍如何在项目中使用pprof工具。首先简要介绍pprof工具的作用;然后介绍pprof的应用场景,主要分为工具型应用和服务型应用。最后数据分析项目,先采集项目信息,再可视化查看
文章目录
- 前言
- 应用场景
- 工具型应用
- 服务型应用
- 数据分析
- 命令行查看
- 采集数据
- 查看数据
- top
- Graph
- Flame Graph
- Source
欢迎大家访问个人博客网址:https://www.maogeshuo.com,博主努力更新中…
前言
pprof是Go语言的一个性能分析库,它的名字源于**“Profile”(简称"prof")**一词。该工具最早由Google开发并用于Go语言的性能分析,它可以帮助开发者找出程序中的性能瓶颈。pprof提供了CPU分析、内存分析、阻塞分析等多种性能分析功能。
- CPU分析:
- pprof可以通过采样应用程序的运行状态来分析CPU的使用情况,找出哪些函数占用了大量的CPU时间。
- 提供CPU使用率最高的函数列表和调用关系,帮助定位程序的CPU性能瓶颈。
- 内存分析:
- 支持对应用程序的内存分配和使用情况进行分析,帮助开发人员发现内存泄漏、高内存消耗的函数等问题。
- 提供内存使用最多的函数列表和调用关系,帮助优化内存管理和减少不必要的内存分配。
- 阻塞分析:
- pprof可以分析应用程序中的阻塞情况,识别并发执行过程中可能存在的阻塞问题。
- 提供阻塞最严重的代码段和调用关系,帮助优化并发执行的性能和减少阻塞时间。
- goroutine分析:
- 支持对应用程序中goroutine的跟踪和分析,帮助理解并发执行情况。
- 提供goroutine的数量、状态和调用关系等信息,帮助优化并发编程和避免goroutine泄漏。
- 堆分析:
- pprof可以生成堆内存分配和释放的时间序列图,帮助开发人员了解程序在运行过程中的内存分配情况。
- 提供堆内存使用的趋势和波动情况,帮助优化内存管理和减少内存占用。
除了这些功能外,pprof还提供了对运行时调用图的可视化展示。pprof可以很容易地集成到任何Go程序中,只需在程序中导入net/http/pprof包,并启动一个HTTP服务器,就可以通过Web界面查看性能数据。
应用场景
pprof工具的应用场景主要分为两种:
- 服务型应用:web服务性能分析
- 工具型应用:输入命令行应用等
工具型应用
如果你想在不使用HTTP服务的情况下对应用程序进行性能分析,可以直接使用 runtime/pprof 包中提供的函数来生成性能分析数据。
package mainimport ("log""os""runtime""runtime/pprof""time"
)func main() {Analysis()
}func Analysis() {// 创建 CPU 分析文件cpuProfile, err := os.Create("./profile/cpu.prof")if err != nil {log.Fatal(err)}defer cpuProfile.Close()// 开始 CPU 分析if err := pprof.StartCPUProfile(cpuProfile); err != nil {log.Fatal(err)}defer pprof.StopCPUProfile()// 模拟一些 CPU 密集型工作for i := 0; i < 1000000; i++ {_ = i * i}// 创建内存分析文件memProfile, err := os.Create("./profile/mem.prof")if err != nil {log.Fatal(err)}defer memProfile.Close()// 强制进行垃圾回收,以便获取准确的内存分析数据runtime.GC()// 开始内存分析if err := pprof.WriteHeapProfile(memProfile); err != nil {log.Fatal(err)}// 模拟一些内存使用data := make([]byte, 1024*1024)_ = datatime.Sleep(time.Second) // 等待一段时间以便生成分析数据log.Println("完成性能分析")
}
服务型应用
我们这里使用gin框架,结合https://github.com/gin-contrib/pprof
package mainimport (webpprof "github.com/gin-contrib/pprof""github.com/gin-gonic/gin""log""net/http""os""runtime""runtime/pprof""time"
)const Port = ":10000"func main() {WebAnalysis()
}func WebAnalysis() {g := gin.Default()g.GET("/test", func(c *gin.Context) {c.JSON(http.StatusOK, "测试成功")})webpprof.Register(g) // 注入HandlerFuncsg.Run(Port)}
启动后日志打印如下:

查看github.com/gin-contrib/pprof代码,发现gin.Engine将net/http/pprof的函数封装成标准的HandlerFuncs,也就是将func(w http.ResponseWriter, r *http.Request)格式函数转换为gin.HandlerFunc
package pprofimport ("net/http/pprof""github.com/gin-gonic/gin"
)const (// DefaultPrefix url prefix of pprofDefaultPrefix = "/debug/pprof"
)func getPrefix(prefixOptions ...string) string {prefix := DefaultPrefixif len(prefixOptions) > 0 {prefix = prefixOptions[0]}return prefix
}// Register the standard HandlerFuncs from the net/http/pprof package with
// the provided gin.Engine. prefixOptions is a optional. If not prefixOptions,
// the default path prefix is used, otherwise first prefixOptions will be path prefix.
func Register(r *gin.Engine, prefixOptions ...string) {RouteRegister(&(r.RouterGroup), prefixOptions...)
}// RouteRegister the standard HandlerFuncs from the net/http/pprof package with
// the provided gin.GrouterGroup. prefixOptions is a optional. If not prefixOptions,
// the default path prefix is used, otherwise first prefixOptions will be path prefix.
func RouteRegister(rg *gin.RouterGroup, prefixOptions ...string) {prefix := getPrefix(prefixOptions...)prefixRouter := rg.Group(prefix){prefixRouter.GET("/", gin.WrapF(pprof.Index))prefixRouter.GET("/cmdline", gin.WrapF(pprof.Cmdline))prefixRouter.GET("/profile", gin.WrapF(pprof.Profile))prefixRouter.POST("/symbol", gin.WrapF(pprof.Symbol))prefixRouter.GET("/symbol", gin.WrapF(pprof.Symbol))prefixRouter.GET("/trace", gin.WrapF(pprof.Trace))prefixRouter.GET("/allocs", gin.WrapH(pprof.Handler("allocs")))prefixRouter.GET("/block", gin.WrapH(pprof.Handler("block")))prefixRouter.GET("/goroutine", gin.WrapH(pprof.Handler("goroutine")))prefixRouter.GET("/heap", gin.WrapH(pprof.Handler("heap")))prefixRouter.GET("/mutex", gin.WrapH(pprof.Handler("mutex")))prefixRouter.GET("/threadcreate", gin.WrapH(pprof.Handler("threadcreate")))}
}实际上net/http/pprof库中已初始化的函数有Index等,并在此基础上再wrap了heap、mutex等
// Package pprof serves via its HTTP server runtime profiling data
// in the format expected by the pprof visualization tool.
//
// The package is typically only imported for the side effect of
// registering its HTTP handlers.
// The handled paths all begin with /debug/pprof/.
//
// To use pprof, link this package into your program:
//
//	import _ "net/http/pprof"
//
// If your application is not already running an http server, you
// need to start one. Add "net/http" and "log" to your imports and
// the following code to your main function:
//
//	go func() {
//		log.Println(http.ListenAndServe("localhost:6060", nil))
//	}()
//
// By default, all the profiles listed in [runtime/pprof.Profile] are
// available (via [Handler]), in addition to the [Cmdline], [Profile], [Symbol],
// and [Trace] profiles defined in this package.
// If you are not using DefaultServeMux, you will have to register handlers
// with the mux you are using.
//
// # Usage examples
//
// Use the pprof tool to look at the heap profile:
//
//	go tool pprof http://localhost:6060/debug/pprof/heap
//
// Or to look at a 30-second CPU profile:
//
//	go tool pprof http://localhost:6060/debug/pprof/profile?seconds=30
//
// Or to look at the goroutine blocking profile, after calling
// runtime.SetBlockProfileRate in your program:
//
//	go tool pprof http://localhost:6060/debug/pprof/block
//
// Or to look at the holders of contended mutexes, after calling
// runtime.SetMutexProfileFraction in your program:
//
//	go tool pprof http://localhost:6060/debug/pprof/mutex
//
// The package also exports a handler that serves execution trace data
// for the "go tool trace" command. To collect a 5-second execution trace:
//
//	curl -o trace.out http://localhost:6060/debug/pprof/trace?seconds=5
//	go tool trace trace.out
//
// To view all available profiles, open http://localhost:6060/debug/pprof/
// in your browser.
//
// For a study of the facility in action, visit
//
//	https://blog.golang.org/2011/06/profiling-go-programs.html
package pprofimport ("bufio""bytes""context""fmt""html""internal/profile""io""log""net/http""net/url""os""runtime""runtime/pprof""runtime/trace""sort""strconv""strings""time"
)
func init() {http.HandleFunc("/debug/pprof/", Index)http.HandleFunc("/debug/pprof/cmdline", Cmdline)http.HandleFunc("/debug/pprof/profile", Profile)http.HandleFunc("/debug/pprof/symbol", Symbol)http.HandleFunc("/debug/pprof/trace", Trace)
}
浏览器输入http://localhost:10000/debug/pprof/
pprof能分析9项信息

数据分析
命令行查看
go tool pprof
usage:Produce output in the specified format.pprof <format> [options] [binary] <source> ...Omit the format to get an interactive shell whose commands can be used
to generate various views of a profilepprof [options] [binary] <source> ...Omit the format and provide the "-http" flag to get an interactive web
interface at the specified host:port that can be used to navigate through
various views of a profile.pprof -http [host]:[port] [options] [binary] <source> ...Details:Output formats (select at most one):-callgrind       Outputs a graph in callgrind format-comments        Output all profile comments-disasm          Output assembly listings annotated with samples-dot             Outputs a graph in DOT format-eog             Visualize graph through eog-evince          Visualize graph through evince-gif             Outputs a graph image in GIF format-gv              Visualize graph through gv-kcachegrind     Visualize report in KCachegrind-list            Output annotated source for functions matching regexp-pdf             Outputs a graph in PDF format-peek            Output callers/callees of functions matching regexp-png             Outputs a graph image in PNG format-proto           Outputs the profile in compressed protobuf format-ps              Outputs a graph in PS format-raw             Outputs a text representation of the raw profile-svg             Outputs a graph in SVG format-tags            Outputs all tags in the profile-text            Outputs top entries in text form-top             Outputs top entries in text form-topproto        Outputs top entries in compressed protobuf format-traces          Outputs all profile samples in text form-tree            Outputs a text rendering of call graph-web             Visualize graph through web browser-weblist         Display annotated source in a web browserOptions:-call_tree       Create a context-sensitive call tree-compact_labels  Show minimal headers-divide_by       Ratio to divide all samples before visualization-drop_negative   Ignore negative differences-edgefraction    Hide edges below <f>*total-focus           Restricts to samples going through a node matching regexp-hide            Skips nodes matching regexp-ignore          Skips paths going through any nodes matching regexp-intel_syntax    Show assembly in Intel syntax-mean            Average sample value over first value (count)-nodecount       Max number of nodes to show-nodefraction    Hide nodes below <f>*total-noinlines       Ignore inlines.-normalize       Scales profile based on the base profile.-output          Output filename for file-based outputs-prune_from      Drops any functions below the matched frame.-relative_percentages Show percentages relative to focused subgraph-sample_index    Sample value to report (0-based index or name)-show            Only show nodes matching regexp-show_from       Drops functions above the highest matched frame.-source_path     Search path for source files-tagfocus        Restricts to samples with tags in range or matched by regexp-taghide         Skip tags matching this regexp-tagignore       Discard samples with tags in range or matched by regexp-tagleaf         Adds pseudo stack frames for labels key/value pairs at the callstack leaf.-tagroot         Adds pseudo stack frames for labels key/value pairs at the callstack root.-tagshow         Only consider tags matching this regexp-trim            Honor nodefraction/edgefraction/nodecount defaults-trim_path       Path to trim from source paths before search-unit            Measurement units to displayOption groups (only set one per group):granularity-functions       Aggregate at the function level.-filefunctions   Aggregate at the function level.-files           Aggregate at the file level.-lines           Aggregate at the source code line level.-addresses       Aggregate at the address level.sort-cum             Sort entries based on cumulative weight-flat            Sort entries based on own weightSource options:-seconds              Duration for time-based profile collection-timeout              Timeout in seconds for profile collection-buildid              Override build id for main binary-add_comment          Free-form annotation to add to the profileDisplayed on some reports or with pprof -comments-diff_base source     Source of base profile for comparison-base source          Source of base profile for profile subtractionprofile.pb.gz         Profile in compressed protobuf formatlegacy_profile        Profile in legacy pprof formathttp://host/profile   URL for profile handler to retrieve-symbolize=           Controls source of symbol informationnone                  Do not attempt symbolizationlocal                 Examine only local binariesfastlocal             Only get function names from local binariesremote                Do not examine local binariesforce                 Force re-symbolizationBinary                  Local path or build id of binary for symbolization-tls_cert             TLS client certificate file for fetching profile and symbols-tls_key              TLS private key file for fetching profile and symbols-tls_ca               TLS CA certs file for fetching profile and symbolsMisc options:-http              Provide web interface at host:port.Host is optional and 'localhost' by default.Port is optional and a randomly available port by default.-no_browser        Skip opening a browser for the interactive web UI.-tools             Search path for object toolsLegacy convenience options:-inuse_space           Same as -sample_index=inuse_space-inuse_objects         Same as -sample_index=inuse_objects-alloc_space           Same as -sample_index=alloc_space-alloc_objects         Same as -sample_index=alloc_objects-total_delay           Same as -sample_index=delay-contentions           Same as -sample_index=contentions-mean_delay            Same as -mean -sample_index=delayEnvironment Variables:PPROF_TMPDIR       Location for saved profiles (default $HOME/pprof)PPROF_TOOLS        Search path for object-level toolsPPROF_BINARY_PATH  Search path for local binary filesdefault: $HOME/pprof/binariessearches $buildid/$name, $buildid/*, $path/$buildid,${buildid:0:2}/${buildid:2}.debug, $name, $path* On Windows, %USERPROFILE% is used instead of $HOME
no profile source specified
采集数据
可以将每项数据统一采集下来,再具体分析
go tool pprof http://localhost:10000/debug/pprof/allocs
go tool pprof http://localhost:10000/debug/pprof/block
go tool pprof http://localhost:10000/debug/pprof/cmdline
go tool pprof http://localhost:10000/debug/pprof/heap
go tool pprof http://localhost:10000/debug/pprof/mutex
go tool pprof http://localhost:10000/debug/pprof/profile
go tool pprof http://localhost:10000/debug/pprof/threadcreate
go tool pprof http://localhost:10000/debug/pprof/trace
终端中运行以下命令,性能分析allocs数据:


在进入 pprof 命令行界面后,你可以输入不同的命令来查看不同类型的分析数据,比如 top 查看 CPU 使用最多的函数,list 查看某个函数的详细信息,web 可以在浏览器中打开交互式图形界面等。
查看数据
查看数据,可以选择web形式,可视化效果直观,打开收集好的pb.gz文件
UI显示依赖graphviz库 ,mac安装使用命令为:brew install graphviz
go tool pprof -http:127.0.0.1:port pb.gz路径 //参考截图使用

浏览器输入http://127.0.0.1:8082/ui/,UI上查看各项信息

top
查看CPU/内存占有率最高的接口

Graph

Flame Graph

Source

相关文章:
【go语言开发】性能分析工具pprof使用
本文主要介绍如何在项目中使用pprof工具。首先简要介绍pprof工具的作用;然后介绍pprof的应用场景,主要分为工具型应用和服务型应用。最后数据分析项目,先采集项目信息,再可视化查看 文章目录 前言应用场景工具型应用服务型应用 数…...
ARM_基础之RAS
Reliability, Availability, and Serviceability (RAS), for A-profile architecture 源自 https://developer.arm.com/documentation/102105/latest/ 1 Introduction to RAS 1.1 Faults,Errors,and failures 三个概念的区分: • A failure is the event of devia…...

VScode(1)之内网离线安装开发环境(VirtualBox+ubuntu+VScode)
VScode(1)之内网离线安装开发环境(VirtualBoxubuntuVScode) Author: Once Day Date: 2022年7月18日/2024年3月17日 一位热衷于Linux学习和开发的菜鸟,试图谱写一场冒险之旅,也许终点只是一场白日梦… 漫漫长路,有人对你微笑过嘛… 全系列文…...

Python爬虫与数据可视化源码免费领取
引言 作为一名在软件技术领域深耕多年的专业人士,我不仅在软件开发和项目部署方面积累了丰富的实践经验,更以卓越的技术实力获得了🏅30项软件著作权证书的殊荣。这些成就不仅是对我的技术专长的肯定,也是对我的创新精神和专业承诺…...
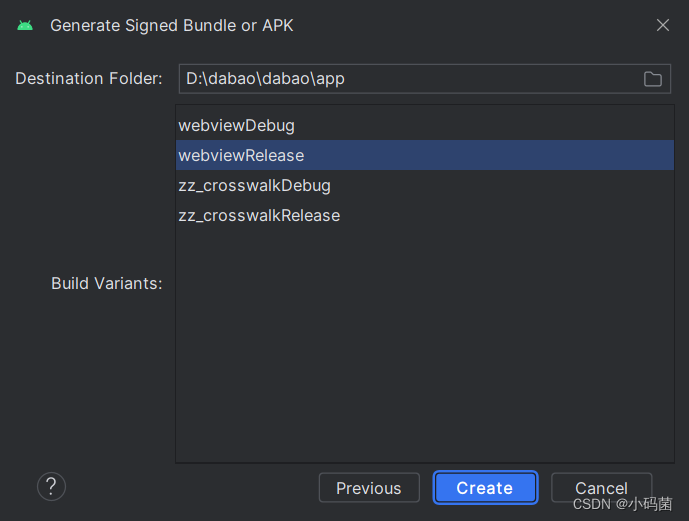
Android Studio 打包 Maker MV apk 详细步骤
一.使用RPG Make MV 部署项目,获取项目文件夹 这步基本都不会有问题: 二.安装Android Studio 安装过程参考教材就行了: https://blog.csdn.net/m0_62491877/article/details/126832118 但是有的版本面板没有Android的选项(勾…...
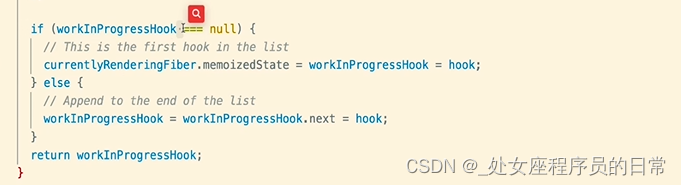
react中hooks使用限制
只能在最顶层使用Hook 不要在循环、条件中调用hook,确保总是在React函数最顶层使用它们 只能React函数中调用Hook 不要在普通的js函数中调用 在React的函数组件中调用Hook 在自定义hook中调用其他hook 原因: 我们每次的状态值或者依赖项存在哪里&…...

2024抖音矩阵云混剪系统源码 短视频矩阵营销系统
2024抖音矩阵云混剪系统源码 短视频矩阵营销系统 矩阵营销系统多平台多账号一站式管理,一键发布作品。智能标题,关键词优化,排名查询,混剪生成原创视频,账号分组,意向客户自动采集,智能回复&am…...
力扣题目训练(22)
2024年2月15日力扣题目训练 2024年2月15日力扣题目训练563. 二叉树的坡度637. 二叉树的层平均值643. 子数组最大平均数 I304. 二维区域和检索 - 矩阵不可变154. 寻找旋转排序数组中的最小值 II 2024年2月15日力扣题目训练 2024年2月15日第二十二天编程训练,今天主要…...

[ROS 系列学习教程] rosbag Python API
ROS 系列学习教程(总目录) 本文目录 1. 构造函数与关闭文件2. 属性值3. 写bag文件内容4. 读bag文件内容5. 将bag文件缓存写入磁盘6. 重建 bag 文件索引7. 获取bag文件的压缩信息8. 获取bag文件的消息数量9. 获取bag文件记录的起止时间10. 获取话题信息与消息类型 rosbag 的 Pyt…...

TCL管理Vivado工程
文章目录 TCL管理Vivado工程1. 项目目录2. 导出脚本文件3. 修改TCL脚本3.1 project.tcl3.2 bd.tcl 4. 工程恢复 TCL管理Vivado工程 工程结构 1. 项目目录 config: 配置文件、coe文件等。doc: 文档fpga: 最后恢复的fpga工程目录ip: ip文件mcs: bit流文件等,方便直接使用src: .…...
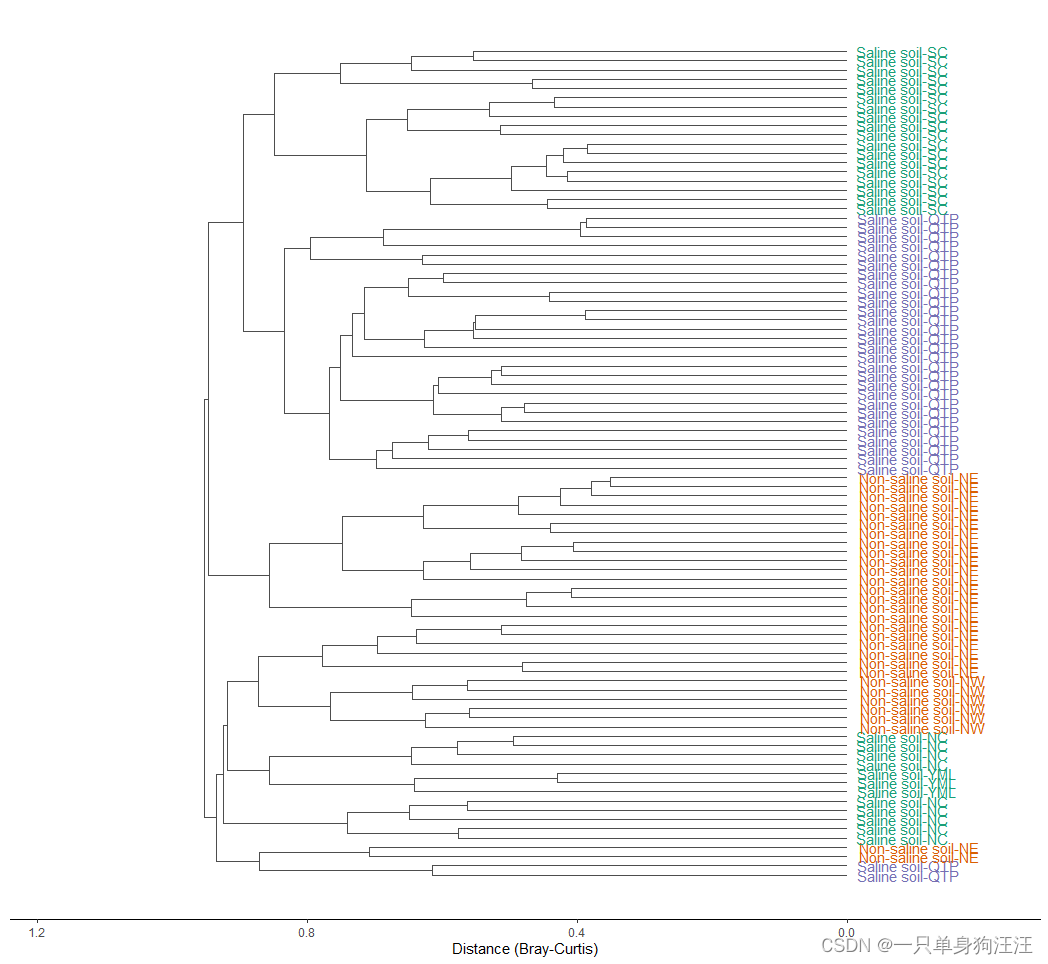
R语言:microeco:一个用于微生物群落生态学数据挖掘的R包,第四:trans_beta class
trans_beta class:利用trans_beta类可以变换和绘制beta分集的距离矩阵。该类中涉及到beta多样性的分析主要包括排序、群距、聚类和方差分析。我们首先使用PCoA显示排序。 > dataset$cal_betadiv() The result is stored in object$beta_diversity ... > t1 &…...
)
Excel文件导入导出,SpringBoot整合EasyExcel批量导入导出,采用的JDBC+EasyExcel(附带整个Demo)
目录 0.为什么mybatis的foreach比JDBC的addBatch慢 1.引入依赖 2.Controller层 3.Service层 4.Utils工具类 5.自定义监听器 6.实体类 7Mapper层 不用Mybatis的原因就是因为在大量数据插入的时候jdbc性能比mybatis好1. 首先分批读取Excel中的数据 这一点EasyExcel有自己…...

Git——本地使用详解
目录 Git1、开始版本控制1.1、初始化Repository1.2、使目录脱离Git控制 2、把文件交给Git管控2.1、创建文件后交给Git2.2、git add之后再次修改文件2.3、git add "--all"与"."参数区别2.4、把暂存区的内容提交到存储库里存档 3、工作区、暂存区与存储库3.1…...
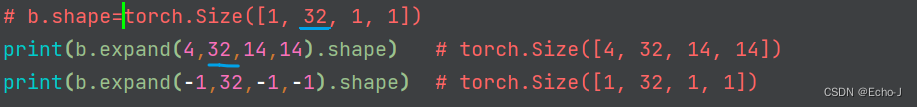
深度学习pytorch——Tensor维度变换(持续更新)
view()打平函数 需要注意的是打平之后的tensor是需要有物理意义的,根据需要进行打平,并且打平后总体的大小是不发生改变的。 并且一定要谨记打平会导致维度的丢失,造成数据污染,如果想要恢复到原来的数据形式,是需要…...
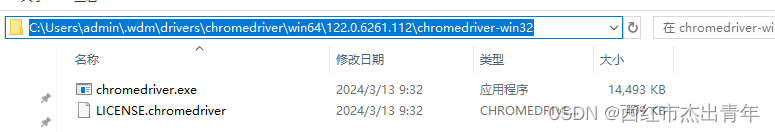
Selenium-webdriver_manager判断是否已经下载过驱动(复用缓存驱动)
1,谷歌浏览器默认位置 2,ChromeDriverManager 下载的驱动位置 其中admin为机器的用户名 def installDriver(self):"""判断是否需要下载driver""""""找到本机谷歌浏览器版本""""""C:\P…...
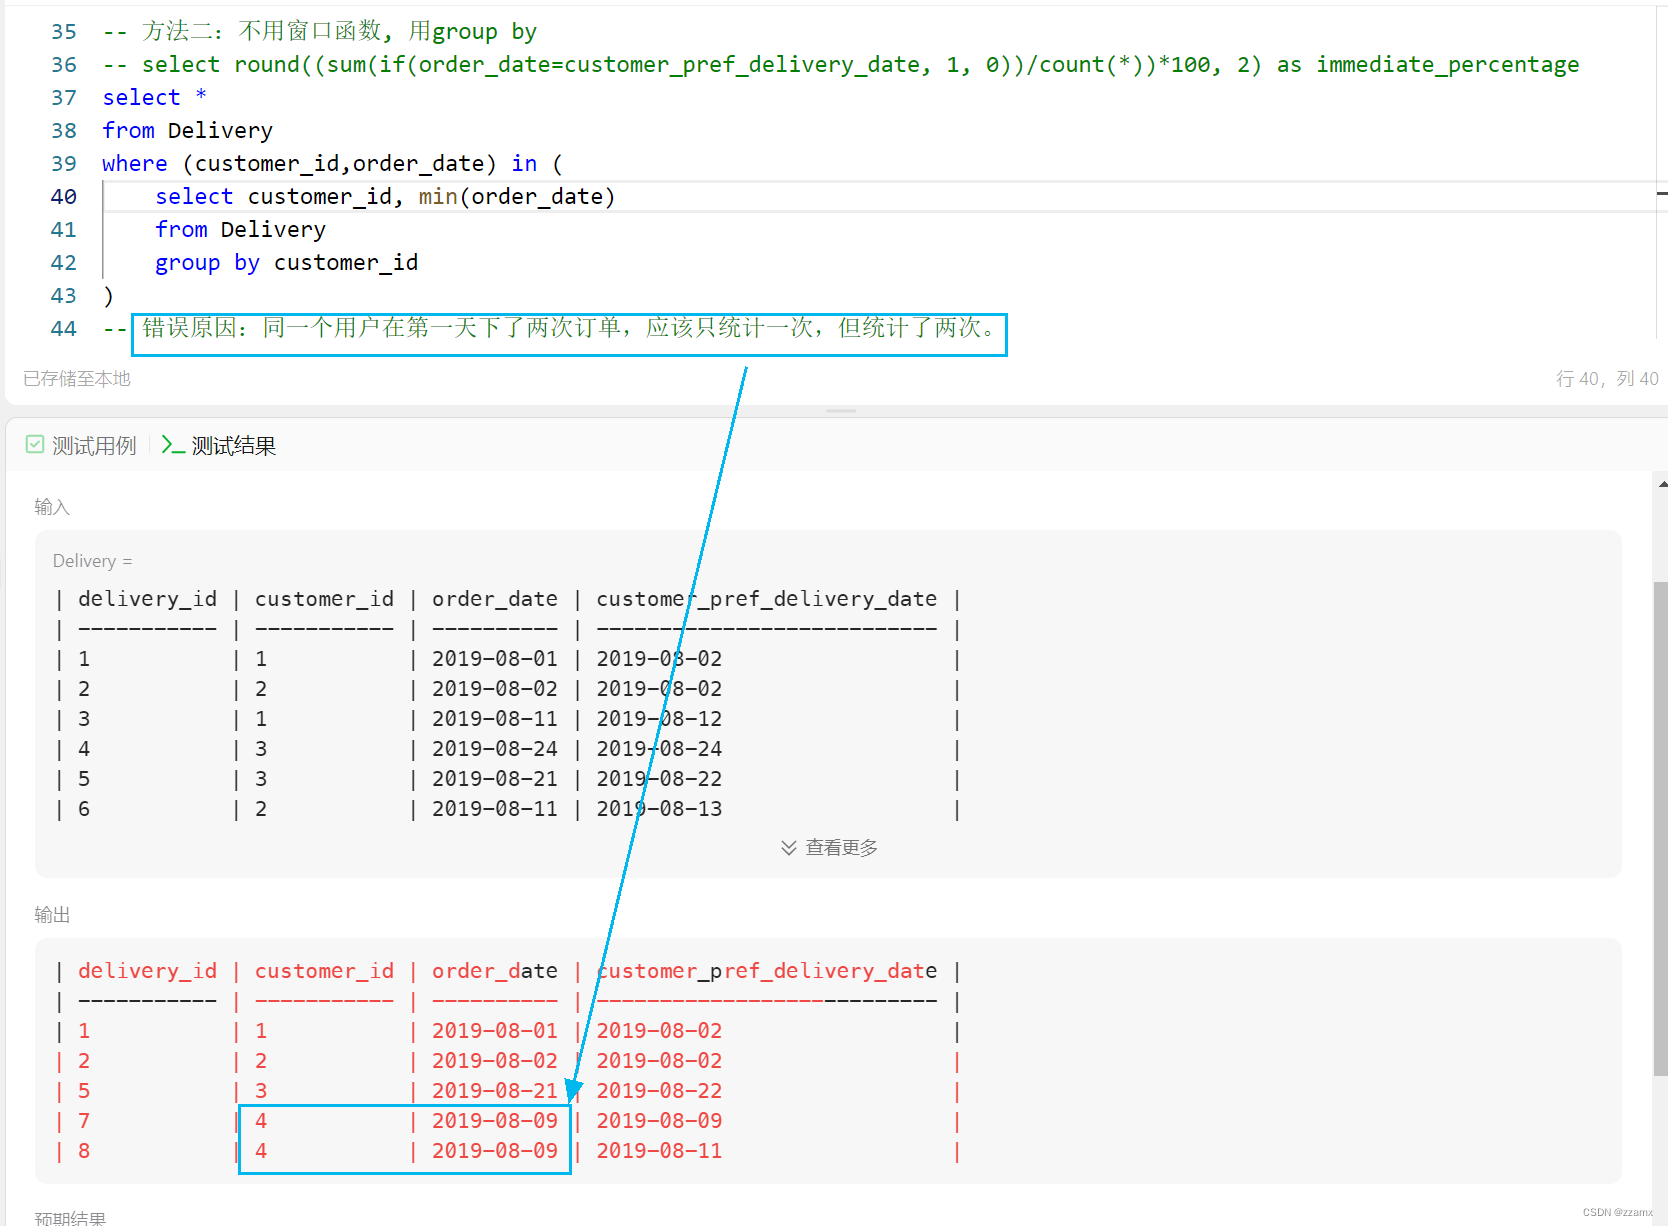
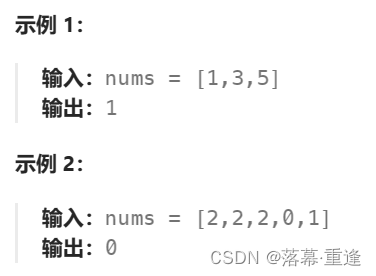
【SQL】1174. 即时食物配送 II (窗口函数row_number; group by写法;对比;定位错因)
前述 推荐学习: 通俗易懂的学会:SQL窗口函数 题目描述 leetcode题目:1174. 即时食物配送 II 写法一:窗口函数 分组排序(以customer_id 分组,按照order_date 排序),窗口函数应用。…...

mvcc介绍
前提:在介绍mvcc之前,先简单介绍一下mysql事务的相关问题,mvcc归根结底是用来解决事务并发问题的,当然这个解决不是全部解决,只是解决了其中的一部分问题! mysql事务 一、事务的基本要素(ACID&a…...
强化PaaS平台应用安全:关键策略与措施
PaaS(平台即服务,Platform-as-a-Service)是一种云计算服务模式,可以为客户提供一个完整的云平台(硬件、软件和基础架构)以用于快捷开发、运行和管理项目,从而降低了企业云计算应用的高成本和复杂…...

K8s 集群高可用master节点ETCD挂掉如何恢复?
写在前面 很常见的集群运维场景,整理分享博文内容为 K8s 集群高可用 master 节点故障如何恢复的过程理解不足小伙伴帮忙指正 不必太纠结于当下,也不必太忧虑未来,当你经历过一些事情的时候,眼前的风景已经和从前不一样了。——村上…...

【Godot 4.2】常见几何图形、网格、刻度线点求取函数及原理总结
概述 本篇为ShapePoints静态函数库的补充和辅助文档。ShapePoints函数库是一个用于生成常见几何图形顶点数据(PackedVector2Array)的静态函数库。生成的数据可用于_draw和Line2D、Polygon2D等进行绘制和显示。因为不断地持续扩展,ShapePoint…...

突破本地媒体解码屏障:QQ影音 4K/H.265 硬件加速优化与 DLL 运行库环境修复
突破本地媒体解码屏障:QQ影音 4K/H.265 硬件加速优化与 DLL 运行库环境修复 在日常开发和技术写作中,我们经常需要处理本地音视频文件,或者截取一段高质量的 GIF 动图作为 GitHub PR、CSDN 博客的演示说明。 虽然目前市面上有 PotPlayer、V…...

5大核心功能掌握HandheldCompanion:Windows掌机终极控制伴侣
5大核心功能掌握HandheldCompanion:Windows掌机终极控制伴侣 【免费下载链接】HandheldCompanion ControllerService 项目地址: https://gitcode.com/gh_mirrors/ha/HandheldCompanion 你是否正在寻找一款能够彻底改变Windows掌机游戏体验的控制软件…...

抖音下载器深度解析:零基础轻松批量下载无水印视频
抖音下载器深度解析:零基础轻松批量下载无水印视频 【免费下载链接】douyin-downloader A practical Douyin downloader for both single-item and profile batch downloads, with progress display, retries, SQLite deduplication, and browser fallback support.…...

如何用500KB工具完全替代AWCC:AlienFX Tools终极指南
如何用500KB工具完全替代AWCC:AlienFX Tools终极指南 【免费下载链接】alienfx-tools Alienware systems lights, fans, and power control tools and apps 项目地址: https://gitcode.com/gh_mirrors/al/alienfx-tools 你是否厌倦了Alienware Command Cente…...

5分钟实现Rhino到Blender转换:3dm文件导入完整教程
5分钟实现Rhino到Blender转换:3dm文件导入完整教程 【免费下载链接】import_3dm Blender importer script for Rhinoceros 3D files 项目地址: https://gitcode.com/gh_mirrors/im/import_3dm 你是否为Rhino模型无法在Blender中完美呈现而烦恼?im…...

深度强化学习在自动驾驶赛车中的迁移优化实践
1. 项目概述:深度强化学习在自动驾驶赛车中的迁移优化在自动驾驶赛车领域,如何将仿真环境中训练的控制策略无缝迁移到真实车辆上一直是个棘手问题。传统方法通常面临两大挑战:仿真环境与真实物理世界之间的动力学差异(即所谓的&qu…...

量子误差校正的变分优化方法与应用
1. 量子误差校正的变分优化方法概述量子计算面临的核心挑战之一是量子态的脆弱性。在现实环境中,量子比特会与周围环境发生相互作用,导致量子信息丢失或退化。这种现象被称为量子退相干,是量子计算机实现大规模计算的主要障碍之一。传统量子误…...

实验二 基于 VMware Workstation 的虚拟机平台搭建、客户机安装与虚拟网络模式验证
作者:非凡大爹|版本:v1|日期:2026-03-24|DocID:CN-LAB-2026-03-VMNet-1-LG-V2 原创声明:本文为作者原创实验教学资料,首发于 CSDN。 版权声明:本文版权归作者…...

CVE-2025-48976:Apache Commons FileUpload 协议解析层内存崩溃漏洞深度解析
1. 这个漏洞不是“上传文件被黑了”,而是整个解析逻辑崩了Apache Commons FileUpload 是 Java 生态里最老牌、最被信任的文件上传处理库之一,从 2003 年发布第一个稳定版起,它就稳稳地嵌在 Struts2、Spring MVC(早期)、…...

【AI搜索引擎未来5年趋势白皮书】:20位顶尖AI架构师联合预测的7大不可逆变革
更多请点击: https://intelliparadigm.com 第一章:AI搜索引擎未来5年趋势总览 AI搜索引擎正从关键词匹配的“检索工具”加速演进为具备推理能力、上下文感知与主动服务意识的“智能认知中枢”。未来五年,其技术演进将围绕多模态理解、实时知…...