【嵌入式——QT】Charts常见的图表的绘制
【嵌入式——QT】Charts常见的图表的绘制
- 柱状图
- QBarSet
- QBarSeries
- QBarCategoryAxis
- 图示
- 饼图
- 堆叠柱状图
- 百分比柱状图
- 散点图和光滑曲线图
- 代码示例
柱状图
QBarSet
用于创建柱状图的数据集。
主要函数
- setLabel():设置数据集标签 ;
- setLabelBrush():设置标签的画刷 ;
- setLabelColor():设置标签的文字颜色 ;
- setLabelFont():设置标签的字体;
- setBorderColor():设置数据集的棒图边框颜色;
- setBrush():设置数据集的棒图画刷 ;
- setColor():设置数据集的棒图填充颜色 ;
- setPen():设置数据集的棒图边框画笔;
- append():添加一个数据到数据集 ;
- insert():在某个位置插入一个数据到数据集;
- remove():从某个位置开始删除一定数量的数据 ;
- replace():替换某个位置的数据 ;
- at():返回某个位置的数据;
- count():返回数据个数;
- sum():返回数据集内所有数据的和;
QBarSeries
柱状图序列,一个柱状图序列一般包含多个QBarSet数据集。
主要函数
- setBarWidth():设置数据棒的宽度;
- setLabelsVisible():设置数据棒的标签可见性;
- setLabelsFormat():设置数据棒的标签的格式;
- setLabelsPosition():设置数据棒的标签的位置;
- setLabelsAngle():设置数据棒的标签的角度;
- append():添加一个QBarSet数据集序列;
- insert():在某个位置插入一个QBarSet数据集到序列;
- remove():移除一个数据集,并删除数据集对象;
- take():移除出一个数据集,但是不删除数据集对象;
- clear():清除全部数据集,并删除数据集对象;
- barSets():返回数据集对象的列表;
- count():返回数据集个数;
QBarCategoryAxis
柱状图分类坐标,以文字标签形式表示的坐标。
主要函数
- append():添加一个类别到坐标轴;
- insert():在某个位置插入一个类别到坐标轴;
- replace():替换某个类别;
- remove():删除某个类别;
- clear():删除所有类别;
- at():返回某个索引位置的类别文字;
- count():返回类别的个数;
- setCategories():设置一个QStringList字符串列表作为坐标轴的类别文字,删除原来所有类别文字;
- setMin():设置坐标轴最小值;
- setMax():设置坐标轴最大值;
- setRange():设置坐标轴范围;
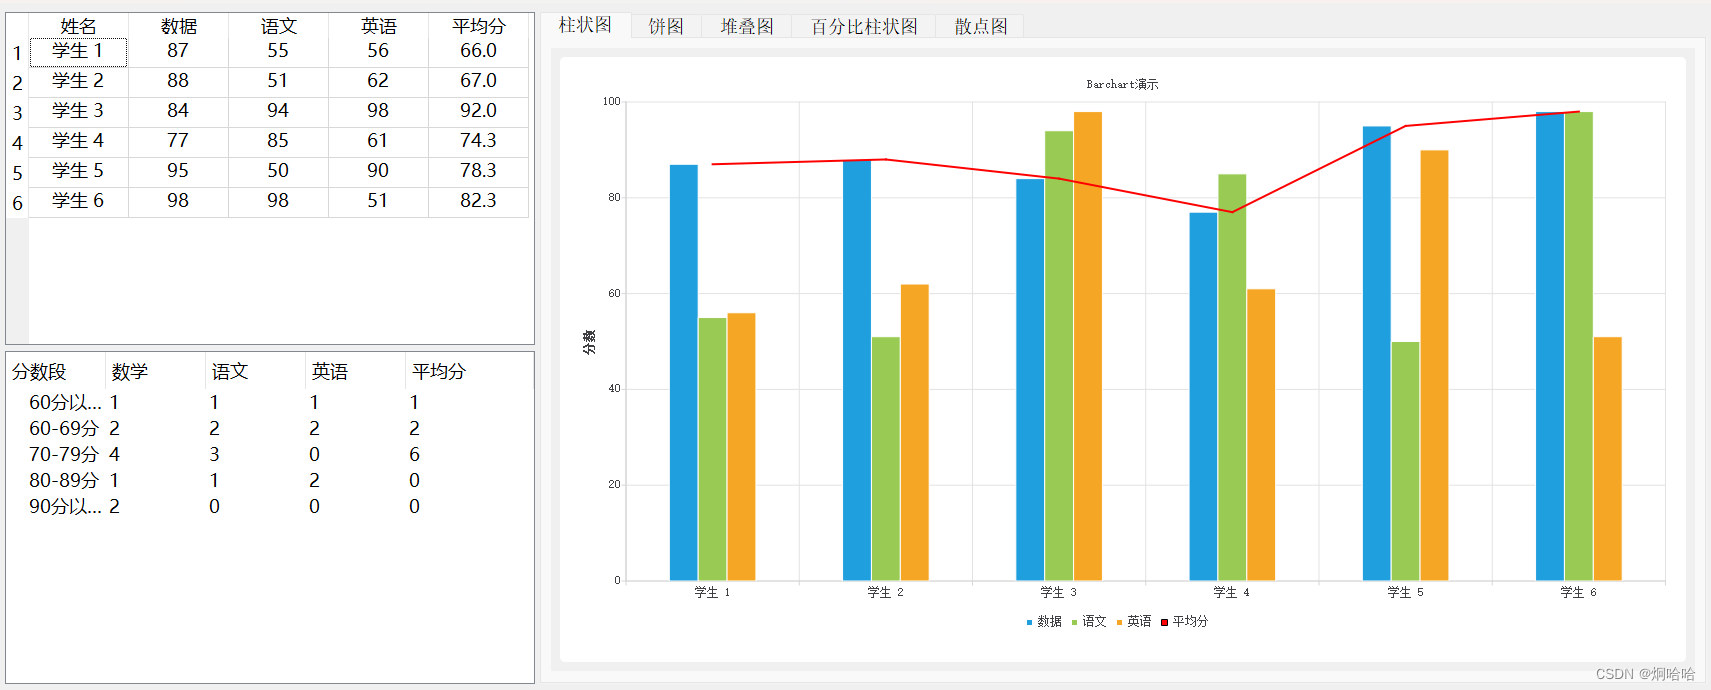
图示
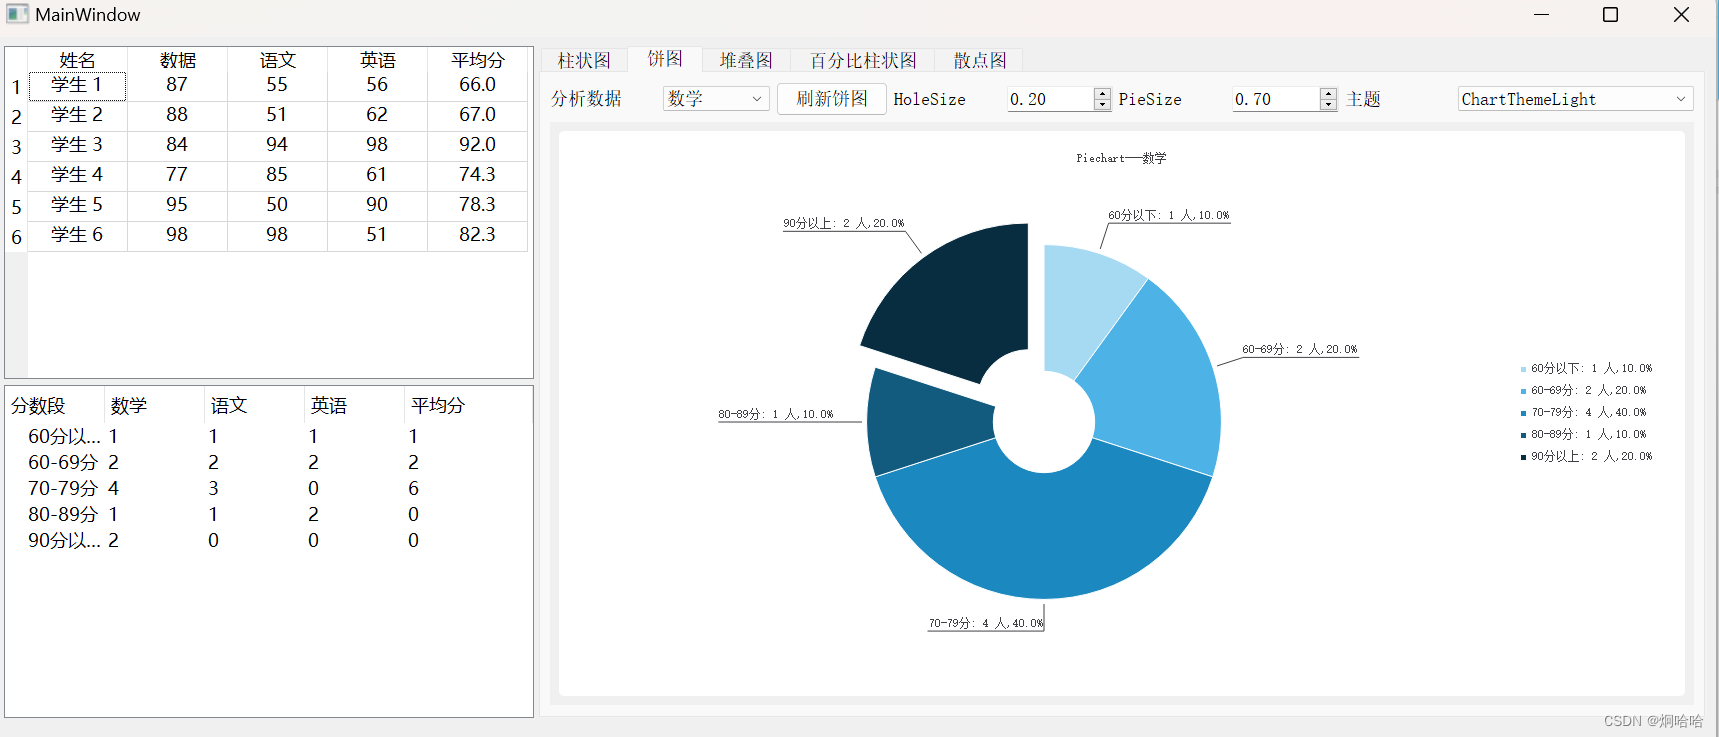
饼图
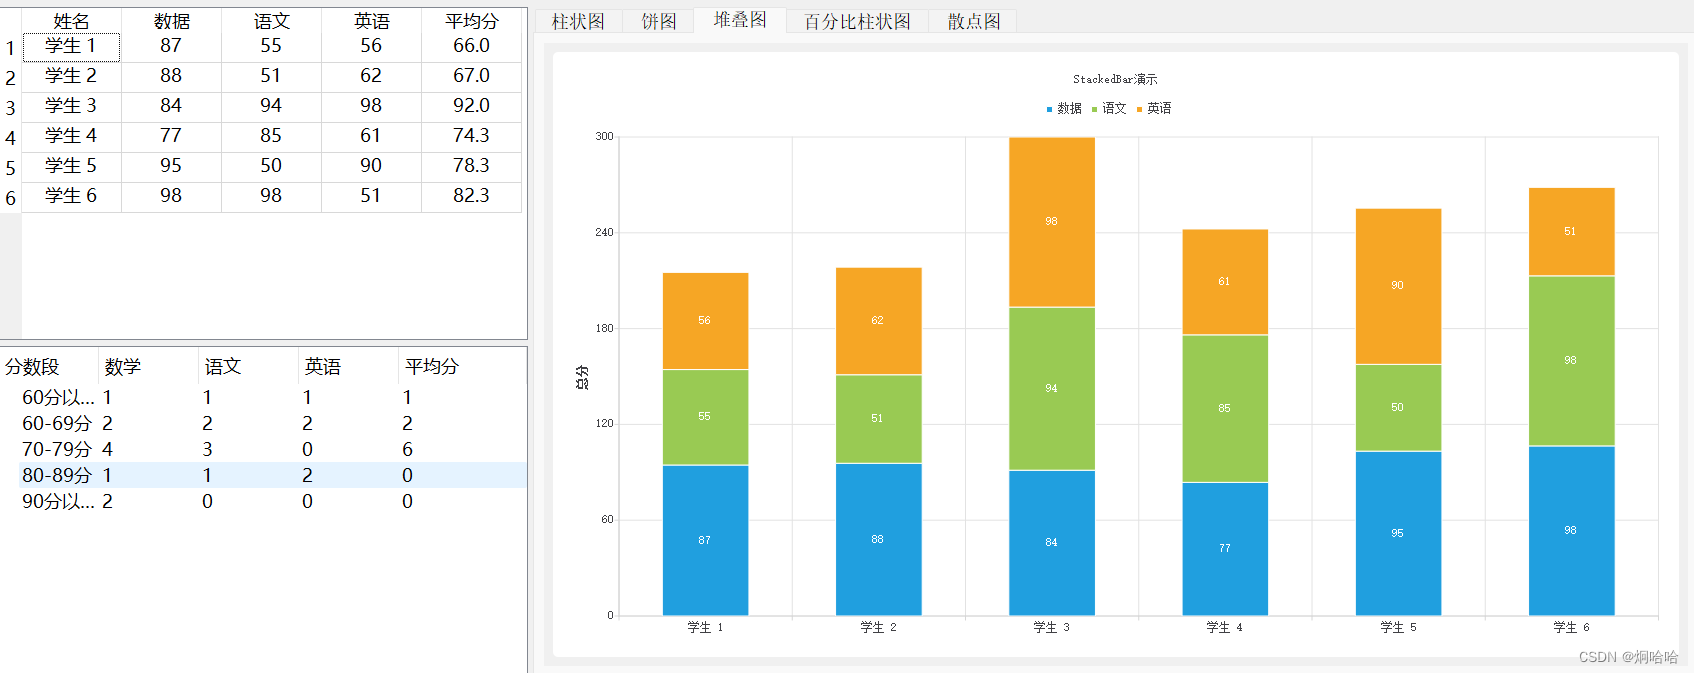
堆叠柱状图
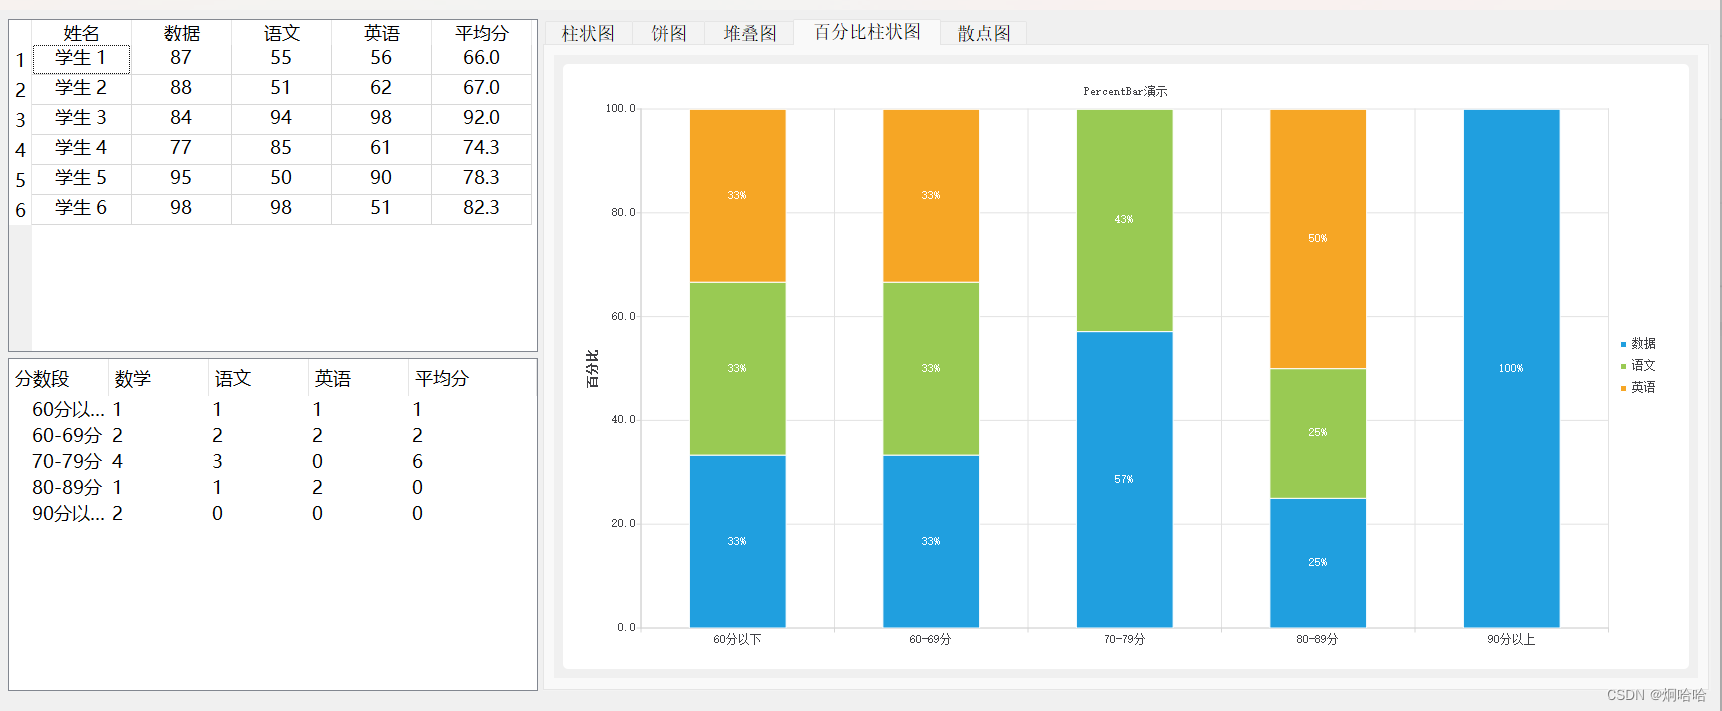
百分比柱状图
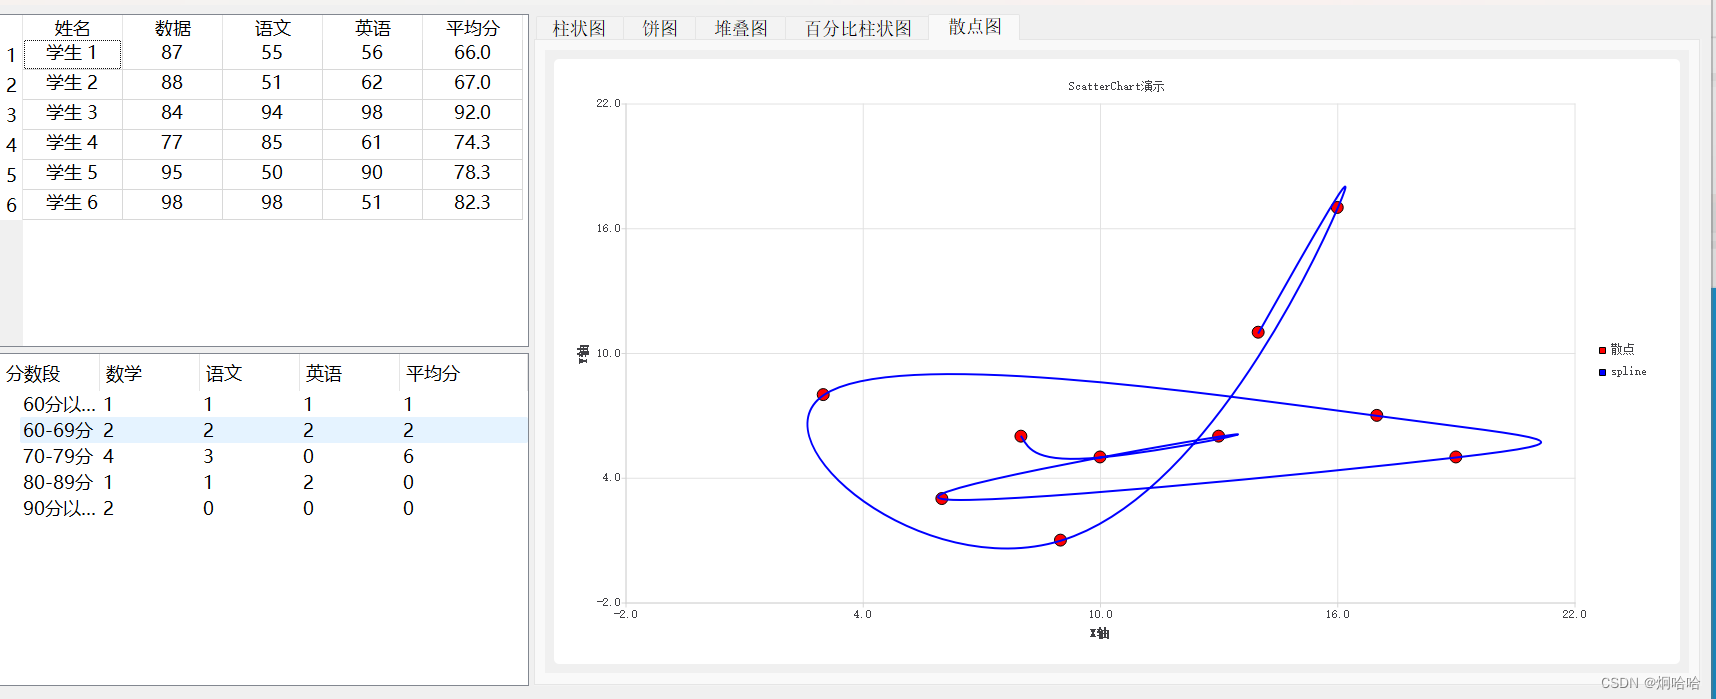
散点图和光滑曲线图
代码示例
QChartCommon.h
#ifndef QCHARTCOMMON_H
#define QCHARTCOMMON_H#include <QMainWindow>
#include <QtCharts>namespace Ui
{class QChartCommon;
}#define fixedColumnCount 5 //列数
#define initDataRowCount 6 //学生个数
#define colNoName 0 //姓名列编号
#define colNoMath 1 //数学列编号
#define colNoChinese 2 //语文列编号
#define colNoEnglish 3 //英语列编号
#define colNoAverage 4 //平均分列编号class QChartCommon : public QMainWindow
{Q_OBJECTpublic:explicit QChartCommon(QWidget* parent = nullptr);~QChartCommon();void initData();void initTreeWidget();void initBarChart();void buildBarChart();void initPieChart();void buildPieChart();void initStackedBar();void buildStackedBar();void initPercentBar();void buildPercentBar();void initScatterChart();void buildScatterChart();public slots:void on_itemChanged(QStandardItem* item);void on_pieSliceHighlight(bool flag);
private slots:void on_tabWidget_currentChanged(int index);void on_comboBox_2_currentIndexChanged(int index);void on_pushButton_clicked();void on_comboBox_currentIndexChanged(int index);private:Ui::QChartCommon* ui;QStandardItemModel* theModel;QChart* pieChart;
};#endif // QCHARTCOMMON_H
QChartCommon.cpp
#include "QChartCommon.h"
#include "ui_QChartCommon.h"#include <QTime>
QChartCommon::QChartCommon(QWidget* parent): QMainWindow(parent), ui(new Ui::QChartCommon)
{ui->setupUi(this);theModel = new QStandardItemModel(initDataRowCount, fixedColumnCount, this);initData();initTreeWidget();connect(theModel, SIGNAL(itemChanged(QStandardItem*)), this, SLOT(on_itemChanged(QStandardItem*)));ui->tableView->setModel(theModel);initBarChart();initPieChart();initStackedBar();initPercentBar();initScatterChart();on_tabWidget_currentChanged(0);
}QChartCommon::~QChartCommon()
{delete ui;
}void QChartCommon::initData()
{QStringList headerList;headerList<<u8"姓名"<<u8"数据"<<u8"语文"<<u8"英语"<<u8"平均分";theModel->setHorizontalHeaderLabels(headerList);qsrand(QTime::currentTime().second());for(int i=0; i<theModel->rowCount(); i++) {QString studName = QString::asprintf(u8"学生%2d", i+1);QStandardItem* aItem = new QStandardItem(studName);aItem->setTextAlignment(Qt::AlignHCenter);theModel->setItem(i, colNoName, aItem);qreal avgScore = 0;for(int j=colNoMath; j<=colNoEnglish; j++) {qreal score = 50.0+(qrand()%50);avgScore+=score;QStandardItem*  aItem1 = new QStandardItem(QString::asprintf("%.0f", score));aItem1->setTextAlignment(Qt::AlignHCenter);theModel->setItem(i, j, aItem1);}QStandardItem*  aItem2 = new QStandardItem(QString::asprintf("%.1f", avgScore/3));aItem2->setTextAlignment(Qt::AlignHCenter);theModel->setItem(i, colNoAverage, aItem2);}
}void QChartCommon::initTreeWidget()
{QTreeWidgetItem* item1 = new QTreeWidgetItem(1001);item1->setText(0, u8"60分以下");item1->setText(1, u8"1");item1->setText(2, u8"1");item1->setText(3, u8"1");item1->setText(4, u8"1");item1->setFlags(Qt::ItemIsSelectable | Qt::ItemIsUserCheckable|Qt::ItemIsEnabled | Qt::ItemIsAutoTristate);ui->treeWidget->addTopLevelItem(item1);QTreeWidgetItem* item2 = new QTreeWidgetItem(1002);item2->setText(0, u8"60-69分");item2->setText(1, u8"2");item2->setText(2, u8"2");item2->setText(3, u8"2");item2->setText(4, u8"2");item2->setFlags(Qt::ItemIsSelectable | Qt::ItemIsUserCheckable|Qt::ItemIsEnabled | Qt::ItemIsAutoTristate);ui->treeWidget->addTopLevelItem(item2);QTreeWidgetItem* item3 = new QTreeWidgetItem(1003);item3->setText(0, u8"70-79分");item3->setText(1, u8"4");item3->setText(2, u8"3");item3->setText(3, u8"0");item3->setText(4, u8"6");item3->setFlags(Qt::ItemIsSelectable | Qt::ItemIsUserCheckable|Qt::ItemIsEnabled | Qt::ItemIsAutoTristate);ui->treeWidget->addTopLevelItem(item3);QTreeWidgetItem* item4 = new QTreeWidgetItem(1004);item4->setText(0, u8"80-89分");item4->setText(1, u8"1");item4->setText(2, u8"1");item4->setText(3, u8"2");item4->setText(4, u8"0");item4->setFlags(Qt::ItemIsSelectable | Qt::ItemIsUserCheckable|Qt::ItemIsEnabled | Qt::ItemIsAutoTristate);ui->treeWidget->addTopLevelItem(item4);QTreeWidgetItem* item5 = new QTreeWidgetItem(1005);item5->setText(0, u8"90分以上");item5->setText(1, u8"2");item5->setText(2, u8"0");item5->setText(3, u8"0");item5->setText(4, u8"0");item5->setFlags(Qt::ItemIsSelectable | Qt::ItemIsUserCheckable|Qt::ItemIsEnabled | Qt::ItemIsAutoTristate);ui->treeWidget->addTopLevelItem(item5);
}//柱状图
void QChartCommon::initBarChart()
{QChart* chart = new QChart();chart->setTitle(u8"Barchart演示");chart->setAnimationOptions(QChart::SeriesAnimations);ui->graphicsViewBar->setChart(chart);ui->graphicsViewBar->setRenderHint(QPainter::Antialiasing);
}
//柱状图
void QChartCommon::buildBarChart()
{QChart* chart = ui->graphicsViewBar->chart();//获取关联的chartchart->removeAllSeries();//删除所有序列chart->removeAxis(chart->axisX());//删除X轴chart->removeAxis(chart->axisY());//删除Y轴QBarSet* setMath = new QBarSet(theModel->horizontalHeaderItem(colNoMath)->text());QBarSet* setChinese = new QBarSet(theModel->horizontalHeaderItem(colNoChinese)->text());QBarSet* setEnglish = new QBarSet(theModel->horizontalHeaderItem(colNoEnglish)->text());QLineSeries* line = new QLineSeries();line->setName(theModel->horizontalHeaderItem(colNoAverage)->text());QPen pen;pen.setColor(Qt::red);pen.setWidth(2);line->setPen(pen);for(int i=0; i<theModel->rowCount(); i++) {setMath->append(theModel->item(i, colNoMath)->text().toInt());setChinese->append(theModel->item(i, colNoChinese)->text().toInt());setEnglish->append(theModel->item(i, colNoEnglish)->text().toInt());line->append(QPointF(i, theModel->item(i, colNoMath)->text().toFloat()));}//柱状图序列QBarSeries* series = new QBarSeries();series->append(setMath);series->append(setChinese);series->append(setEnglish);chart->addSeries(series);chart->addSeries(line);//横坐标字符串QStringList categories;for(int i=0; i<theModel->rowCount(); i++) {categories<<theModel->item(i, colNoName)->text();}//横坐标QBarCategoryAxis* axisX = new QBarCategoryAxis();// axisX->append(categories);axisX->setCategories(categories);chart->setAxisX(axisX, series);chart->setAxisX(axisX, line);axisX->setRange(categories.at(0), categories.at(categories.count()-1));//纵坐标QValueAxis* axisY = new QValueAxis();axisY->setRange(0, 100);axisY->setTitleText(u8"分数");axisY->setTickCount(6);axisY->setLabelFormat("%.0f");chart->setAxisY(axisY, series);chart->setAxisY(axisY, line);chart->legend()->setVisible(true);chart->legend()->setAlignment(Qt::AlignBottom);
}//饼图
void QChartCommon::initPieChart()
{pieChart = new QChart();pieChart->setTitle(u8"Piechart演示");pieChart->setAnimationOptions(QChart::SeriesAnimations);ui->graphicsViewPie->setChart(pieChart);ui->graphicsViewPie->setRenderHint(QPainter::Antialiasing);ui->comboBox->addItem(u8"数学", 0);ui->comboBox->addItem(u8"语文", 1);ui->comboBox->addItem(u8"英语", 2);ui->comboBox->addItem(u8"平均分", 3);ui->comboBox_2->addItem("ChartThemeLight", 0);ui->comboBox_2->addItem("ChartThemeBlueCerulean", 1);ui->comboBox_2->addItem("ChartThemeDark", 2);ui->comboBox_2->addItem("ChartThemeBrownSand", 3);ui->comboBox_2->addItem("ChartThemeBlueNcs", 4);ui->comboBox_2->addItem("ChartThemeHighContrast", 5);ui->comboBox_2->addItem("ChartThemeBlueIcy", 6);ui->comboBox_2->addItem("ChartThemeQt", 7);ui->doubleSpinBoxHole->setValue(0.20);ui->doubleSpinBoxPie->setValue(0.70);
}
//饼图
void QChartCommon::buildPieChart()
{QChart* chart = ui->graphicsViewPie->chart();chart->removeAllSeries();int colNo = 1+ui->comboBox->currentIndex();QPieSeries* series = new QPieSeries();//饼图中心空心的大小series->setHoleSize(ui->doubleSpinBoxHole->value());for(int i=0; i<=4; i++) {//添加分块数据QTreeWidgetItem* item = ui->treeWidget->topLevelItem(i);series->append(item->text(0), item->text(colNo).toFloat());// series->append(ui->comboBox->itemText(i), 25.0);}QPieSlice* slice;//饼图分块for(int i=0; i<=4; i++) {slice=series->slices().at(i);//获取分块slice->setLabel(slice->label()+QString::asprintf(u8": %.0f 人,%.1f%%", slice->value(), slice->percentage()*100));connect(slice, SIGNAL(hovered(bool)), this, SLOT(on_pieSliceHighlight(bool)));}//最后一个设置为explodedslice->setExploded(true);//必须添加完slice之后再设置series->setLabelsVisible(true);//添加饼图序列chart->addSeries(series);chart->setTitle("Piechart---"+ui->comboBox->currentText());chart->legend()->setVisible(true);chart->legend()->setAlignment(Qt::AlignRight);
}
//堆叠图
void QChartCommon::initStackedBar()
{QChart* chart = new QChart();chart->setTitle(u8"StackedBar演示");chart->setAnimationOptions(QChart::SeriesAnimations);ui->graphicsViewStacked->setChart(chart);ui->graphicsViewStacked->setRenderHint(QPainter::Antialiasing);
}
//堆叠图
void QChartCommon::buildStackedBar()
{QChart* chart = ui->graphicsViewStacked->chart();chart->removeAllSeries();chart->removeAxis(chart->axisX());chart->removeAxis(chart->axisY());QBarSet* setMath = new QBarSet(theModel->horizontalHeaderItem(colNoMath)->text());QBarSet* setChinese = new QBarSet(theModel->horizontalHeaderItem(colNoChinese)->text());QBarSet* setEnglish = new QBarSet(theModel->horizontalHeaderItem(colNoEnglish)->text());for(int i=0; i<theModel->rowCount(); i++) {//添加分数到数据集setMath->append(theModel->item(i, colNoMath)->text().toInt());setChinese->append(theModel->item(i, colNoChinese)->text().toInt());setEnglish->append(theModel->item(i, colNoEnglish)->text().toInt());}//创建QStackedBarSeries对象并添加数据集QStackedBarSeries* series = new QStackedBarSeries();series->append(setMath);series->append(setChinese);series->append(setEnglish);series->setLabelsVisible(true);chart->addSeries(series);QStringList categories;for(int i=0; i<theModel->rowCount(); i++) {categories<<theModel->item(i, colNoName)->text();}//创建横轴QBarCategoryAxis* axisX = new QBarCategoryAxis();axisX->setCategories(categories);chart->setAxisX(axisX);axisX->setRange(categories.at(0), categories.at(categories.count()-1));//创建Y轴QValueAxis* axisY = new QValueAxis();axisY->setRange(0, 300);axisY->setTitleText(u8"总分");axisY->setTickCount(6);axisY->setLabelFormat("%.0f");chart->setAxisY(axisY);chart->legend()->setVisible(true);chart->legend()->setAlignment(Qt::AlignTop);
}
//百分比柱状图
void QChartCommon::initPercentBar()
{QChart* chart = new QChart();chart->setTitle(u8"PercentBar演示");chart->setAnimationOptions(QChart::SeriesAnimations);ui->graphicsViewPercent->setChart(chart);ui->graphicsViewPercent->setRenderHint(QPainter::Antialiasing);
}
//百分比柱状图
void QChartCommon::buildPercentBar()
{QChart* chart = ui->graphicsViewPercent->chart();chart->removeAllSeries();chart->removeAxis(chart->axisX());chart->removeAxis(chart->axisY());QBarSet* setMath = new QBarSet(theModel->horizontalHeaderItem(colNoMath)->text());QBarSet* setChinese = new QBarSet(theModel->horizontalHeaderItem(colNoChinese)->text());QBarSet* setEnglish = new QBarSet(theModel->horizontalHeaderItem(colNoEnglish)->text());QTreeWidgetItem* item;QStringList categories;for(int i=0; i<=4; i++) {//添加分块数据item = ui->treeWidget->topLevelItem(i);categories<<item->text(0);setMath->append(item->text(colNoMath).toFloat());setChinese->append(item->text(colNoChinese).toFloat());setEnglish->append(item->text(colNoEnglish).toFloat());}QPercentBarSeries* series = new QPercentBarSeries();series->append(setMath);series->append(setChinese);series->append(setEnglish);series->setLabelsVisible(true);chart->addSeries(series);QBarCategoryAxis* axisX = new QBarCategoryAxis();axisX->setCategories(categories);chart->setAxisX(axisX);axisX->setRange(categories.at(0), categories.at(categories.count()-1));//创建Y轴QValueAxis* axisY = new QValueAxis();axisY->setRange(0, 100);axisY->setTitleText(u8"百分比");axisY->setTickCount(6);axisY->setLabelFormat("%.1f");chart->setAxisY(axisY, series);chart->legend()->setVisible(true);chart->legend()->setAlignment(Qt::AlignRight);
}
//散点图
void QChartCommon::initScatterChart()
{QChart* chart = new QChart();chart->setTitle(u8"ScatterChart演示");chart->setAnimationOptions(QChart::SeriesAnimations);ui->graphicsViewScatter->setChart(chart);ui->graphicsViewScatter->setRenderHint(QPainter::Antialiasing);
}
//散点图
void QChartCommon::buildScatterChart()
{QChart* chart = ui->graphicsViewScatter->chart();chart->removeAllSeries();chart->removeAxis(chart->axisX());chart->removeAxis(chart->axisY());QSplineSeries* seriesLine = new QSplineSeries();seriesLine->setName("spline");QPen pen;pen.setColor(Qt::blue);pen.setWidth(2);seriesLine->setPen(pen);QScatterSeries* series0 = new QScatterSeries();series0->setName(u8"散点");series0->setMarkerShape(QScatterSeries::MarkerShapeCircle);series0->setBorderColor(Qt::black);series0->setBrush(QBrush(Qt::red));series0->setMarkerSize(12);qsrand(QTime::currentTime().second());for(int i=0; i<10; i++) {int x = (qrand()%20);int y= (qrand()%20);series0->append(x, y); //散点序列seriesLine->append(x, y); //光滑曲线}chart->addSeries(series0);chart->addSeries(seriesLine);chart->createDefaultAxes();//创建缺省坐标轴chart->axisX()->setTitleText(u8"X轴");chart->axisX()->setRange(-2, 22);chart->axisY()->setTitleText(u8"Y轴");chart->axisY()->setRange(-2, 22);chart->legend()->setVisible(true);chart->legend()->setAlignment(Qt::AlignRight);
}void QChartCommon::on_itemChanged(QStandardItem* item)
{if((item->column()<colNoMath) || (item->column()>colNoEnglish)) {return;}int rowNo = item->row();qreal avg = 0;QStandardItem* aItem;for(int i=colNoMath; i<=colNoEnglish; i++) {aItem = theModel->item(rowNo, i);avg += aItem->text().toDouble();}avg = avg/3;aItem = theModel->item(rowNo, colNoAverage);aItem->setText(QString::asprintf("%.1f", avg));
}void QChartCommon::on_pieSliceHighlight(bool flag)
{QPieSlice* slice = (QPieSlice*)sender();slice->setExploded(flag);
}void QChartCommon::on_tabWidget_currentChanged(int index)
{switch(index) {case 0:buildBarChart();break;case 1:buildPieChart();break;case 2:buildStackedBar();break;case 3:buildPercentBar();break;case 4:buildScatterChart();break;}
}void QChartCommon::on_comboBox_2_currentIndexChanged(int index)
{switch(index) {case 0:pieChart->setTheme(QChart::ChartThemeLight);break;case 1:pieChart->setTheme(QChart::ChartThemeBlueCerulean);break;case 2:pieChart->setTheme(QChart::ChartThemeDark);break;case 3:pieChart->setTheme(QChart::ChartThemeBrownSand);break;case 4:pieChart->setTheme(QChart::ChartThemeBlueNcs);break;case 5:pieChart->setTheme(QChart::ChartThemeHighContrast);break;case 6:pieChart->setTheme(QChart::ChartThemeBlueIcy);break;case 7:pieChart->setTheme(QChart::ChartThemeQt);break;}
}void QChartCommon::on_pushButton_clicked()
{buildPieChart();
}void QChartCommon::on_comboBox_currentIndexChanged(int index)
{buildPieChart();
}
相关文章:
【嵌入式——QT】Charts常见的图表的绘制
【嵌入式——QT】Charts常见的图表的绘制 柱状图QBarSetQBarSeriesQBarCategoryAxis图示 饼图堆叠柱状图百分比柱状图散点图和光滑曲线图代码示例 柱状图 QBarSet 用于创建柱状图的数据集。 主要函数 setLabel():设置数据集标签 ;setLabelBrush()&am…...
pandas读写excel,csv
1.读excel 1.to_dict() 函数基本语法 DataFrame.to_dict (self, orientdict , into ) --- 官方文档 函数种只需要填写一个参数:orient 即可 ,但对于写入orient的不同,字典的构造方式也不同,官网一共给出了6种,…...
清华大学突破性研究:GVGEN技术,7秒内从文字到3D高保真生成
引言:3D模型生成的挑战与机遇 随着计算机图形学的发展,3D模型的生成在各个行业中变得越来越重要,包括视频游戏设计、电影制作以及AR/VR技术等。在3D建模的不同方面中,从文本描述生成3D模型成为一个特别有趣的研究领域,…...
软件测试要学习的基础知识——黑盒测试
概述 黑盒测试也叫功能测试,通过测试来检测每个功能是否都能正常使用。在测试中,把程序看作是一个不能打开的黑盒子,在完全不考虑程序内部结构和内部特性的情况下,对程序接口进行测试,只检查程序功能是否按照需求规格…...
如何用Airtest脚本连接无线Android设备?
之前我们已经详细介绍过如何用AirtestIDE无线连接Android设备,它的关键点在于,需要先 adb connect 一次,才能点击 connect 按钮无线连接上该设备: 但是有很多同学,在使用纯Airtest脚本的形式连接无线设备时,…...
)
c语言函数大全(C开头)
c语言函数大全(C开头) There is no nutrition in the blog content. After reading it, you will not only suffer from malnutrition, but also impotence. The blog content is all parallel goods. Those who are worried about being cheated should leave quickly. 函数名…...
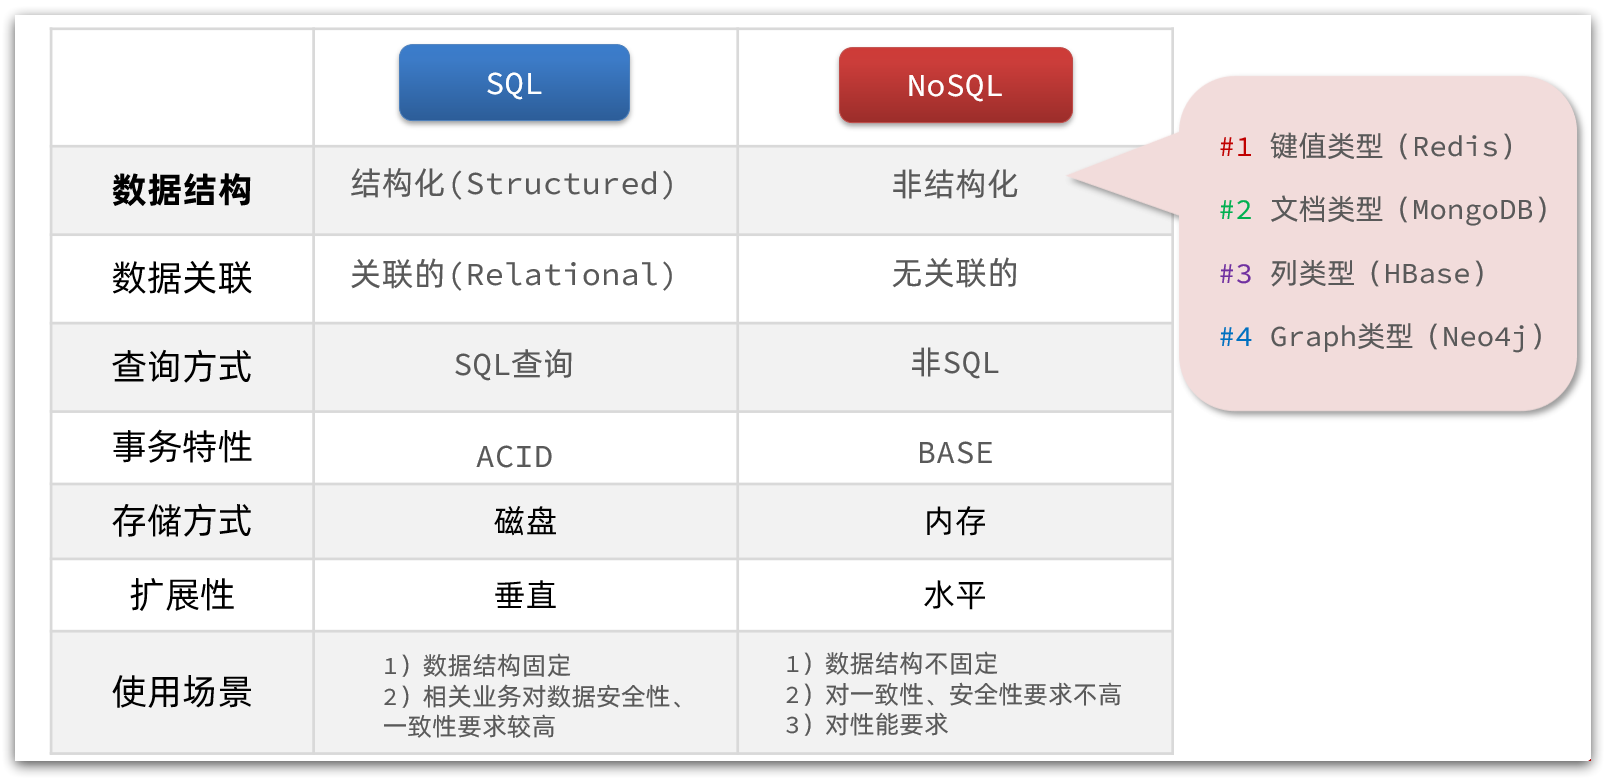
初始Redis关联和非关联
基础篇Redis 3.初始Redis 3.1.2.关联和非关联 传统数据库的表与表之间往往存在关联,例如外键: 而非关系型数据库不存在关联关系,要维护关系要么靠代码中的业务逻辑,要么靠数据之间的耦合: {id: 1,name: "张三…...

Redis 更新开源许可证 - 不再支持云供应商提供商业化的 Redis
原文:Rowan Trollope - 2024.03.20 未来的 Redis 版本将继续在 RSALv2 和 SSPLv1 双许可证下提供源代码的免费和宽松使用;这些版本将整合先前仅在 Redis Stack 中可用的高级数据类型和处理引擎。 从今天开始,所有未来的 Redis 版本都将以开…...

生产者Producer往BufferQueue中写数据的过程
In normal operation, the producer calls dequeueBuffer() to get an empty buffer, fills it with data, then calls queueBuffer() to make it available to the consumer 代码如下: // XXX: Tests that fork a process to hold the BufferQueue must run bef…...

使用 Vite 和 Bun 构建前端
虽然 Vite 目前可以与 Bun 配合使用,但它尚未进行大量优化,也未调整以使用 Bun 的打包器、模块解析器或转译器。 Vite 可以与 Bun 完美兼容。从 Vite 的模板开始使用吧。 bun create vite my-app ✔ Select a framework: › React ✔ Select a variant:…...
如何设置IDEA远程连接服务器开发环境并结合cpolar实现ssh远程开发
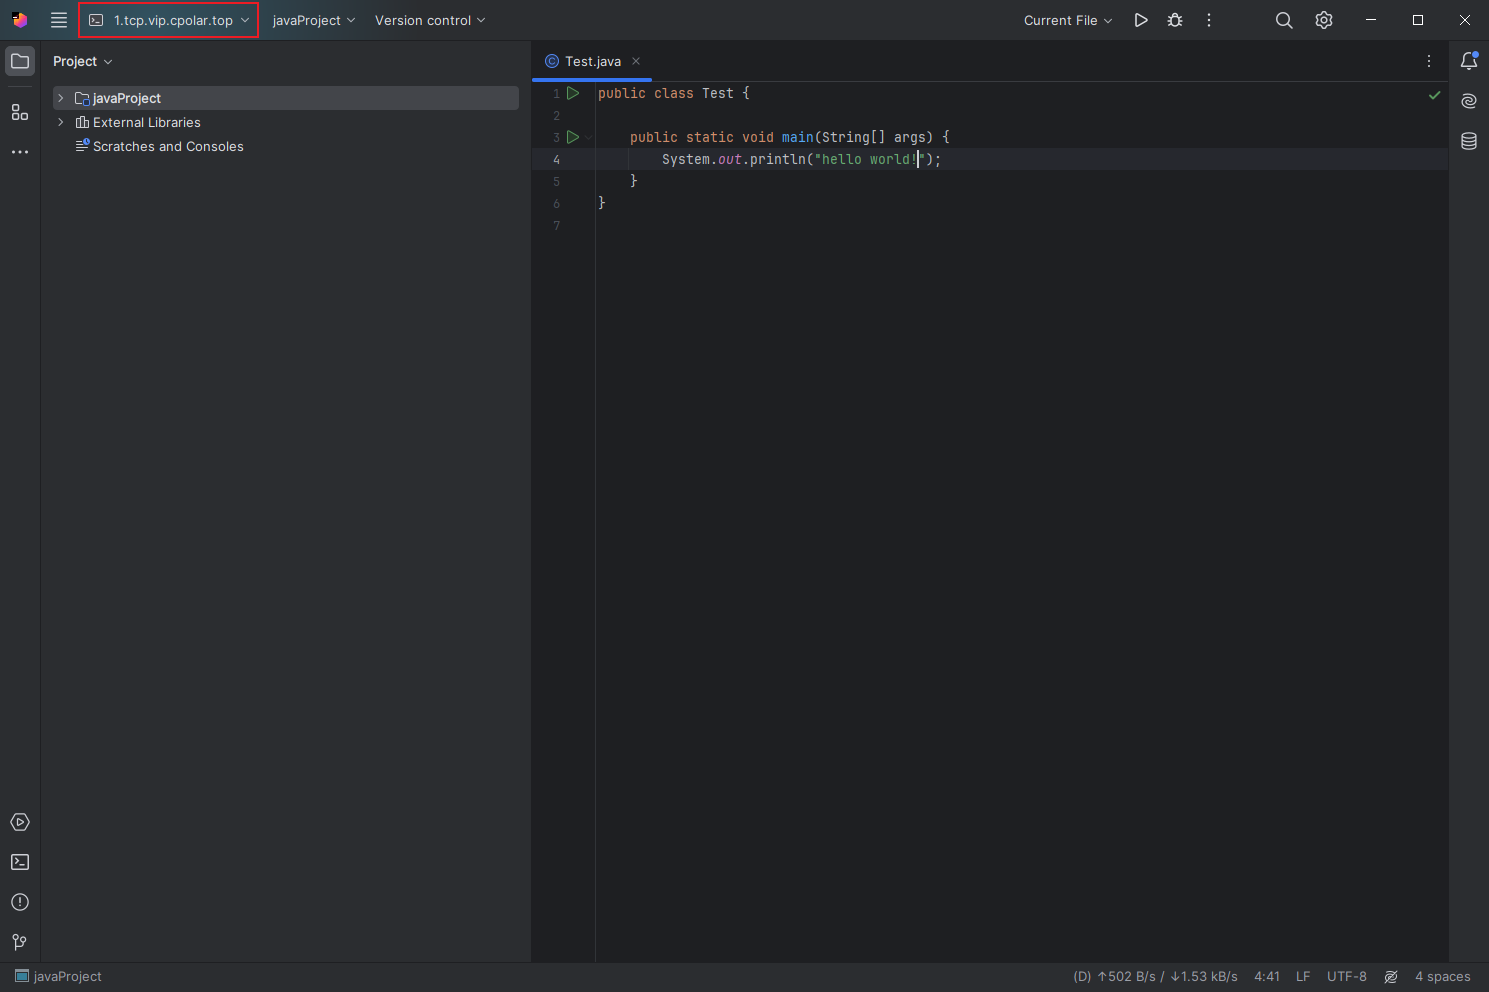
文章目录 1. 检查Linux SSH服务2. 本地连接测试3. Linux 安装Cpolar4. 创建远程连接公网地址5. 公网远程连接测试6. 固定连接公网地址7. 固定地址连接测试 本文主要介绍如何在IDEA中设置远程连接服务器开发环境,并结合Cpolar内网穿透工具实现无公网远程连接…...
【项目管理后台】Vue3+Ts+Sass实战框架搭建二
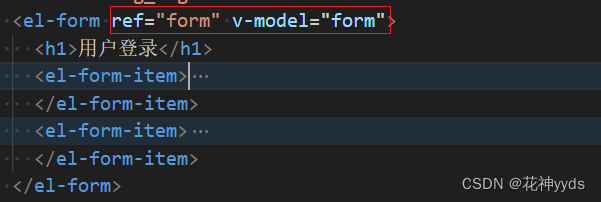
Vue3TsSass搭建 git cz的配置mock 数据配置viteMockServe 建立mock/user.ts文件夹测试一下mock是否配置成功 axios二次封装解决env报错问题,ImportMeta”上不存在属性“env” 统一管理相关接口新建api/index.js 路由的配置建立router/index.ts将路由进行集中封装&am…...
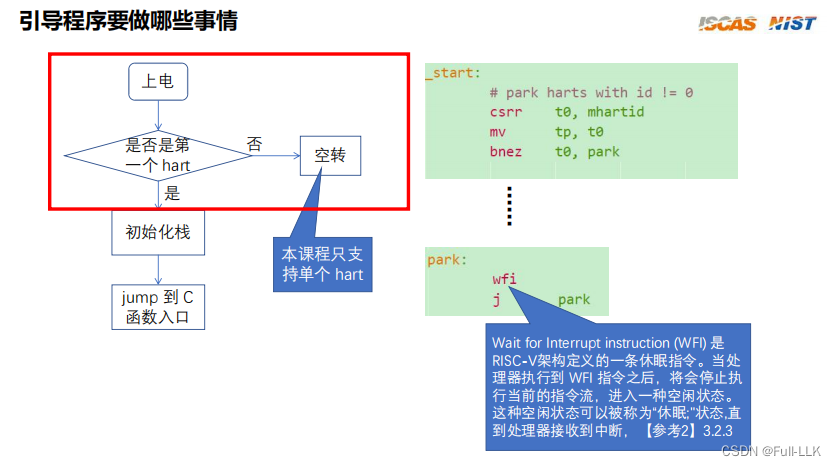
制作一个RISC-V的操作系统六-bootstrap program(risv 引导程序)
文章目录 硬件基本概念qemu-virt地址映射系统引导CSR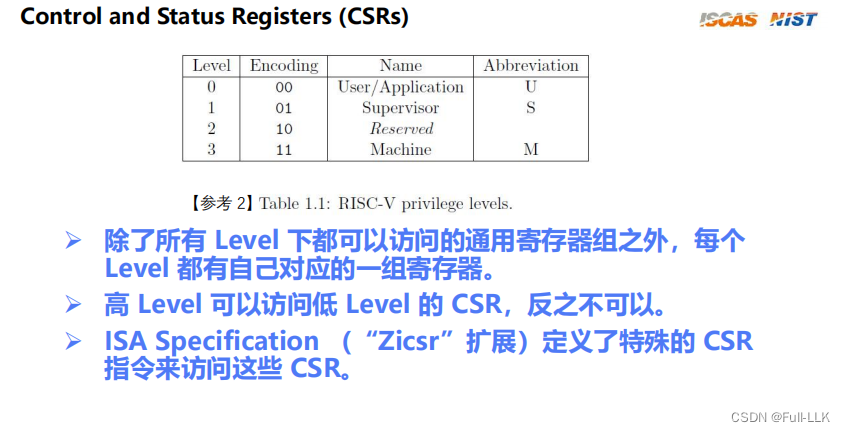machine模式下的csr对应的csr指令csrrwcsrrs mhartid引导程序做的事情判断当前hart是不是第一个hart初始化栈跳转到c语言的…...

haproxy和keepalived的区别与联系
HAProxy(High Availability Proxy) 是一个开源的、高效且可靠的解决方案,主要用于负载均衡。它工作在应用层(第七层),支持多种协议,如HTTP、HTTPS、FTP等。HAProxy通过健康检查机制持续监控后…...
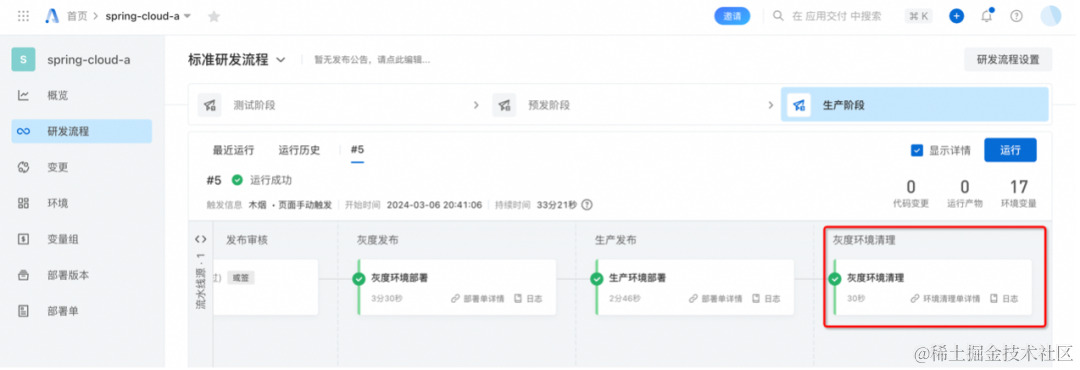
云效 AppStack + 阿里云 MSE 实现应用服务全链路灰度
作者:周静、吴宇奇、泮圣伟 在应用开发测试验证通过后、进行生产发布前,为了降低新版本发布带来的风险,期望能够先部署到灰度环境,用小部分业务流量进行全链路灰度验证,验证通过后再全量发布生产。本文主要介绍如何通…...

pta L1-004 计算摄氏温度
L1-004 计算摄氏温度 分数 5 全屏浏览 切换布局 作者 陈建海 单位 浙江大学 给定一个华氏温度F,本题要求编写程序,计算对应的摄氏温度C。计算公式:C5(F−32)/9。题目保证输入与输出均在整型范围内。 输入格式: 输入在一行中给出一个华氏…...

毕业论文降重(gpt+完美降重指令),sci论文降重gpt指令——超级好用,重复率低于4%
1. 降重方法:gpt降重指令 2. gpt网站 https://yiyan.baidu.com/ https://chat.openai.com/ 3. 降重指令——非常好用!!sci论文,本硕大论文都可使用! 请帮我把下面句子重新组织,通过调整句子逻辑࿰…...
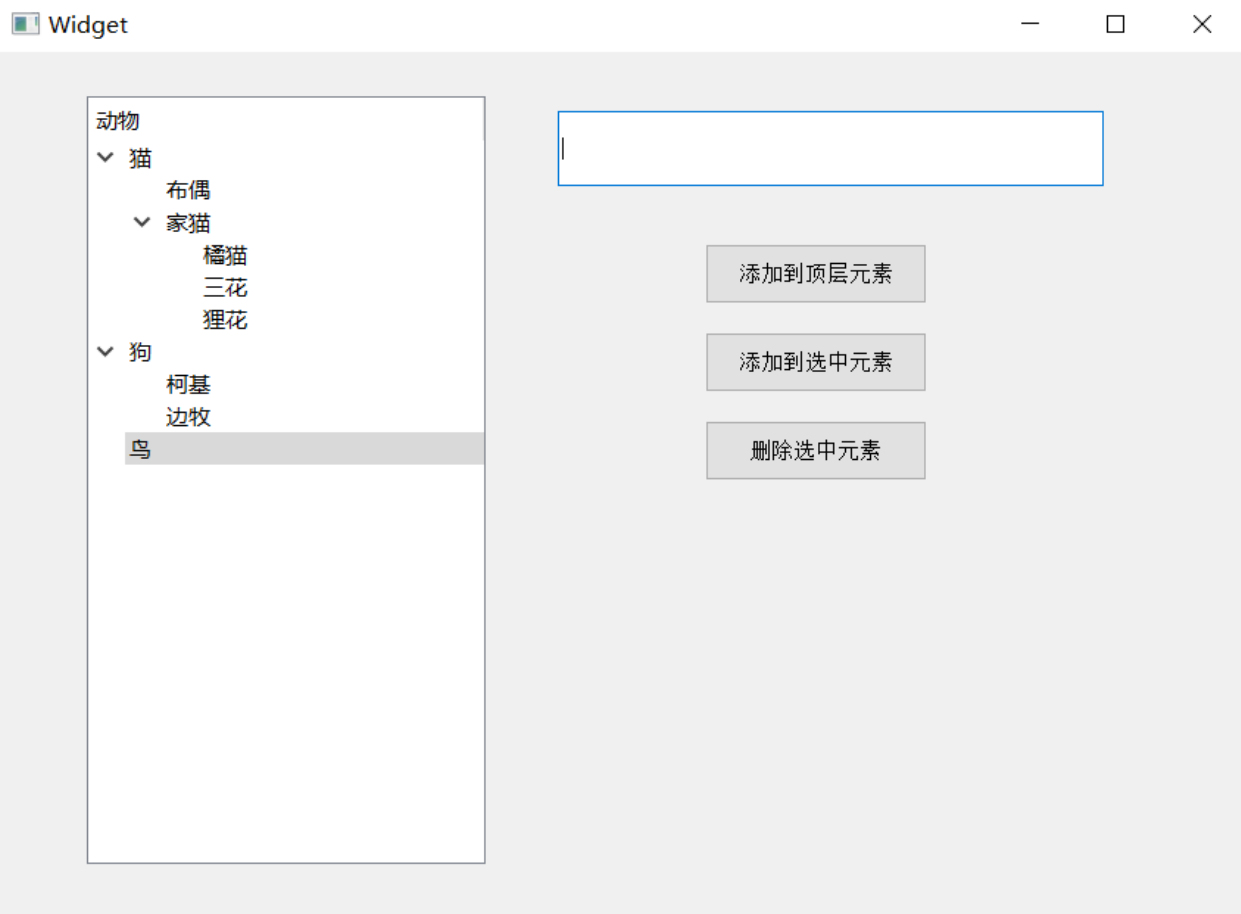
Qt 多元素控件
Qt开发 多元素控件 Qt 中提供的多元素控件有: QListWidgetQListViewQTableWidgetQTableViewQTreeWidgetQTreeView xxWidget 和 xxView 之间的区别 以 QTableWidget 和 QTableView 为例. QTableView 是基于 MVC 设计的控件. QTableView 自身不持有数据. 使用QTableView 的 …...

LeetCode热题Hot100-两数相加
一刷一刷 给你两个 非空 的链表,表示两个非负的整数。它们每位数字都是按照 逆序 的方式存储的,并且每个节点只能存储 一位 数字。 请你将两个数相加,并以相同形式返回一个表示和的链表。 你可以假设除了数字 0 之外,这两个数都不…...

Selenium 自动化 —— 浏览器窗口操作
更多内容请关注我的专栏: 入门和 Hello World 实例使用WebDriverManager自动下载驱动Selenium IDE录制、回放、导出Java源码 当用 Selenium 打开浏览器后,我们就可以通过 Selenium 对浏览器做各种操作,就像我们日常用鼠标和键盘操作浏览器一…...

Marlin固件稳定性优化实战指南:从基础配置到高级调校的完整解决方案
Marlin固件稳定性优化实战指南:从基础配置到高级调校的完整解决方案 【免费下载链接】Marlin Marlin is a firmware for RepRap 3D printers optimized for both 8 and 32 bit microcontrollers. Marlin supports all common platforms. Many commercial 3D printer…...

MiGPT终极教程:如何让小爱音箱秒变你的专属AI语音助手
MiGPT终极教程:如何让小爱音箱秒变你的专属AI语音助手 【免费下载链接】mi-gpt 🏠 将小爱音箱接入 ChatGPT 和豆包,改造成你的专属语音助手。 项目地址: https://gitcode.com/GitHub_Trending/mi/mi-gpt 还在为小爱音箱的"人工智…...

机器学习优化多浴模型参数结合HEOM计算分子红外光谱
1. 项目概述:当机器学习遇见分子光谱模拟在分子光谱模拟这个领域里,我们这些做计算化学和理论光谱的人,常年都在和一堆复杂的方程和庞大的计算量作斗争。核心目标很明确:我们想从原子和分子的微观运动出发,精准地预测出…...

告别内存泄漏!Cocos Creator 2.4+ AssetManager资源释放的完整避坑指南
Cocos Creator 2.4 AssetManager资源释放的完整避坑指南在游戏开发中,资源管理一直是影响性能和稳定性的关键因素。随着Cocos Creator 2.4版本推出全新的AssetManager系统,开发者获得了更强大的资源管理能力,但也面临着新的挑战。本文将深入探…...

工业控制系统安全:基于机器学习的数据融合异常检测实战
1. 项目概述与核心价值在工业控制系统(ICS)安全领域,我们面临着一个日益严峻的挑战:传统的“单点”防御策略越来越难以应对那些横跨网络层和物理过程层的复杂、隐蔽的攻击。想象一下,一个水处理厂的工程师,…...

终极游戏翻译解决方案:XUnity.AutoTranslator完整指南
终极游戏翻译解决方案:XUnity.AutoTranslator完整指南 【免费下载链接】XUnity.AutoTranslator 项目地址: https://gitcode.com/gh_mirrors/xu/XUnity.AutoTranslator 还在为外语游戏中的对话和界面烦恼吗?语言障碍是否让你错过了无数精彩的游戏…...

RTX51多任务环境下printf安全调用方案解析
1. RTX51多任务环境下printf的安全调用方案在RTX51实时操作系统中,多个任务同时调用标准库函数printf时会出现"多重调用警告"(Warning 15: MULTIPLE CALL TO SEGMENT)。这个看似简单的调试输出问题,实际上涉及RTOS任务调度、函数重入、内存管理…...

UE4.27 + PICO 3 避坑实录:从Android环境配置到VR插件集成的完整流程
UE4.27 PICO 3 开发全流程:从环境搭建到VR部署的深度避坑指南第一次将UE4项目部署到PICO 3的经历,就像在迷宫里摸索——每个转角都可能遇到意想不到的陷阱。作为过来人,我整理了这份涵盖环境配置、SDK集成、插件调试全流程的实战手册&#x…...

Unity局域网画面同步方案:FMETP STREAM低延迟多终端投射实战
1. 这不是“又一个网络同步教程”,而是解决真实产线卡点的局域网画面投射方案我第一次在客户现场看到这个需求时,是在一家做工业AR巡检系统的公司。他们刚部署完一批HoloLens 2和iPad,准备给产线工人做实时设备状态叠加显示——但问题来了&am…...

中介核对对账
...