甲方安全建设之日志采集实操干货
前言
没有永远的安全,如何在被攻击的情况下,快速响应和快速溯源分析攻击动作是个重要的话题。想要分析攻击者做了什么、怎么攻击进来的、还攻击了谁,那么日志是必不可少的一项,因此我们需要尽可能采集多的日志来进行分析攻击者的动作,甚至在攻击者刚落脚的时候就阻断攻击者。
安装Elastic+Kibana
Docker安装
这边根据官方文档:https://www.elastic.co/guide/en/elasticsearch/reference/current/docker.html 使用Docker安装了Elastic和Kibana
# 安装es
docker network create elasticdocker pull docker.elastic.co/elasticsearch/elasticsearch:8.12.1docker run --name es01 --net elastic -p 9200:9200 -it -m 1GB docker.elastic.co/elasticsearch/elasticsearch:8.12.1# 记录es的密码和注册kibana所需要的token# 测试es是否正确运行
export ELASTIC_PASSWORD="es_your_password"docker cp es01:/usr/share/elasticsearch/config/certs/http_ca.crt .curl --cacert http_ca.crt -u elastic:$ELASTIC_PASSWORD https://localhost:9200# 安装kibana
docker pull docker.elastic.co/kibana/kibana:8.12.1docker run --name kib01 --net elastic -p 5601:5601 docker.elastic.co/kibana/kibana:8.12.1会给出kibana的注册地址,访问填入上述记录的token即可。
不知道是机器性能问题还是Docker安装的问题,es容器经常会挂掉。
RPM安装
根据https://www.elastic.co/guide/en/elasticsearch/reference/current/rpm.html、https://www.elastic.co/guide/en/kibana/current/rpm.html官方文档,可以yum install安装。因为公司访问镜像源被封,因此使用上述文档中下载rpm安装:
# 安装es
wget https://artifacts.elastic.co/downloads/elasticsearch/elasticsearch-8.12.1-x86_64.rpm
wget https://artifacts.elastic.co/downloads/elasticsearch/elasticsearch-8.12.1-x86_64.rpm.sha512
shasum -a 512 -c elasticsearch-8.12.1-x86_64.rpm.sha512
sudo rpm --install elasticsearch-8.12.1-x86_64.rpm安装kibana
wget https://artifacts.elastic.co/downloads/kibana/kibana-8.12.1-x86_64.rpm
wget https://artifacts.elastic.co/downloads/kibana/kibana-8.12.1-x86_64.rpm.sha512
shasum -a 512 -c kibana-8.12.1-x86_64.rpm.sha512
sudo rpm --install kibana-8.12.1-x86_64.rpm
依然在安装es的rpm时,会吐出es/kibana的密码:
The generated password for the elastic built-in superuser is : Fq*S7jxCjFfPu6nN8NG8
es服务可能启动不了,但是安装时会给出启动命令:
sudo systemctl daemon-reloadsudo systemctl enable elasticsearch.service
测试es启动是否正常:
export ELASTIC_PASSWORD="Fq*S7jxCjFfPu6nN8NG8"
curl --cacert /etc/elasticsearch/certs/http_ca.crt -u elastic:$ELASTIC_PASSWORD https://localhost:9200
记得改下配置文件,使其监听在0.0.0.0上面:
# /etc/elasticsearch/elasticsearch.yml# Allow HTTP API connections from anywhere
# Connections are encrypted and require user authentication
http.host: 0.0.0.0# Allow other nodes to join the cluster from anywhere
# Connections are encrypted and mutually authenticated
transport.host: 0.0.0.0
kibana一样,记得改下配置文件,使其监听在0.0.0.0上面:
# /etc/kibana/kibana.yml
server.host: "0.0.0.0"
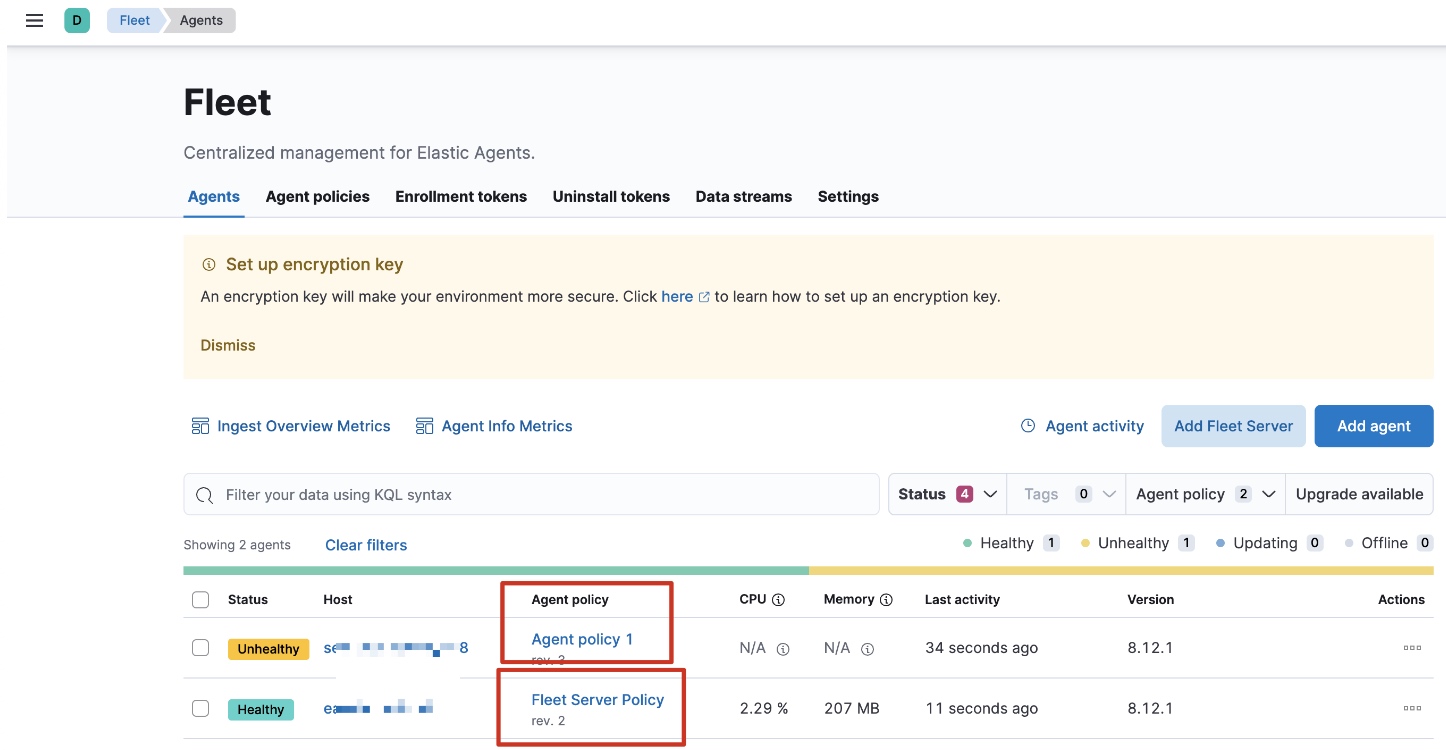
安装Fleet和Elastic Agent
在Kibana上,Management->Fleet->Add Fleet Server,先安装Fleet Server,URL填写https协议,端口可以填默认的8220。
装好Fleet Server后再装Elastic Agent,Fleet Server也是一个Agent,因此不能在同一台机器上同时装Fleet Server和Elastic Agent。
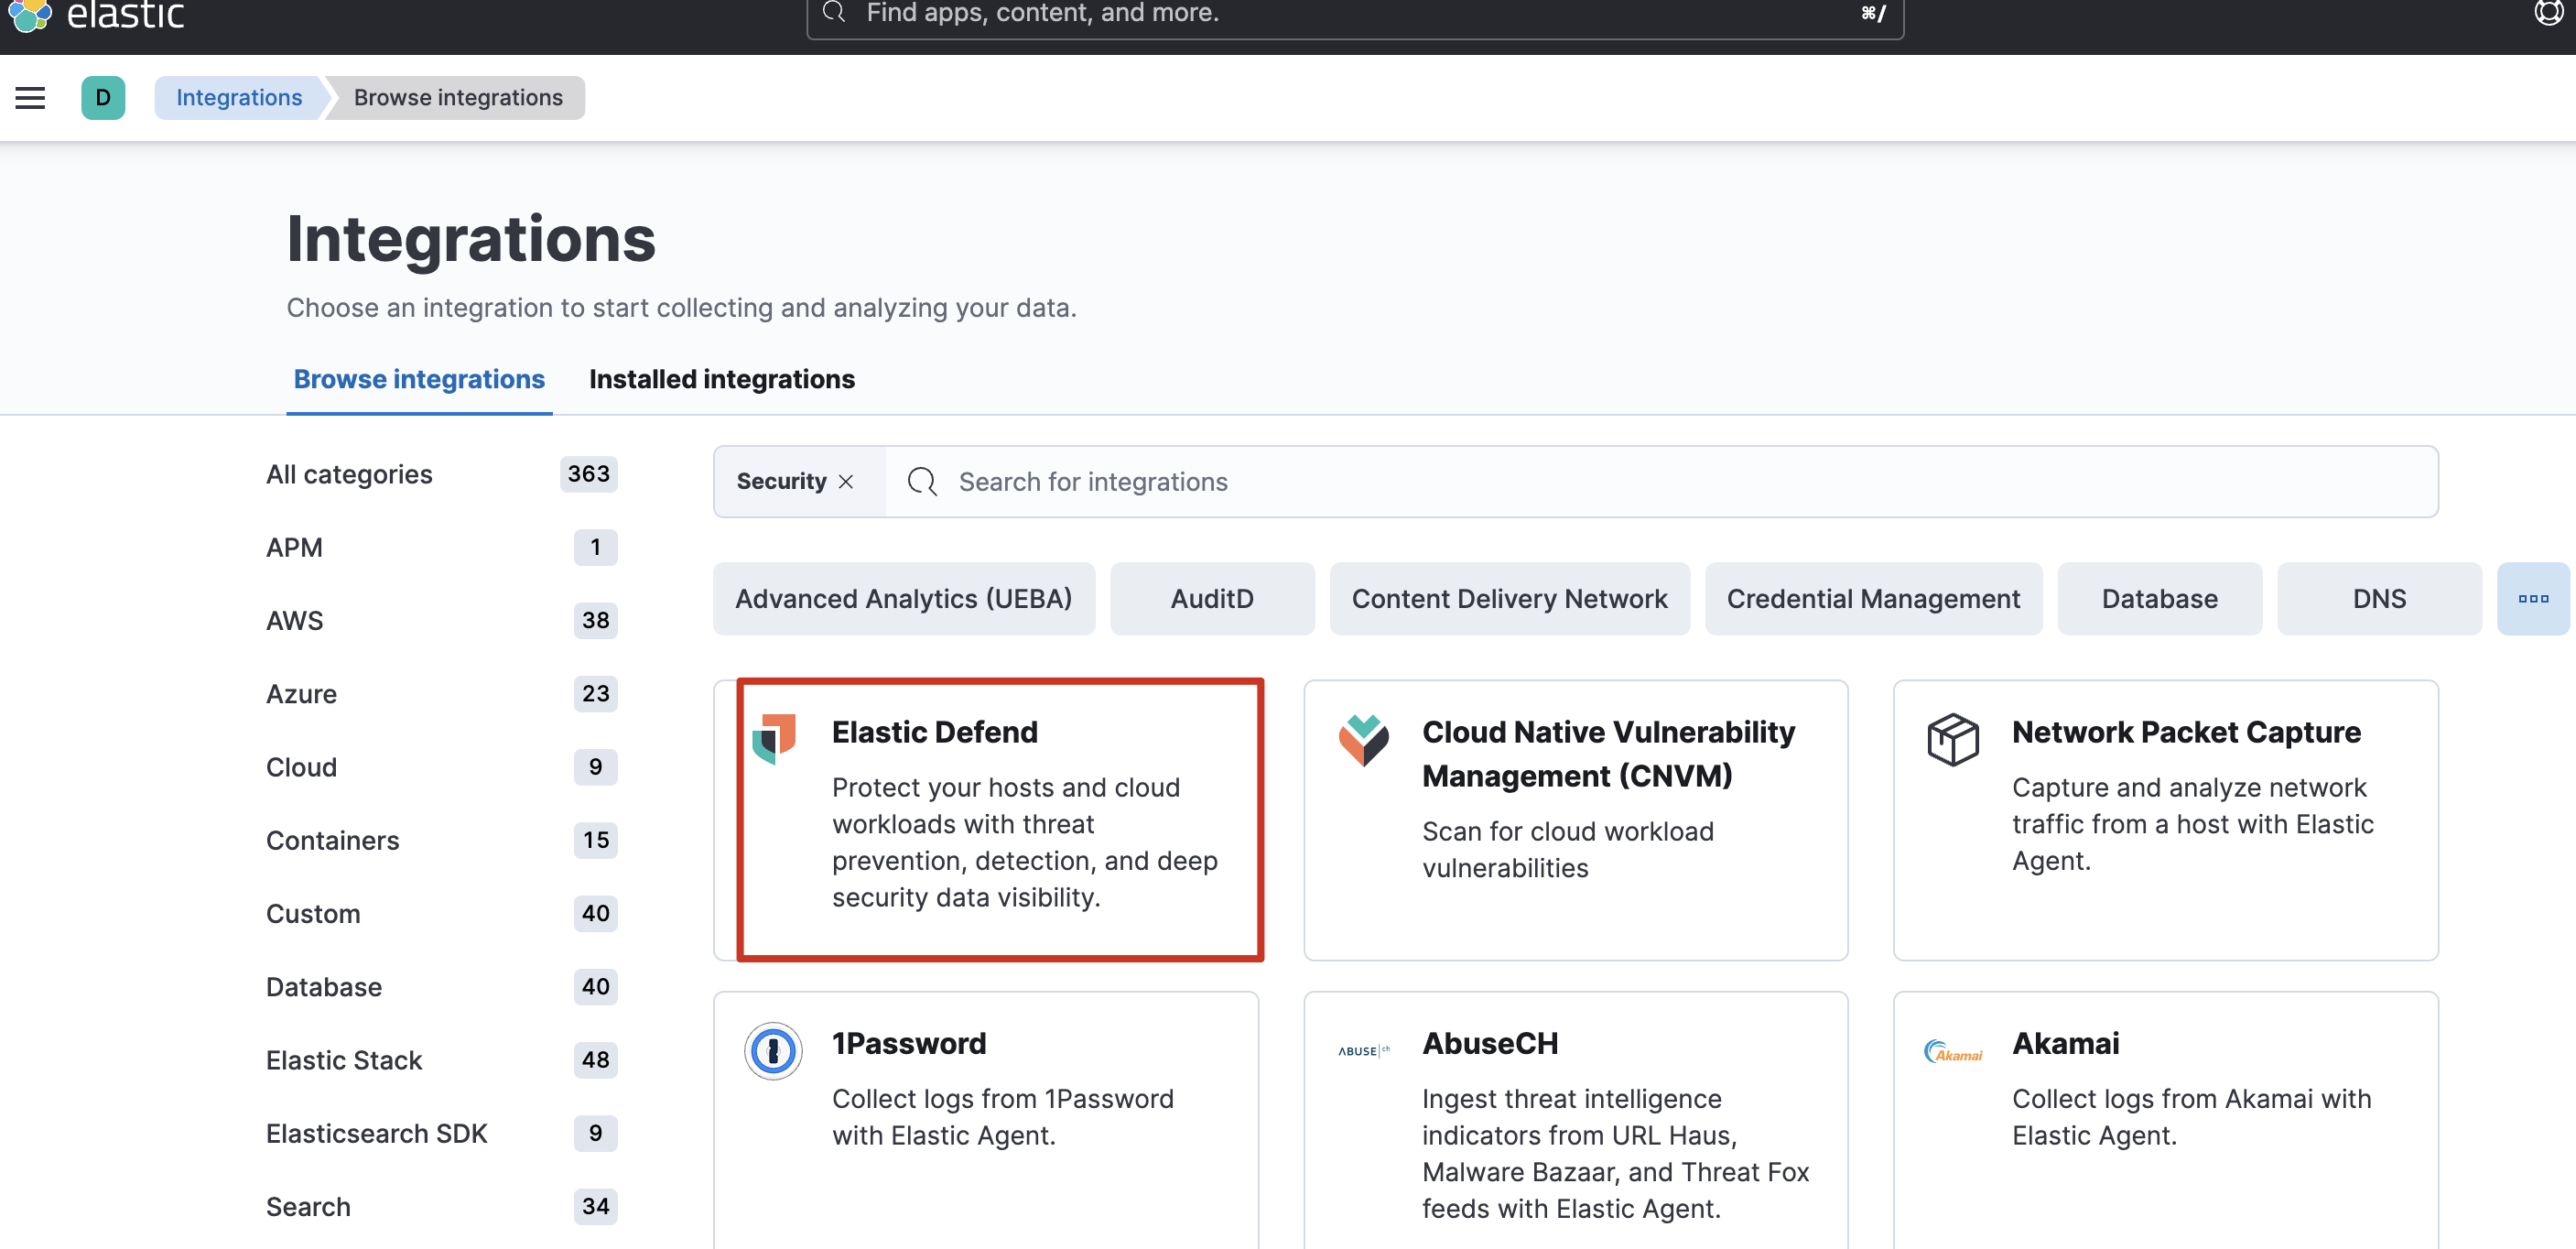
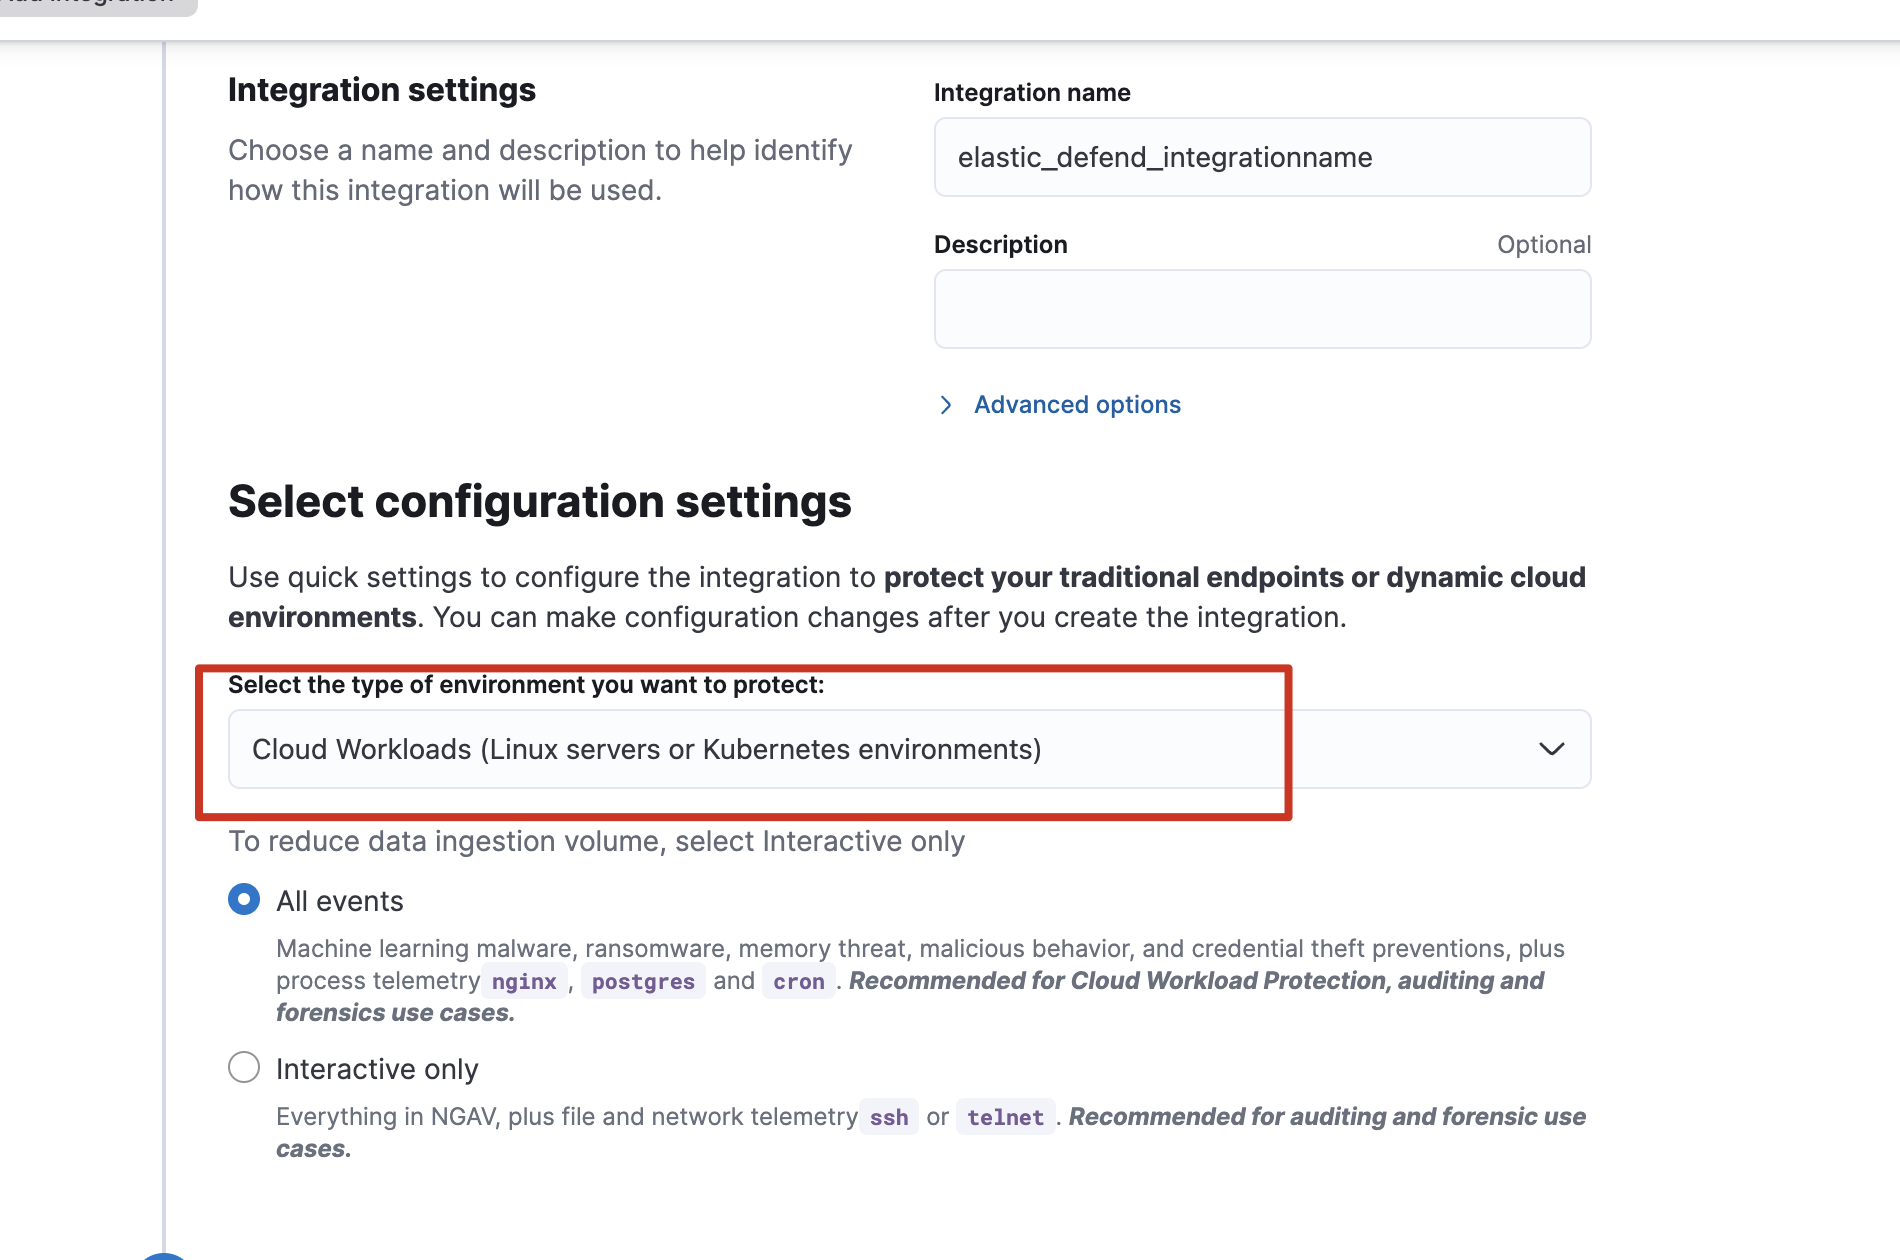
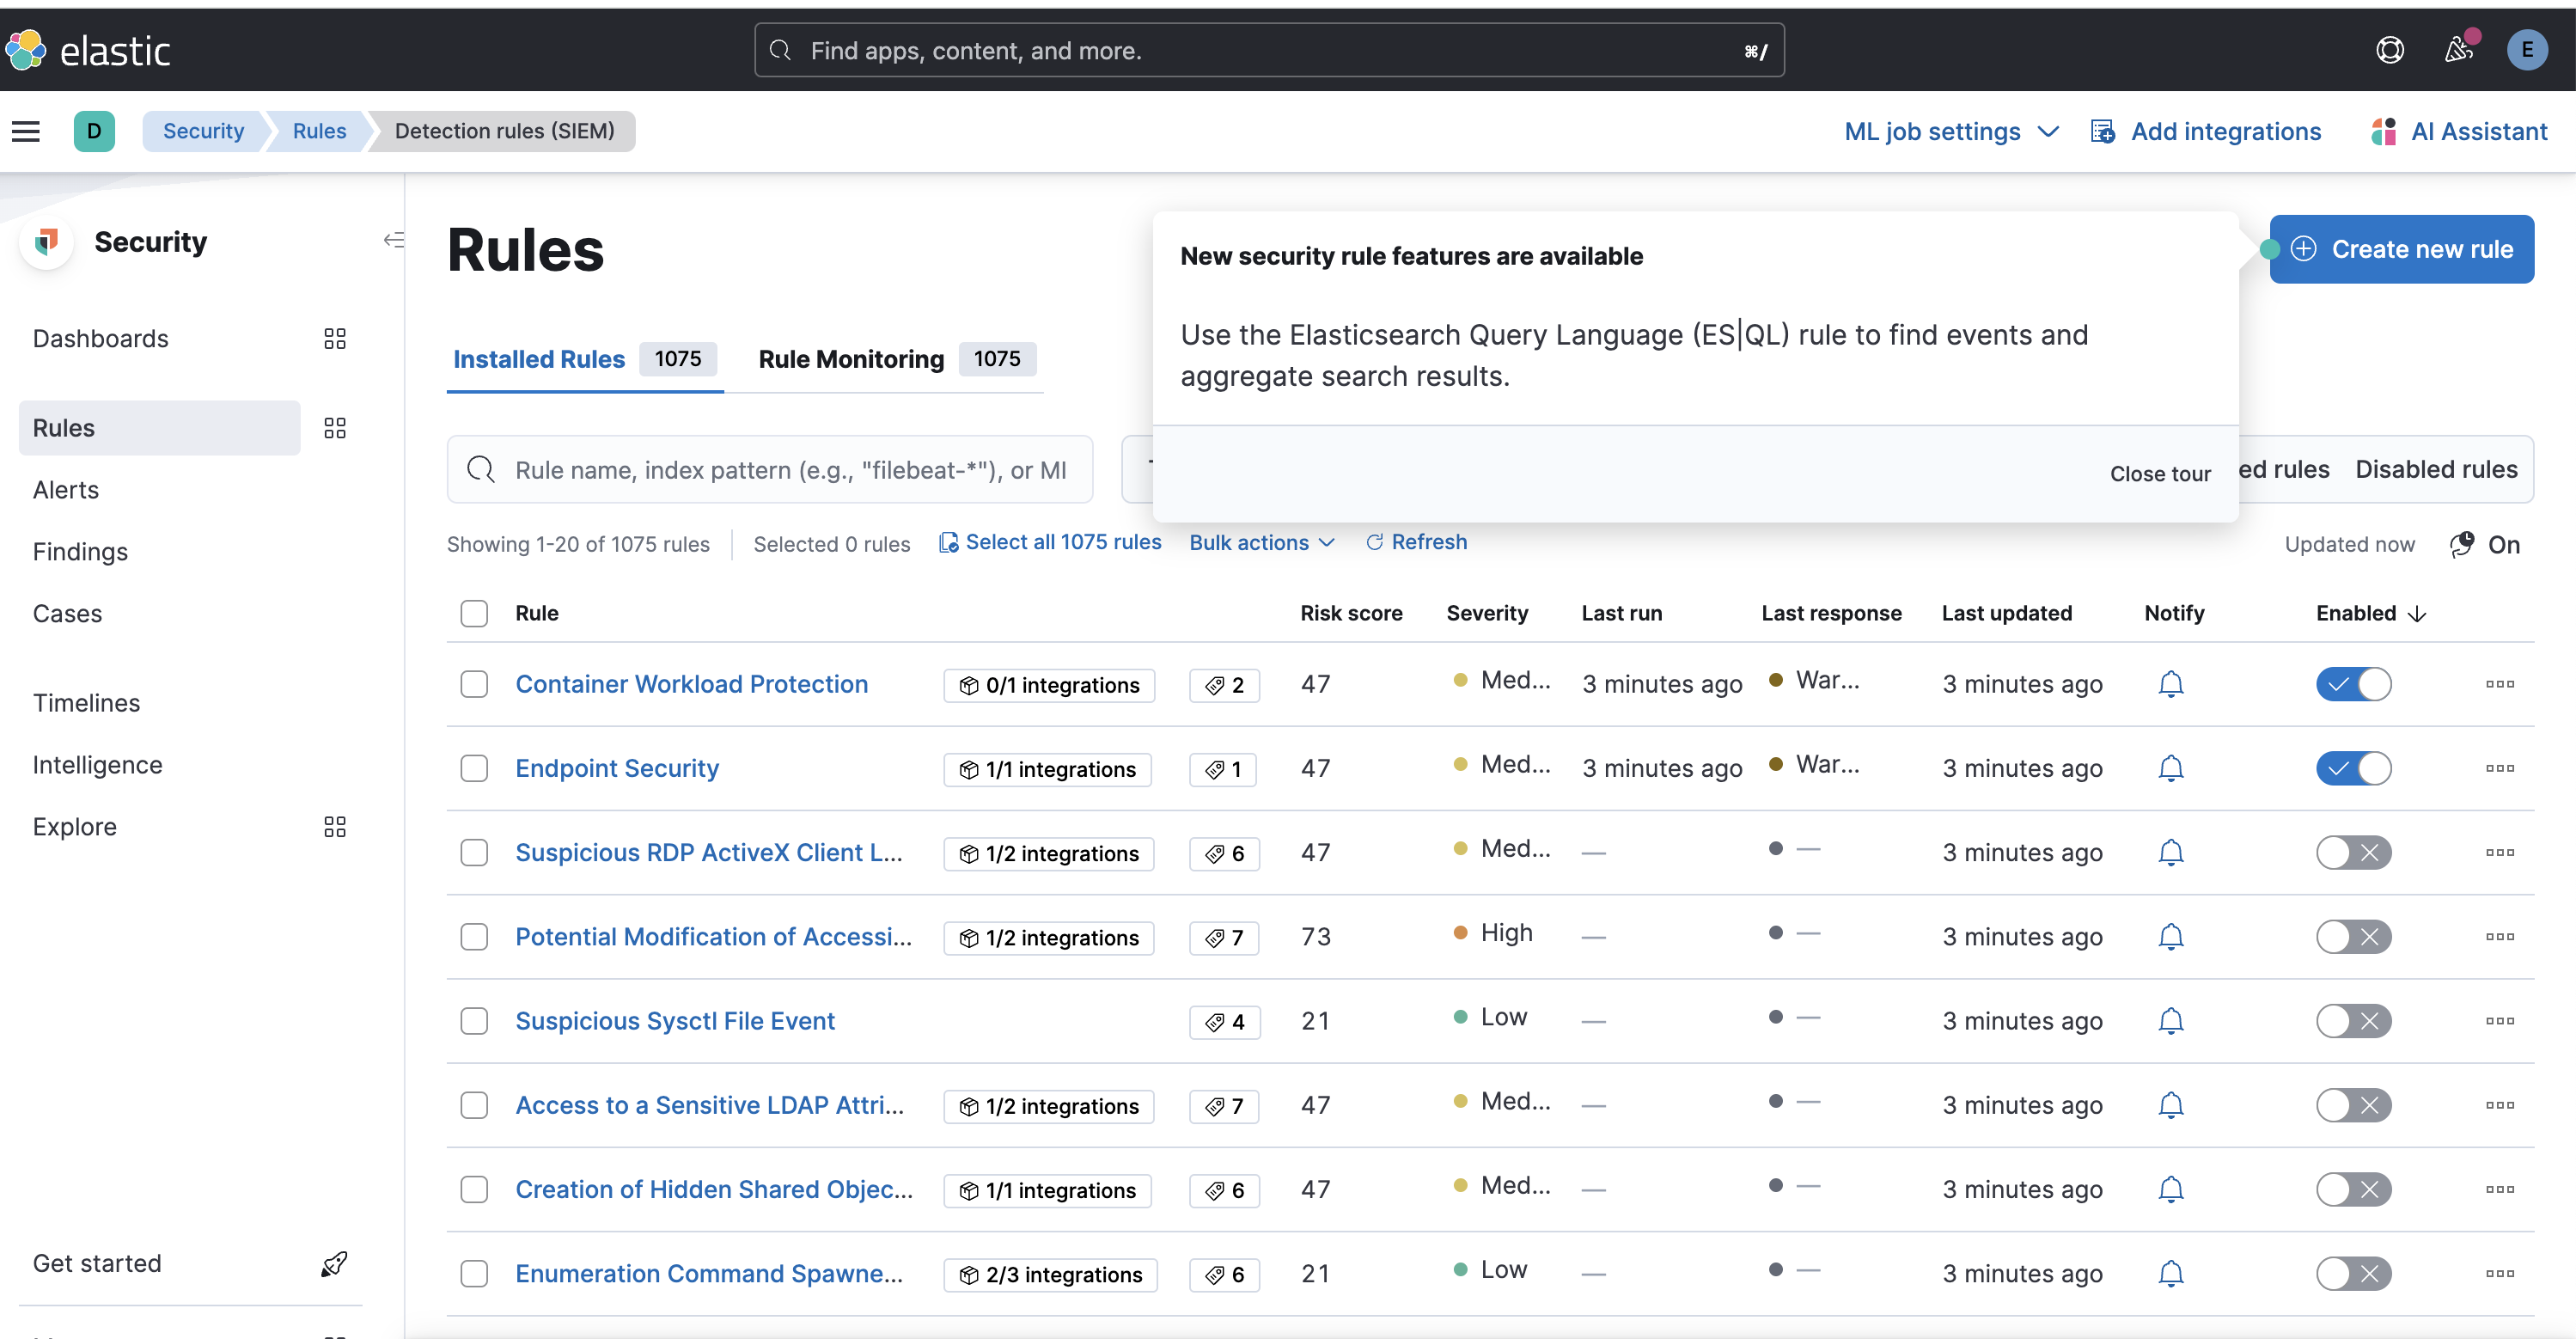
为了使其Elastic Agent附带Security能力,可以添加各式各样的integrations集成,如到Security->Manage->Get started->Add security integrations安装安全集成:
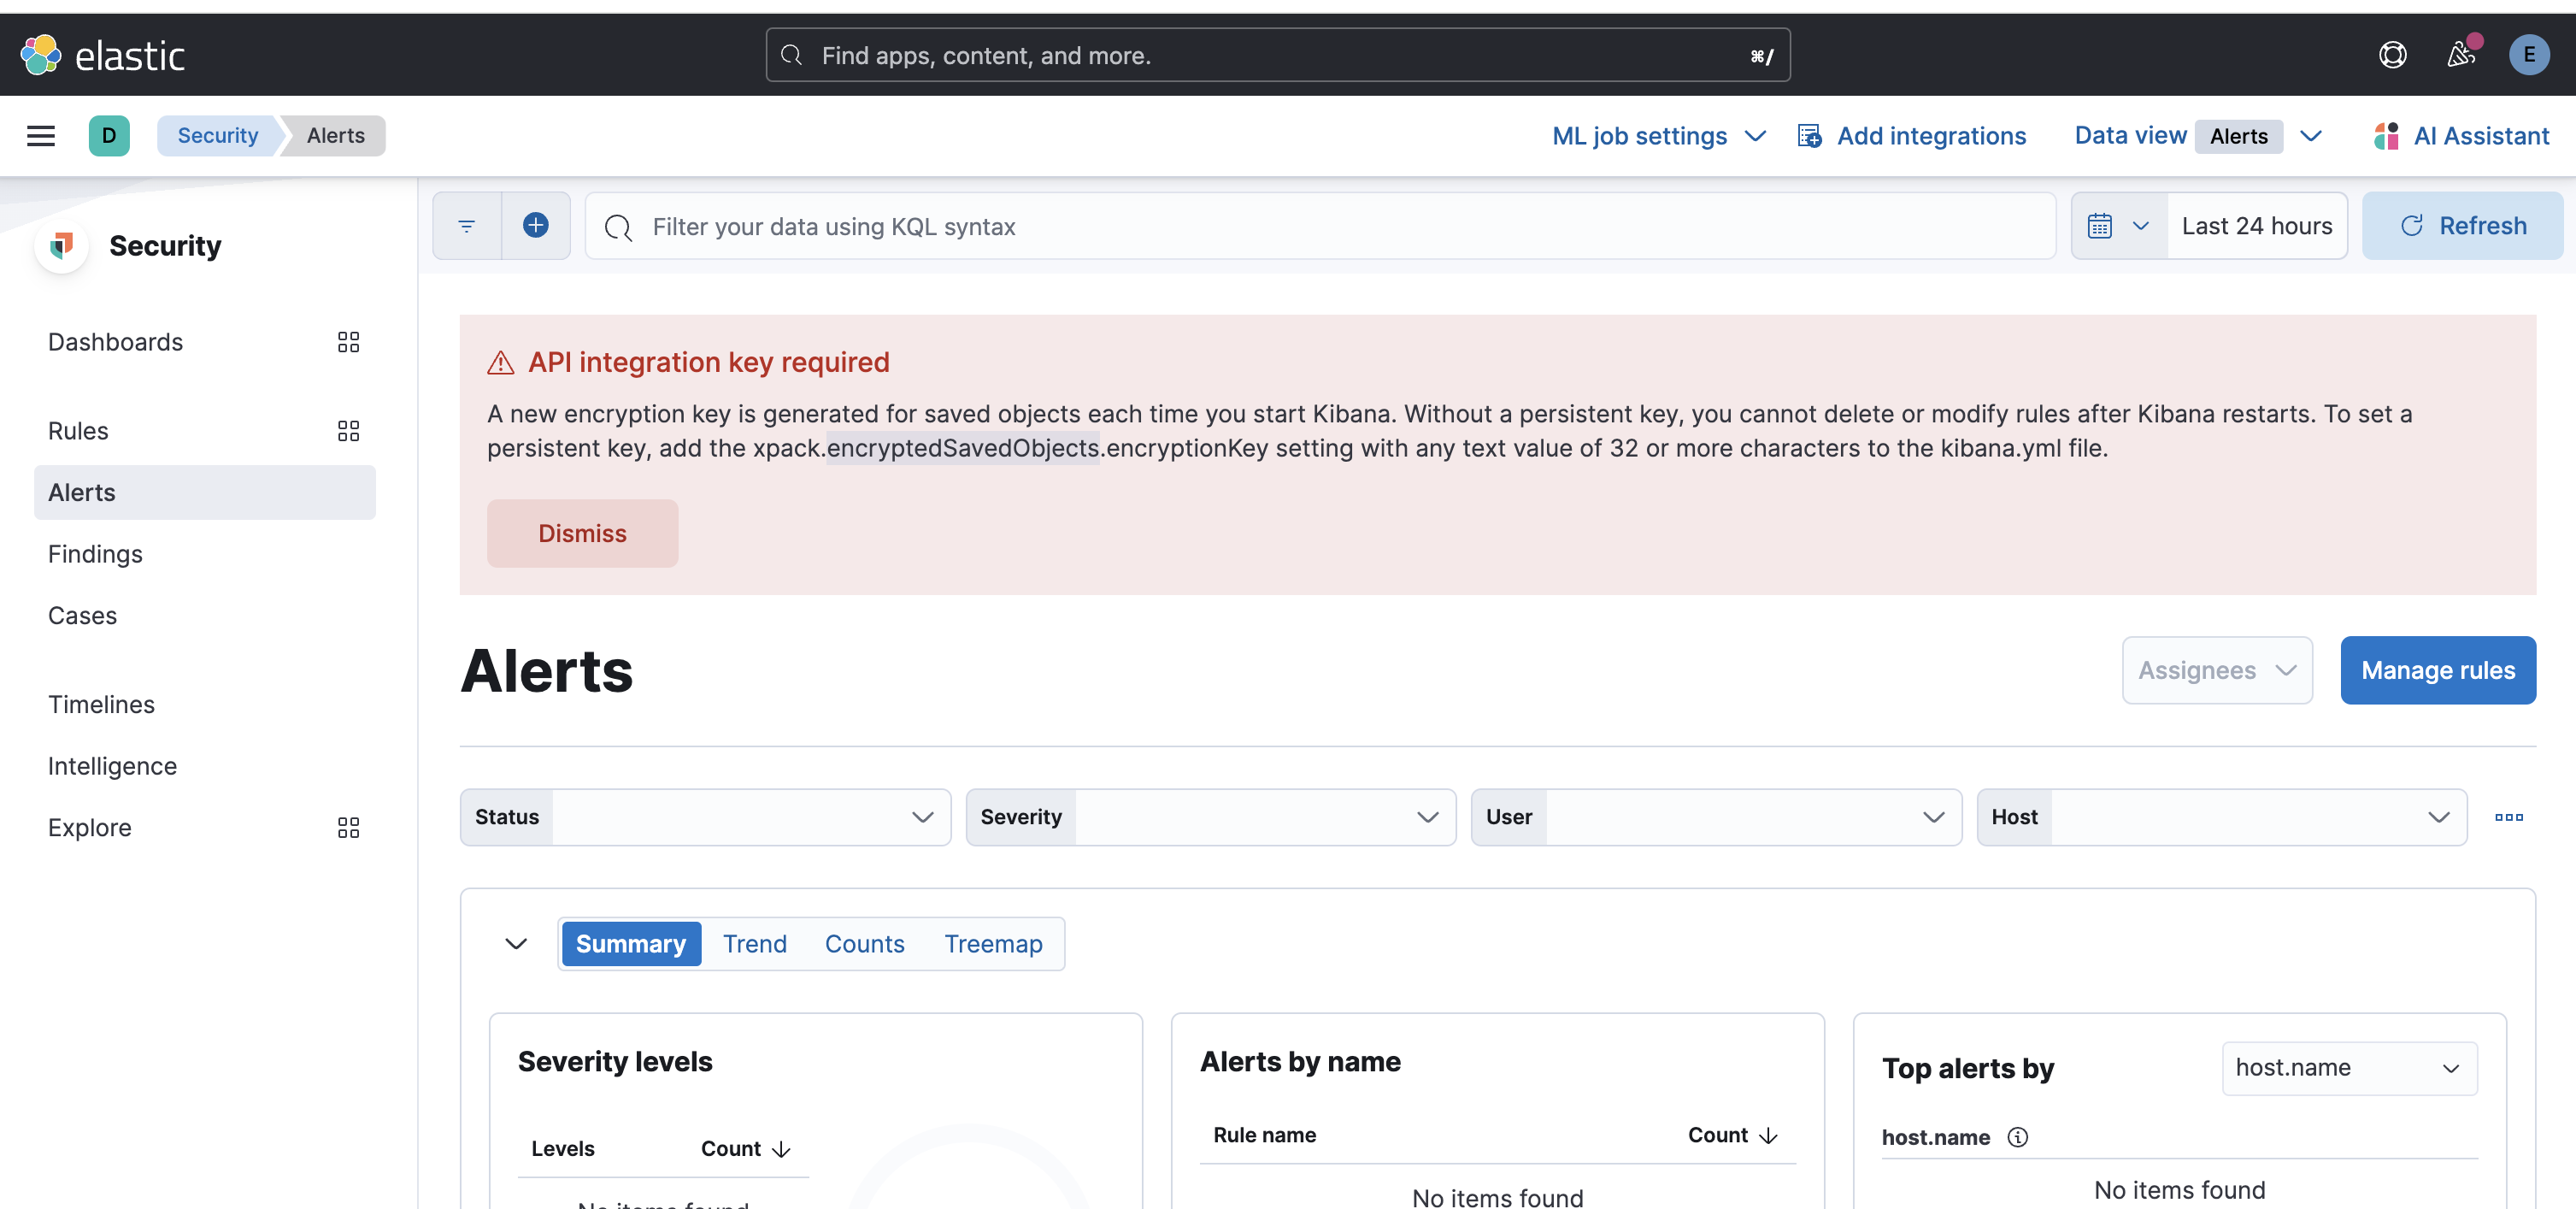
测试告警
注意,如果有如下错误需解决,否则会无法查阅规则:
帮助网安学习,全套资料S信免费领取:
① 网安学习成长路径思维导图
② 60+网安经典常用工具包
③ 100+SRC分析报告
④ 150+网安攻防实战技术电子书
⑤ 最权威CISSP 认证考试指南+题库
⑥ 超1800页CTF实战技巧手册
⑦ 最新网安大厂面试题合集(含答案)
⑧ APP客户端安全检测指南(安卓+IOS)
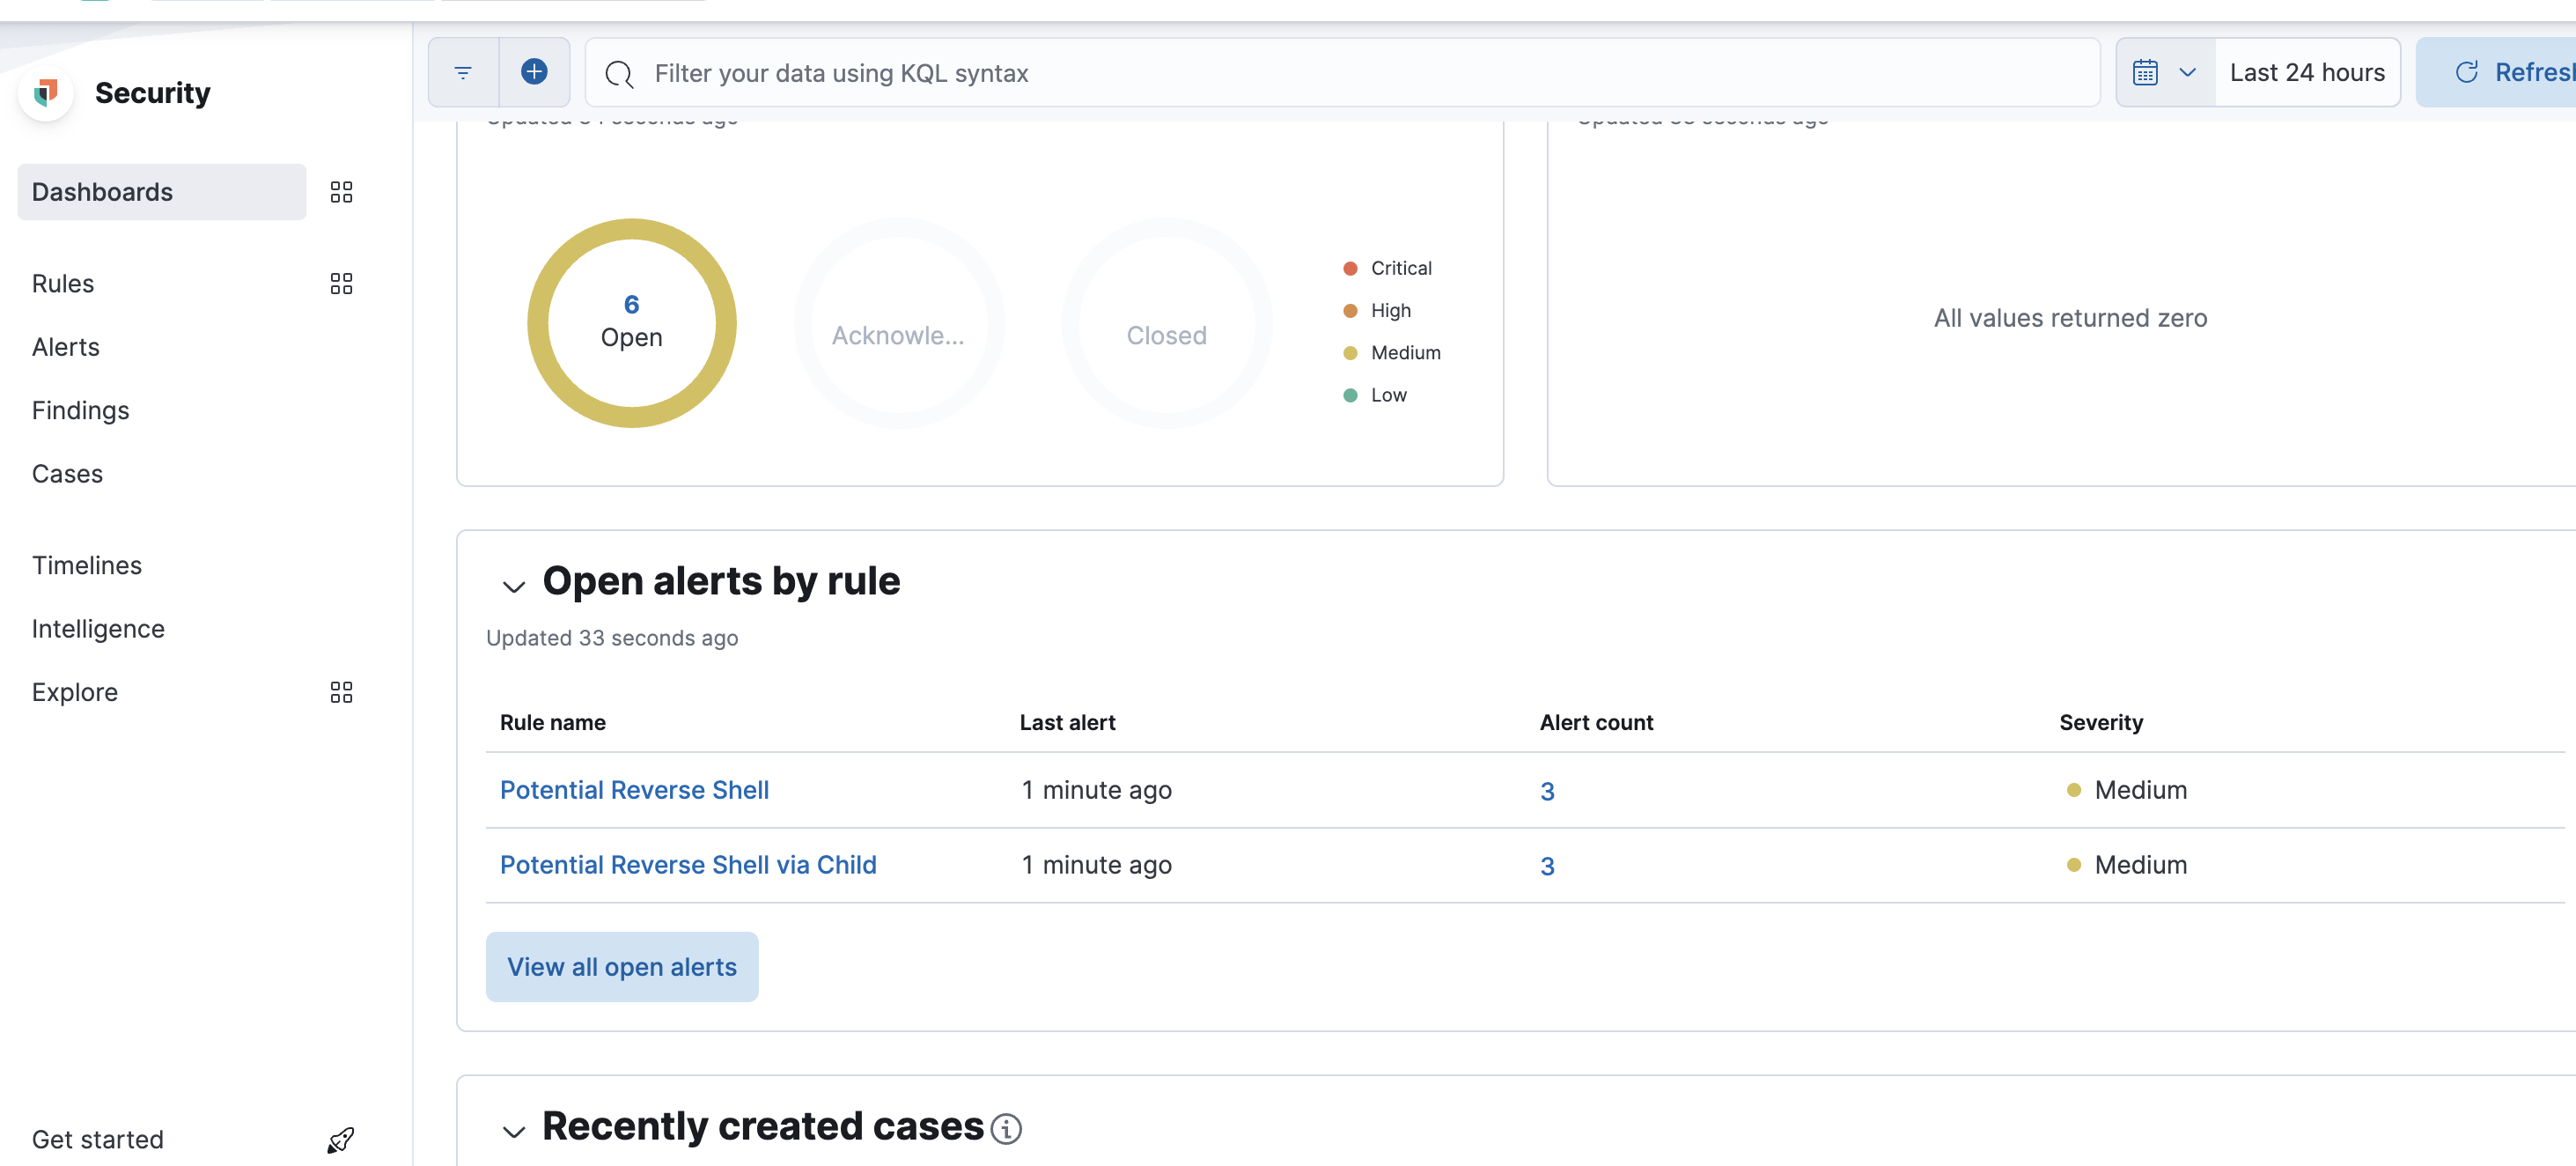
有些规则没开,记得开下,比如我把reverse shell规则打开后:
Security->Dashboards->Detection & Response可以看到一些概览:
记录Windows事件管理器日志
安装
Windows事件管理器日志不是单纯的文本,因此需要借助一些工具来帮助我们完成采集的目的。这里使用winlogbeat(https://www.elastic.co/cn/beats/winlogbeat)完成。
官方提供了很详细的安装文档(https://www.elastic.co/guide/en/beats/winlogbeat/current/winlogbeat-installation-configuration.html),核心就是配置想要记录的日志类型和对外传输的方案,这里我使用的方案为:
- 记录的日志类型,我没改,默认就是Security、Application,甚至还有Sysmon
- 对外传输,我使用了传输到elastic
配置好winlogbeat.yml后可以进行测试配置文件对不对:
.\winlogbeat.exe test config -c .\winlogbeat.yml -e
下面为我的配置文件信息:
###################### Winlogbeat Configuration Example ######################### This file is an example configuration file highlighting only the most common
# options. The winlogbeat.reference.yml file from the same directory contains
# all the supported options with more comments. You can use it as a reference.
#
# You can find the full configuration reference here:
# https://www.elastic.co/guide/en/beats/winlogbeat/index.html# ======================== Winlogbeat specific options =========================# event_logs specifies a list of event logs to monitor as well as any
# accompanying options. The YAML data type of event_logs is a list of
# dictionaries.
#
# The supported keys are name, id, xml_query, tags, fields, fields_under_root,
# forwarded, ignore_older, level, event_id, provider, and include_xml.
# The xml_query key requires an id and must not be used with the name,
# ignore_older, level, event_id, or provider keys. Please visit the
# documentation for the complete details of each option.
# https://go.es.io/WinlogbeatConfigwinlogbeat.event_logs:- name: Applicationignore_older: 72h- name: System- name: Security- name: Microsoft-Windows-Sysmon/Operational- name: Windows PowerShellevent_id: 400, 403, 600, 800- name: Microsoft-Windows-PowerShell/Operationalevent_id: 4103, 4104, 4105, 4106- name: ForwardedEventstags: [forwarded]# ====================== Elasticsearch template settings =======================setup.template.settings:index.number_of_shards: 1#index.codec: best_compression#_source.enabled: false# ================================== General ===================================# The name of the shipper that publishes the network data. It can be used to group
# all the transactions sent by a single shipper in the web interface.
#name:# The tags of the shipper are included in their field with each
# transaction published.
#tags: ["service-X", "web-tier"]# Optional fields that you can specify to add additional information to the
# output.
#fields:
#  env: staging# ================================= Dashboards =================================
# These settings control loading the sample dashboards to the Kibana index. Loading
# the dashboards is disabled by default and can be enabled either by setting the
# options here or by using the `setup` command.
#setup.dashboards.enabled: false# The URL from where to download the dashboard archive. By default, this URL
# has a value that is computed based on the Beat name and version. For released
# versions, this URL points to the dashboard archive on the artifacts.elastic.co
# website.
#setup.dashboards.url:# =================================== Kibana ===================================# Starting with Beats version 6.0.0, the dashboards are loaded via the Kibana API.
# This requires a Kibana endpoint configuration.
setup.kibana:# Kibana Host# Scheme and port can be left out and will be set to the default (http and 5601)# In case you specify and additional path, the scheme is required: http://localhost:5601/path# IPv6 addresses should always be defined as: https://[2001:db8::1]:5601#host: "localhost:5601"# Kibana Space ID# ID of the Kibana Space into which the dashboards should be loaded. By default,# the Default Space will be used.#space.id:# =============================== Elastic Cloud ================================# These settings simplify using Winlogbeat with the Elastic Cloud (https://cloud.elastic.co/).# The cloud.id setting overwrites the `output.elasticsearch.hosts` and
# `setup.kibana.host` options.
# You can find the `cloud.id` in the Elastic Cloud web UI.
#cloud.id:# The cloud.auth setting overwrites the `output.elasticsearch.username` and
# `output.elasticsearch.password` settings. The format is `<user>:<pass>`.
#cloud.auth:# ================================== Outputs ===================================# Configure what output to use when sending the data collected by the beat.# ---------------------------- Elasticsearch Output ----------------------------
output.elasticsearch:# Array of hosts to connect to.hosts: ["your_ip:9200"]# Protocol - either `http` (default) or `https`.#protocol: "https"# Authentication credentials - either API key or username/password.#api_key: "id:api_key"username: "elastic"password: "passwords"# Pipeline to route events to security, sysmon, or powershell pipelines.pipeline: "winlogbeat-%{[agent.version]}-routing"# ------------------------------ Logstash Output -------------------------------
#output.logstash:# The Logstash hosts#hosts: ["localhost:5044"]# Optional SSL. By default is off.# List of root certificates for HTTPS server verifications#ssl.certificate_authorities: ["/etc/pki/root/ca.pem"]# Certificate for SSL client authentication#ssl.certificate: "/etc/pki/client/cert.pem"# Client Certificate Key#ssl.key: "/etc/pki/client/cert.key"# ================================= Processors =================================
processors:- add_host_metadata:when.not.contains.tags: forwarded- add_cloud_metadata: ~# ================================== Logging ===================================# Sets log level. The default log level is info.
# Available log levels are: error, warning, info, debug
#logging.level: debug# At debug level, you can selectively enable logging only for some components.
# To enable all selectors, use ["*"]. Examples of other selectors are "beat",
# "publisher", "service".
#logging.selectors: ["*"]# ============================= X-Pack Monitoring ==============================
# Winlogbeat can export internal metrics to a central Elasticsearch monitoring
# cluster.  This requires xpack monitoring to be enabled in Elasticsearch.  The
# reporting is disabled by default.# Set to true to enable the monitoring reporter.
#monitoring.enabled: false# Sets the UUID of the Elasticsearch cluster under which monitoring data for this
# Winlogbeat instance will appear in the Stack Monitoring UI. If output.elasticsearch
# is enabled, the UUID is derived from the Elasticsearch cluster referenced by output.elasticsearch.
#monitoring.cluster_uuid:# Uncomment to send the metrics to Elasticsearch. Most settings from the
# Elasticsearch outputs are accepted here as well.
# Note that the settings should point to your Elasticsearch *monitoring* cluster.
# Any setting that is not set is automatically inherited from the Elasticsearch
# output configuration, so if you have the Elasticsearch output configured such
# that it is pointing to your Elasticsearch monitoring cluster, you can simply
# uncomment the following line.
#monitoring.elasticsearch:# ============================== Instrumentation ===============================# Instrumentation support for the winlogbeat.
#instrumentation:# Set to true to enable instrumentation of winlogbeat.#enabled: false# Environment in which winlogbeat is running on (eg: staging, production, etc.)#environment: ""# APM Server hosts to report instrumentation results to.#hosts:#  - http://localhost:8200# API Key for the APM Server(s).# If api_key is set then secret_token will be ignored.#api_key:# Secret token for the APM Server(s).#secret_token:# ================================= Migration ==================================# This allows to enable 6.7 migration aliases
#migration.6_to_7.enabled: true
数据检索
这时候,可能elastic上面搜不到数据,是因为winlogbeat使用了他自己的索引,默认为winlogbeat-version,笔者测试时,发现kibana上迟迟出现不了该索引,还以为数据传输没成功呢,因此通过如下手段进行排查,先获取es上面的索引信息:
http://your_ip:9200/_cat/indices?v
发现有类似winlogbeat的索引信息:
yellow open .ds-winlogbeat-8.12.0-2024.02.03-000001 UpWhWCpdR-2WgMVe_kiH9A 1 1 192705 0 131.1mb 131.1mb后面尝试在kibana上创建一个新的索引即可,v7.17.12版本的kibana创建索引的过程如下:
discover->选项->View Discover settings
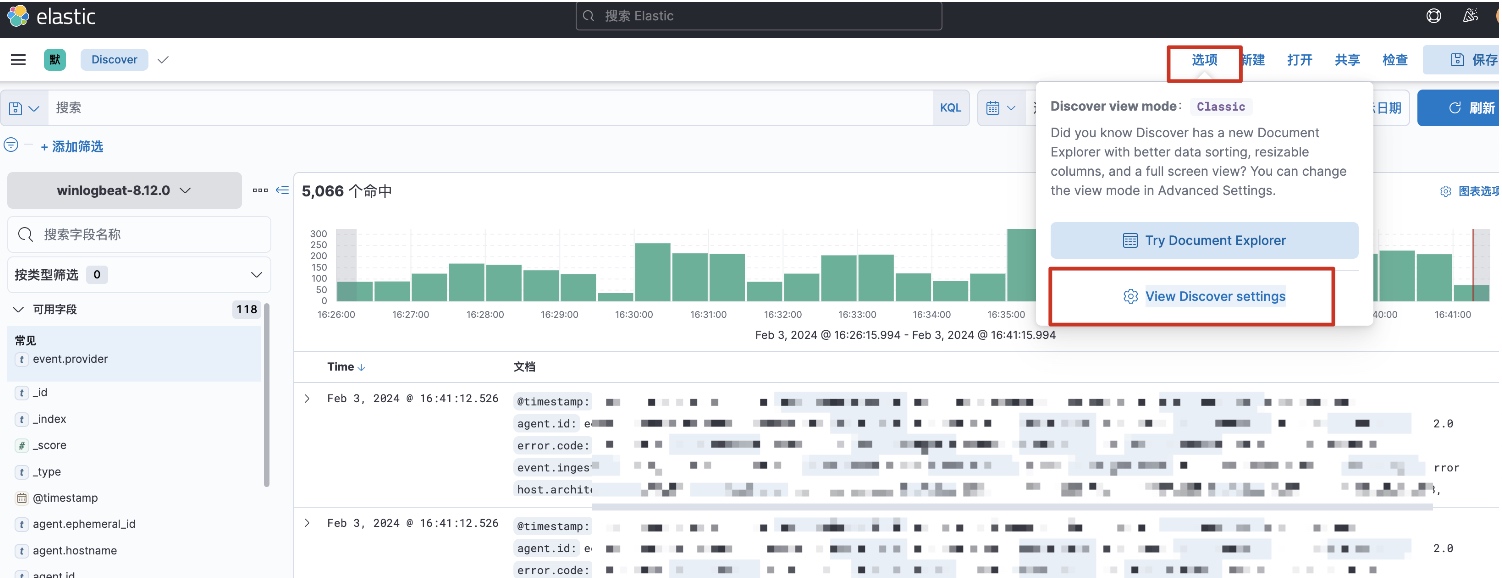
找到“索引模式”创建一个新的索引即可:
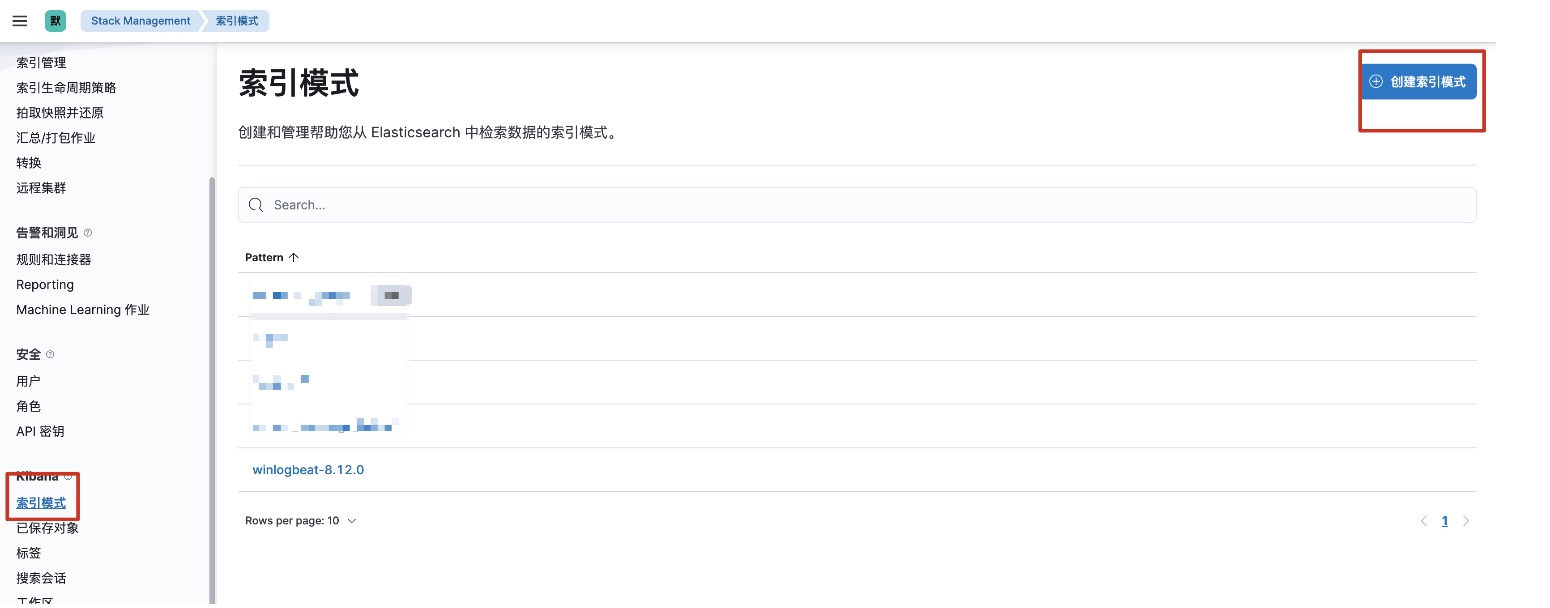
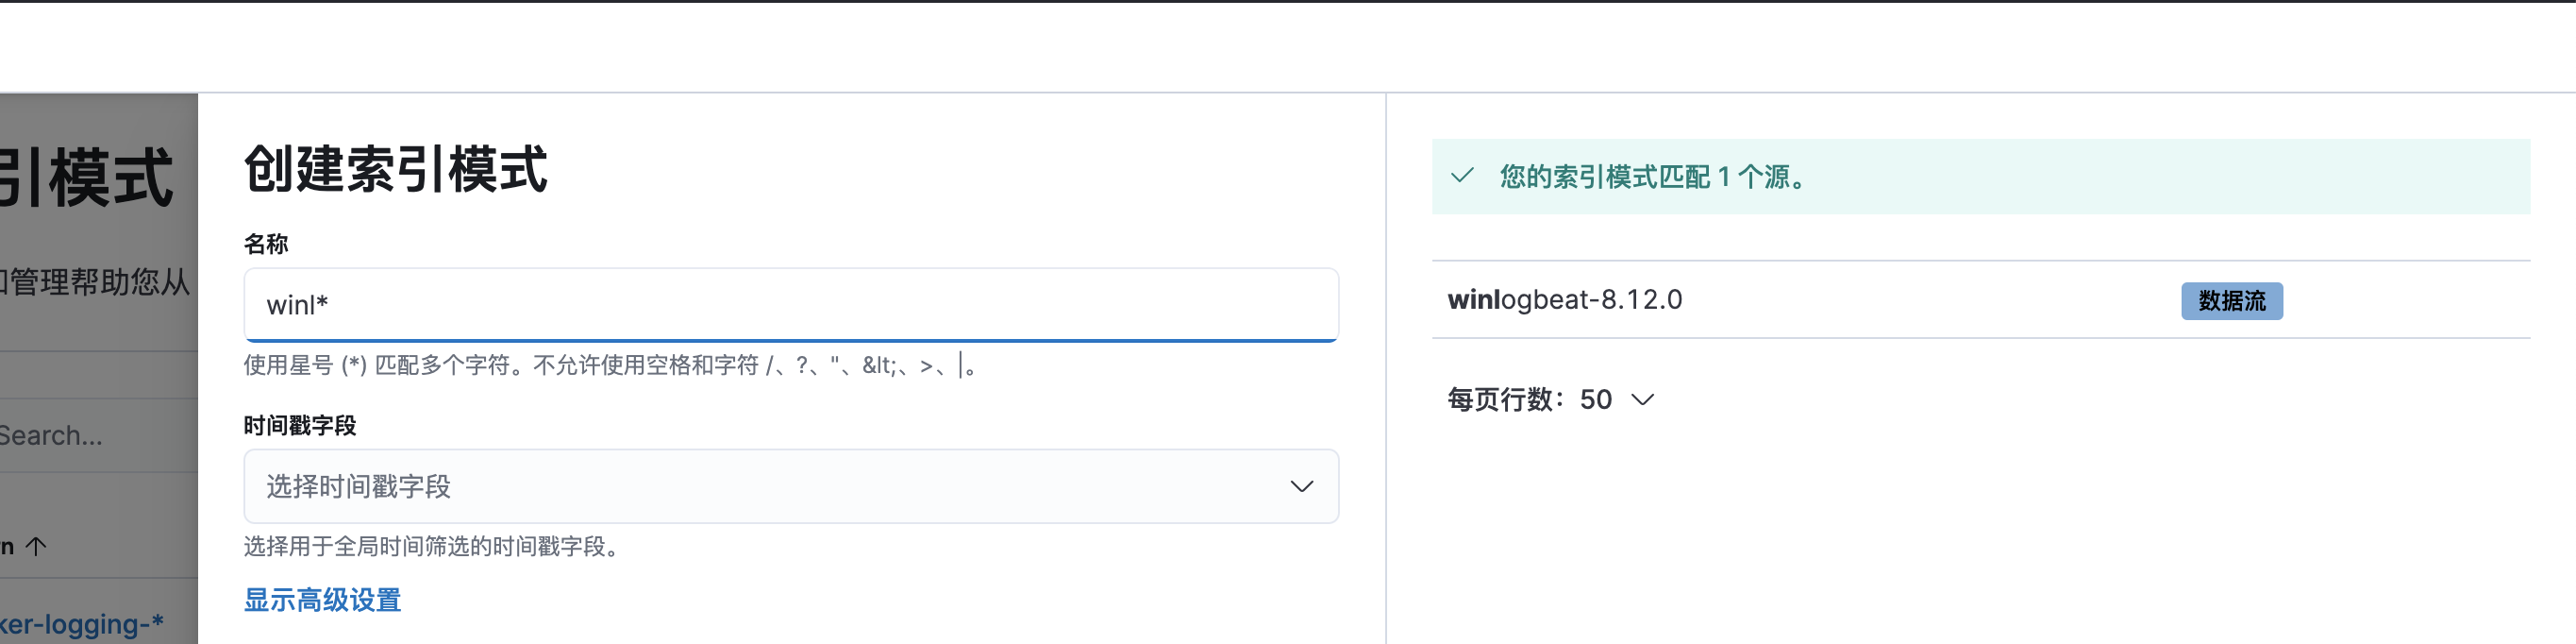
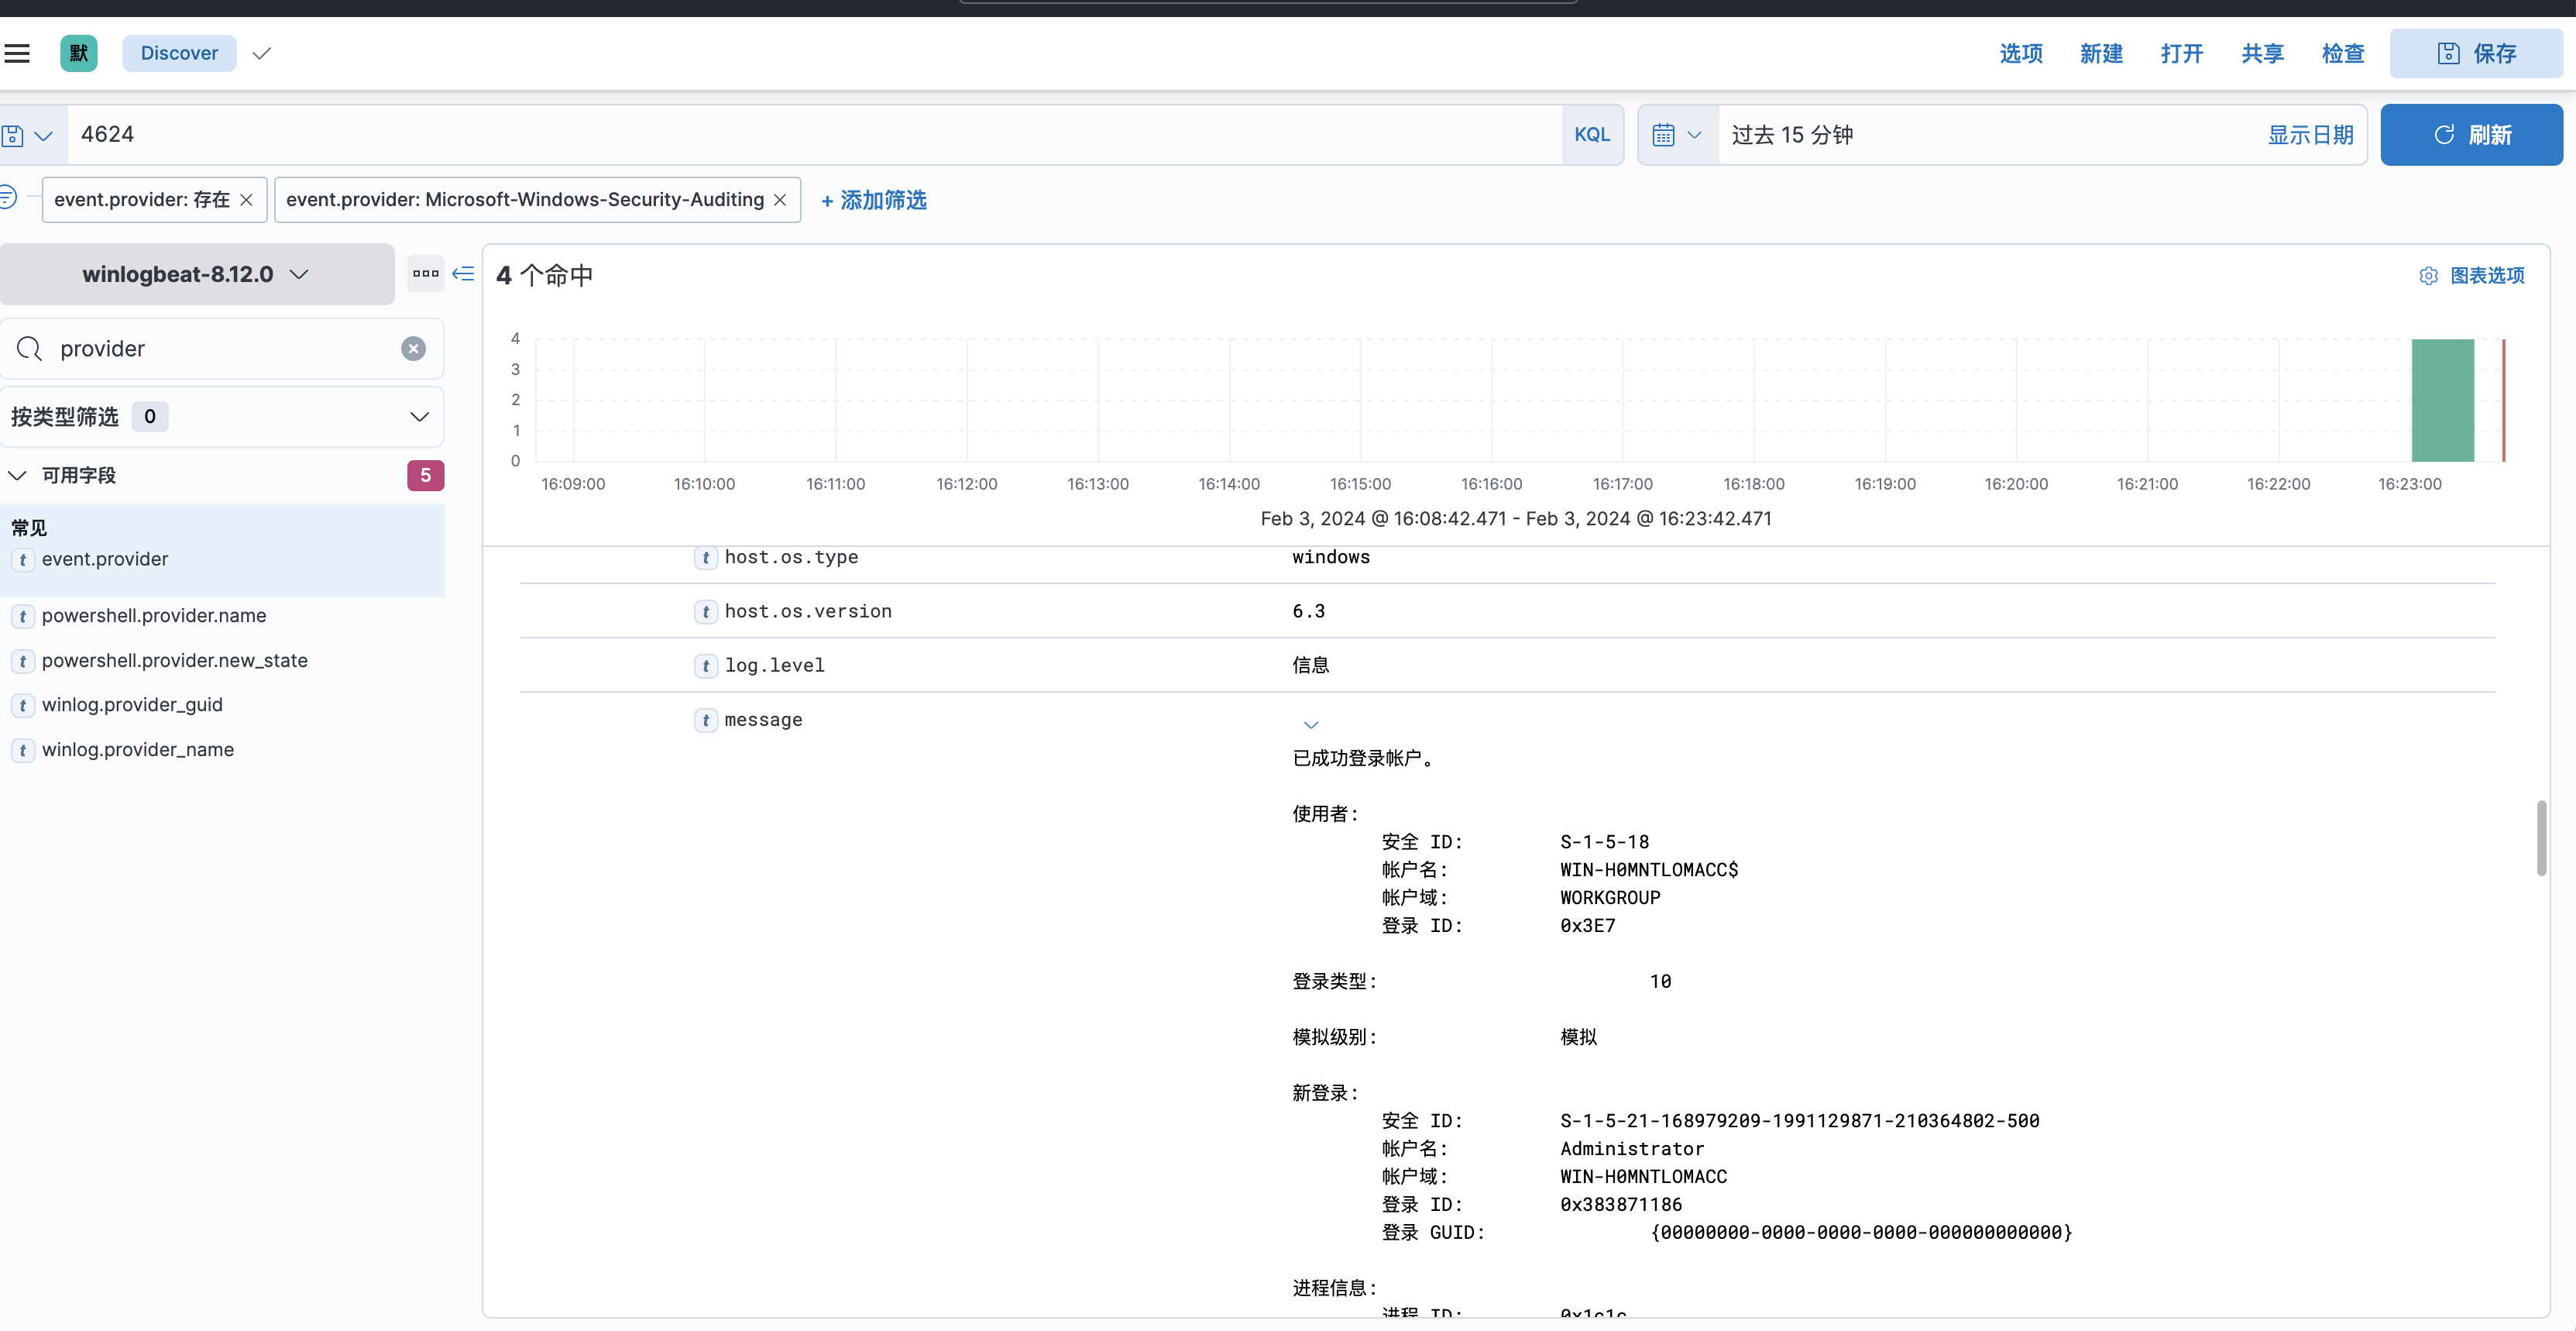
这时候就可以检索事件管理器日志了:
相关文章:
甲方安全建设之日志采集实操干货
前言 没有永远的安全,如何在被攻击的情况下,快速响应和快速溯源分析攻击动作是个重要的话题。想要分析攻击者做了什么、怎么攻击进来的、还攻击了谁,那么日志是必不可少的一项,因此我们需要尽可能采集多的日志来进行分析攻击者的…...
dm8 开启归档模式
dm8 开启归档模式 1 命令行 [dmdbatest1 dm8]$ disql sysdba/Dameng123localhost:5237服务器[localhost:5237]:处于普通打开状态 登录使用时间 : 3.198(ms) disql V8 SQL> select name,status$,arch_mode from v$database;行号 NAME STATUS$ ARCH_MODE ----------…...

“AI复活”背后的数字永生:被期待成为下一个电商,培育市场认知和用户心智还需时间
“AI复活”背后的数字永生:被期待成为下一个电商,培育市场认知和用户心智还需时间© 由 九派新闻 提供 数字永生,还是电子宠物?过去一个月,因包小柏用AI技术让爱女在数字世界“复活”一事,《流浪地球2…...
基于单片机钢琴电子节拍器系统设计
**单片机设计介绍,基于单片机钢琴电子节拍器系统设计 文章目录 一 概要二、功能设计三、 软件设计原理图 五、 程序六、 文章目录 一 概要 基于单片机钢琴电子节拍器系统设计是一个综合性的项目,它结合了单片机编程、音频处理、用户界面设计等多个领域的…...

我的创作纪念日(year Ⅱ)
大家好,我是Kamen Black 君,今天我与大家简单分享一下我两年来在CSDN的创作历程。 print("祝大家每天快乐,love and peace!") 机缘 当初写博客是为了记录一些自己大学中做比赛的心得,没想到自己能走到这一步…...
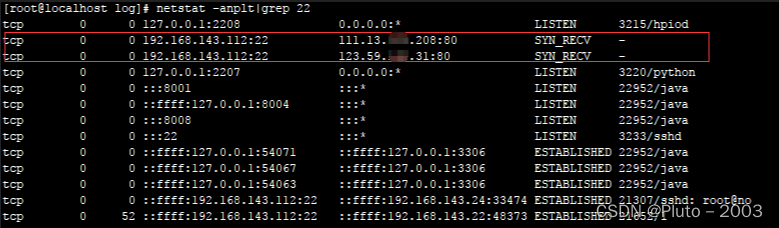
应急响应实战笔记05Linux实战篇(1)
第1篇:SSH暴力破解 0x00 前言 SSH 是目前较可靠,专为远程登录会话和其他网络服务提供安全性的协议,主要用于给远程登录会话数据进行加密,保证数据传输的安全。SSH口令长度太短或者复杂度不够,如仅包含数字&#x…...
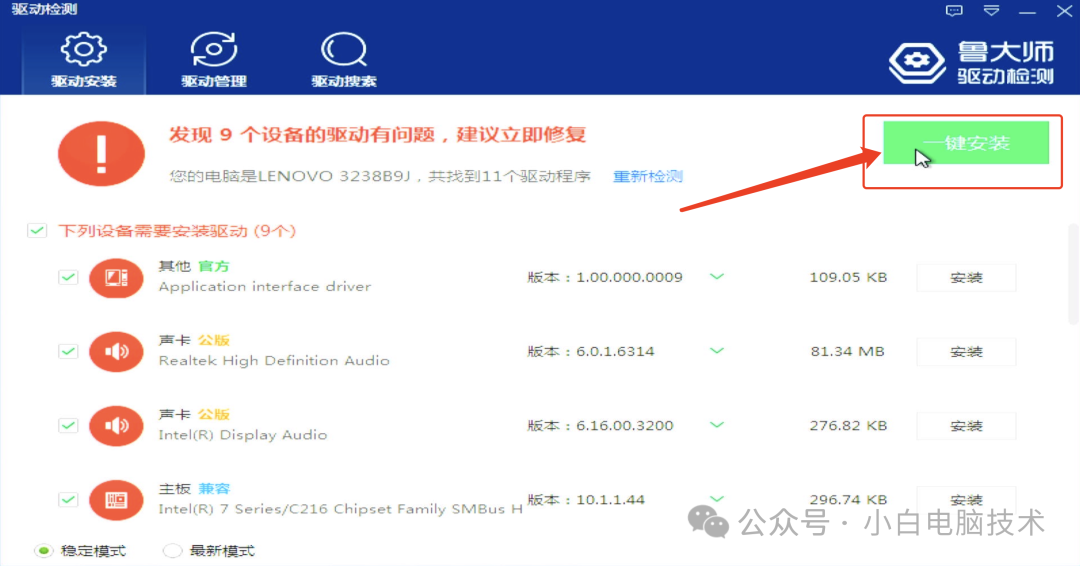
重装系统之后,电脑连网卡都没反应怎么办?
前言 有些电脑比较奇葩,安装完成之后会出现网卡连驱动都没有,这时候要安装电脑驱动可是真的烦躁。怎么下手呢? 如果确定电脑的网卡型号还好,直接找个电脑下载个对应的网卡驱动,用U盘复制过去就能安装。 但如果不知道…...

【三十五】【算法分析与设计】综合练习(2),22。 括号生成,77。 组合,494。 目标和,模拟树递归,临时变量自动维护树定义,递归回溯,非树结构模拟树
22. 括号生成 数字 n 代表生成括号的对数,请你设计一个函数,用于能够生成所有可能的并且 有效的 括号组合。 示例 1: 输入:n 3 输出:["((())࿰…...

QT智能指针
一.概述 Qt智能指针是一种能够在不需要手动管理内存的情况下,自动释放资源的指针。它们是C11的std::shared_ptr的一种扩展,可以用于管理Qt对象,尤其是那些不是QObject的对象。 使用智能指针可以避免内存泄露和悬垂指针等问题,同时…...

C++笔记之pkg-config详解,以及g++、gcc编译时使用pkg-config
C++笔记之pkg-config详解,以及g++、gcc编译时使用pkg-config —— 2024-04-05 code review 文章目录 C++笔记之pkg-config详解,以及g++、gcc编译时使用pkg-config1.pkg-config详解`pkg-config` 的基本用法在 `g++`/`gcc` 编译时使用 `pkg-config`注意事项2.示例C++,普通编译…...
[Apple Vision Pro]开源项目 Beautiful Things App Template
1. 技术框架概述: - Beautiful Things App Template是一个为visionOS设计的免费开源软件(FOSS),用于展示3D模型画廊。 2. 定位: - 该模板作为Beautiful Things网站的延伸,旨在为Apple Vision Pro用户…...
 笔记)
Qt Remote Objects (QtRO) 笔记
简介 Qt Remote Objects (QtRO) 是 Qt 的一个进程间通信模块。 术语 Source 是指提供服务或提供功能供其他程序使用的对象,是 RPC 中的被调用端。 Replica 是指 Source 对象的代理对象,用于 RPC 中的调用端,对 Replica 的调用请求将被转发…...
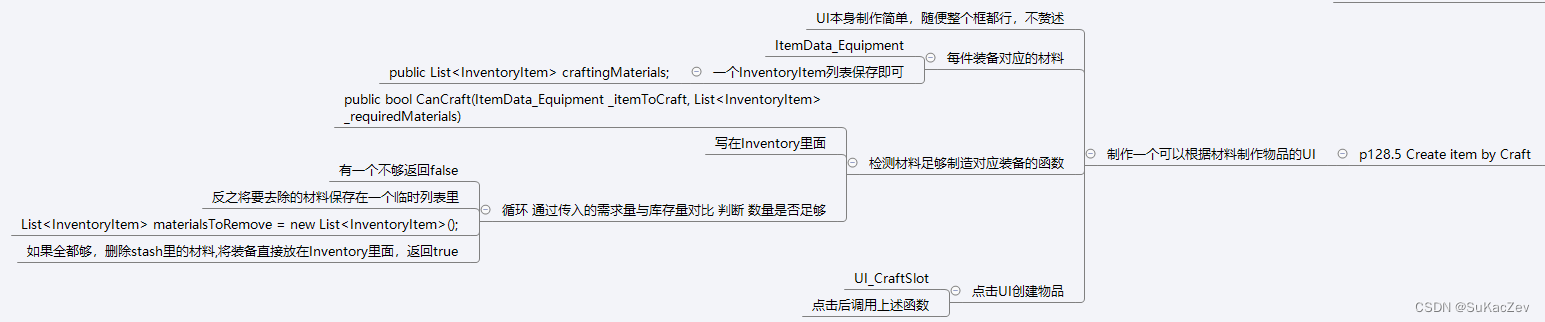
Unity类银河恶魔城学习记录12-6.5 p128.5 Create item by Craft源代码
此章节在原视频缺失,此过程为根据源代码推断而来,并非原视频步骤 Alex教程每一P的教程原代码加上我自己的理解初步理解写的注释,可供学习Alex教程的人参考 此代码仅为较上一P有所改变的代码 【Unity教程】从0编程制作类银河恶魔城游戏_哔哩…...
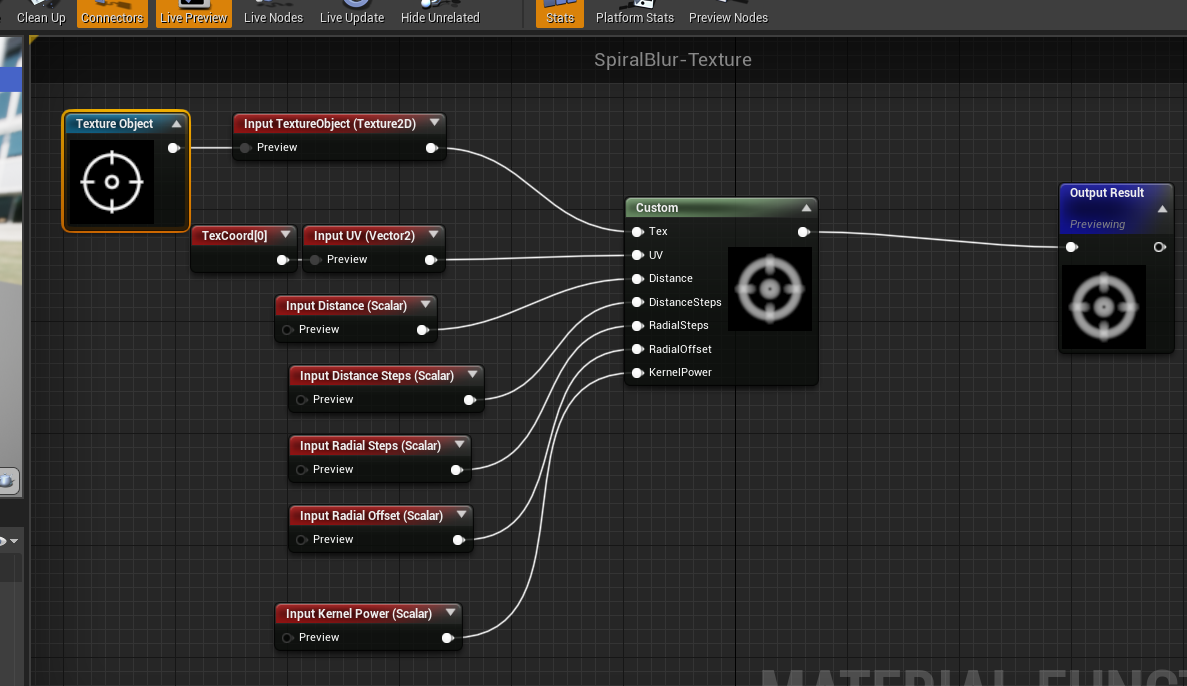
UE4_如果快速做出毛玻璃效果_假景深
UE4_如果快速做出毛玻璃效果_假景深 2022-08-20 15:02 一个SpiralBlur-SceneTexture材质节点完成效果,启用半透明材质通过修改BlurAmount数值大小调整效果spiralBlur-SceneTexture custom节点,HLSL语言float3 CurColor 0;float2 BaseUV MaterialFloa…...
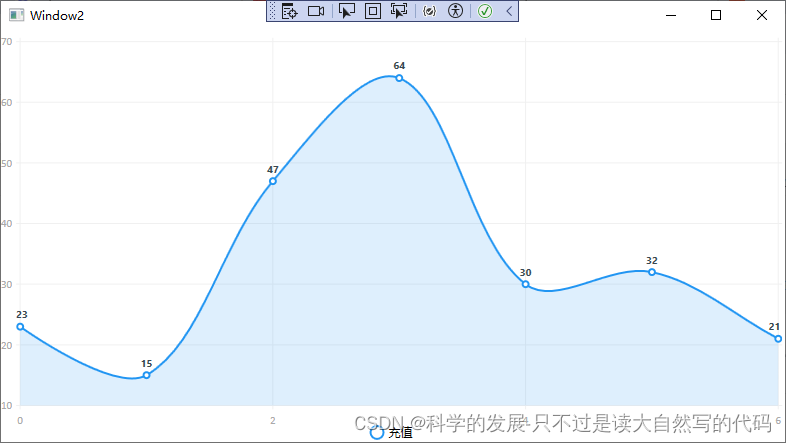
c# wpf LiveCharts 绑定 简单试验
1.概要 c# wpf LiveCharts 绑定 简单试验 2.代码 <Window x:Class"WpfApp3.Window2"xmlns"http://schemas.microsoft.com/winfx/2006/xaml/presentation"xmlns:x"http://schemas.microsoft.com/winfx/2006/xaml"xmlns:d"http://schem…...
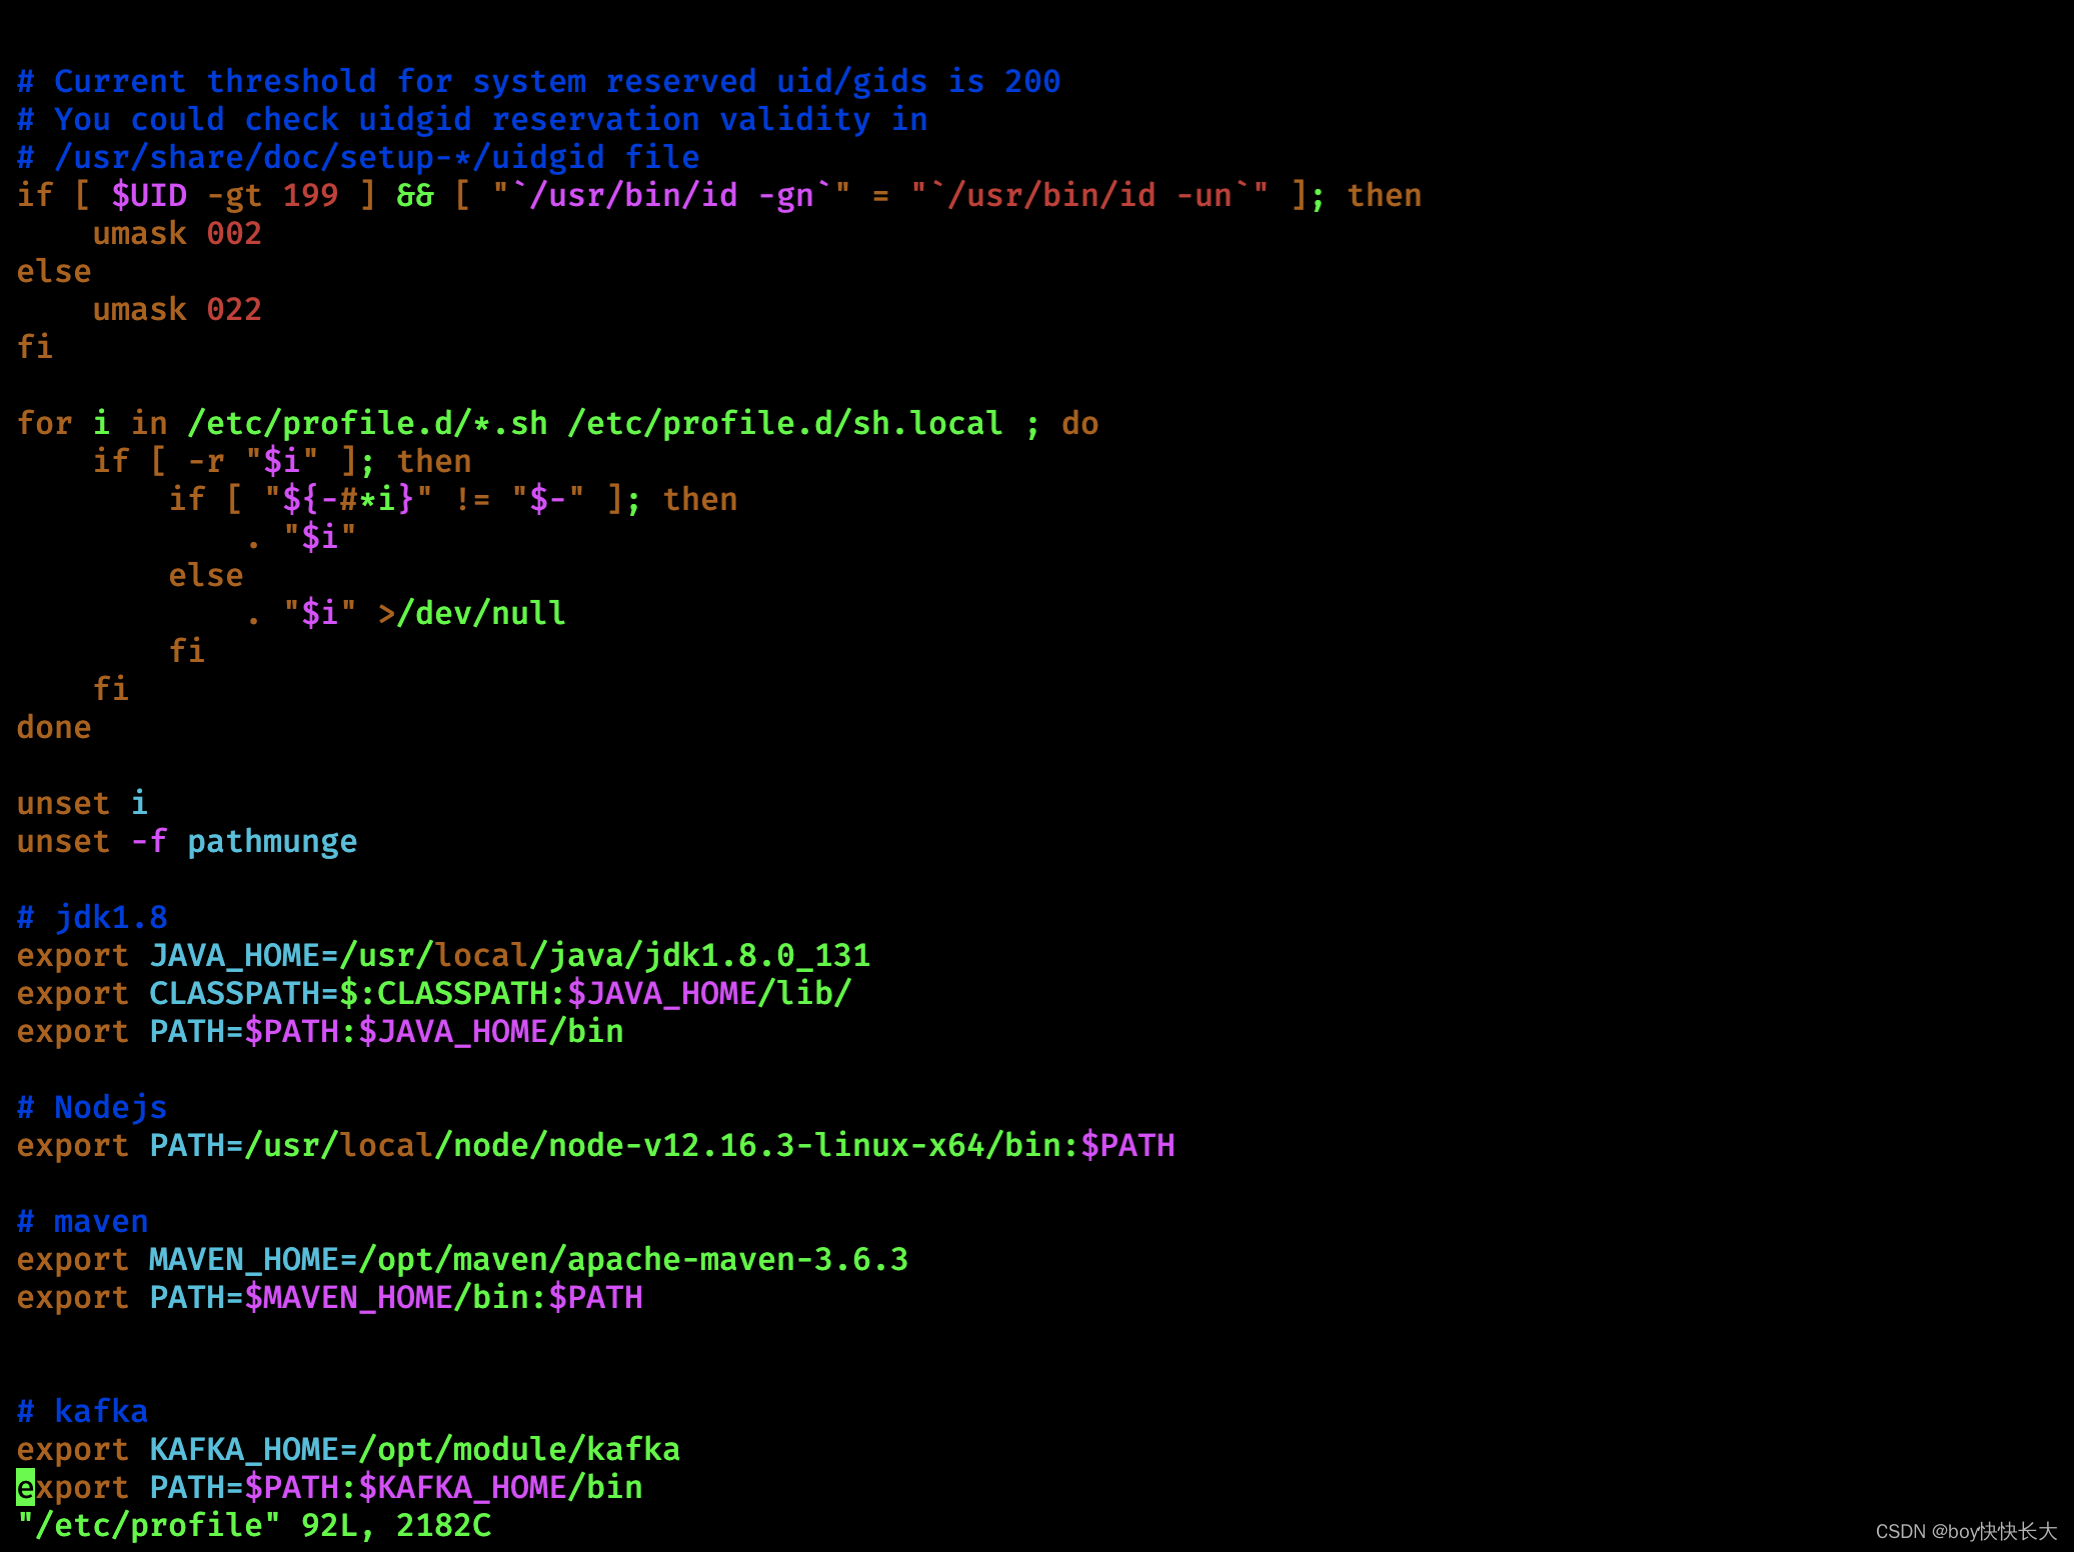
【Kafka】Kafka安装、配置、使用
【Kafka】安装Kafka 1. 安装Kafka2. Kafka使用2.0 集群分发脚本xsync(重要)2.0.1 scp命令2.0.2 rsync远程同步工具2.0.3 写一个集群分发脚本xsync (Shell 脚本) 2.1 Zookeeper安装2.2 对Kafka进行分发2.2.1 执行同步脚本2.2.2 三台云主机配置Kafka环境变量 1. 安装Kafka Kafka…...
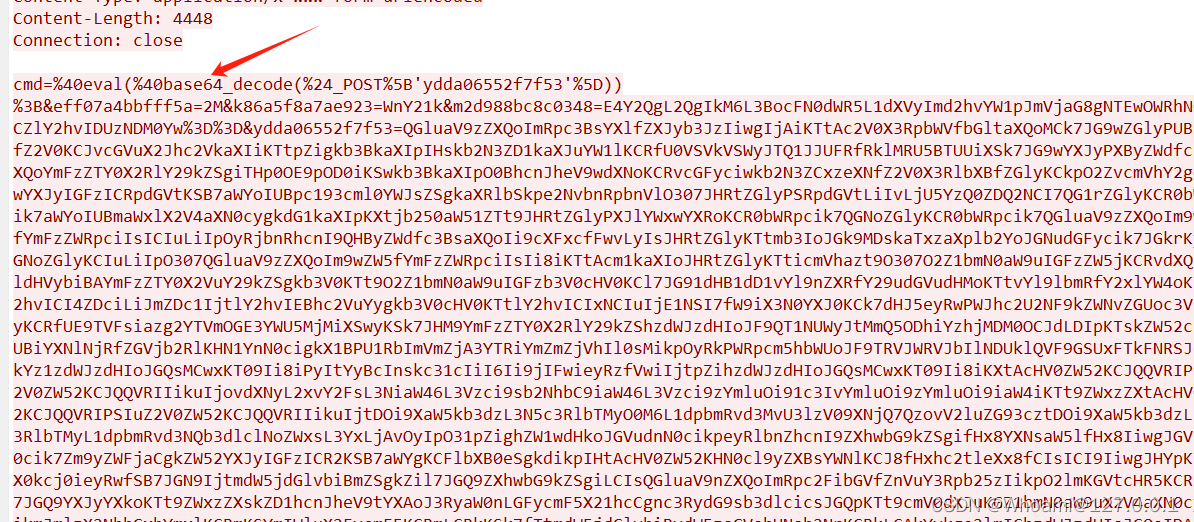
2024HW-->Wireshark攻击流量分析
在HW中,最离不开的,肯定是看监控了,那么就要去了解一些wireshark的基础用法以及攻击的流量!!!! 1.Wireshark的基本用法 比如人家面试官给你一段流量包,你要会用 1.分组详情 对于我…...

Lafida多目数据集实测
Lafida 数据集 paper:J. Imaging | Free Full-Text | LaFiDa—A Laserscanner Multi-Fisheye Camera Dataset 官网数据:https://www.ipf.kit.edu/english/projekt_cv_szenen.php 官网:KIT-IPF-Software and Datasets - LaFiDa 标定数据下载&…...

excel wps中编码格式转换
EXCEL报表:另存为CSV格式,转换成UTF-8编码 - 简书 (jianshu.com) 经验证管用...
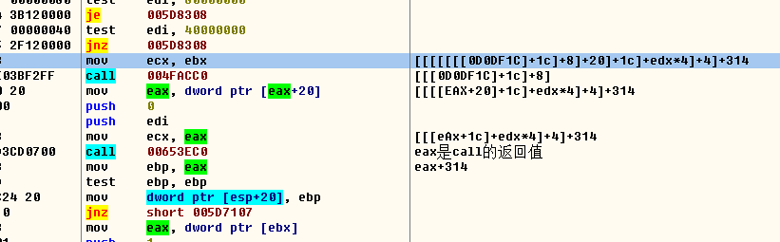
【游戏分析】非游戏领空追字符串来源
通过NPC名称找NPC数组 扫描 NPC名字 ASIC型 发现全部都有后缀 那么采用 字节集的方式去扫描 也是扫不到 说明:不是ASIC型字符串 扫描 NPC名字 Unicode型 没有结果 那么转换成字节集去扫描 终于发现结果了 把结果挨个修改字符串 发现 其中两个是可以用的 22和23 …...

memrok:专为开发者设计的命令行记忆管理工具,提升项目效率
1. 项目概述:一个面向开发者的记忆管理工具最近在整理个人知识库和项目代码时,我常常被一个问题困扰:那些零散但关键的代码片段、临时的配置参数、一闪而过的调试思路,到底应该记在哪里?用笔记软件太笨重,用…...

暗黑破坏神2存档编辑器:游戏数据解析与自定义编辑的技术实现
暗黑破坏神2存档编辑器:游戏数据解析与自定义编辑的技术实现 【免费下载链接】d2s-editor 项目地址: https://gitcode.com/gh_mirrors/d2/d2s-editor 在游戏开发与修改社区中,暗黑破坏神2(Diablo II)作为经典ARPG游戏&…...

别再乱用`return`了!深入理解Lua函数多返回值:`table.unpack`的妙用与尾调用优化
别再乱用return了!深入理解Lua函数多返回值:table.unpack的妙用与尾调用优化 在游戏开发中,我们经常需要处理复杂的技能系统。比如一个火球术可能同时返回伤害值、燃烧效果、目标列表等多个数据。新手开发者往往会写出这样的代码:…...

点云成像三维焊缝识别与机器人跟踪【附代码】
✨ 长期致力于点云成像、焊缝识别定位、机器人、点云拼接、焊缝轨迹跟踪研究工作,擅长数据搜集与处理、建模仿真、程序编写、仿真设计。 ✅ 专业定制毕设、代码 ✅如需沟通交流,点击《获取方式》 (1)基于圆柱体拟合与ICP拼接的点云…...

基于浏览器自动化的高级爬虫框架autoclaw实战指南
1. 项目概述与核心价值最近在折腾自动化脚本时,发现了一个挺有意思的GitHub项目,叫jmoraispk/autoclaw。乍一看名字,可能会联想到“自动爪子”或者“爬虫”,实际上,它也确实是一个专注于自动化网页交互和数据抓取的工具…...

如何一次性解决Windows系统“应用程序无法启动“的终极指南
如何一次性解决Windows系统"应用程序无法启动"的终极指南 【免费下载链接】vcredist AIO Repack for latest Microsoft Visual C Redistributable Runtimes 项目地址: https://gitcode.com/gh_mirrors/vc/vcredist 你是否曾经遇到过这样的情况:下载…...

别再只把PCA当降维工具了!用它处理三维点云,5分钟搞定地面和墙面分割
别再只把PCA当降维工具了!用它处理三维点云,5分钟搞定地面和墙面分割 当我们在处理三维点云数据时,常常会遇到需要将地面、墙面和其他物体点进行分割的场景。传统方法可能需要复杂的算法和大量的计算资源,但今天我要分享的是一个…...

从零构建轻量级AI智能体:核心原理、架构与实战指南
1. 项目概述:当“瘦身”的AI代理遇见开源协作 最近在GitHub上闲逛,发现一个挺有意思的项目: nvtien547/lean-agentic 。光看名字,就透着一股“务实”和“高效”的味道。“Lean”这个词,在软件开发领域,尤…...

League Akari:3步打造你的英雄联盟智能游戏助手,告别繁琐操作
League Akari:3步打造你的英雄联盟智能游戏助手,告别繁琐操作 【免费下载链接】League-Toolkit An all-in-one toolkit for LeagueClient. Gathering power 🚀. 项目地址: https://gitcode.com/gh_mirrors/le/League-Toolkit League A…...

NTU-RGB+D数据集在PyTorch/GCN中的实战应用:从数据加载到模型训练避坑指南
NTU-RGBD数据集在PyTorch/GCN中的实战应用:从数据加载到模型训练避坑指南 当我们需要构建一个基于骨骼数据的动作识别模型时,NTU-RGBD数据集无疑是最受欢迎的选择之一。这个包含超过56,000个动作样本的大规模数据集,为研究者提供了丰富的训练…...