基于机器学习模型预测信用卡潜在用户(XGBoost、LightGBM和Random Forest)
基于机器学习模型预测信用卡潜在用户(XGBoost、LightGBM和Random Forest)
随着数据科学和机器学习的发展,越来越多的企业开始利用这些技术来提高运营效率。在这篇博客中,我将分享如何利用机器学习模型来预测信用卡的潜在客户。此项目基于我整理的代码和文件,涉及数据预处理、数据可视化、模型训练、预测及结果保存的完整流程。
项目概述
本项目旨在使用机器学习模型预测哪些客户最有可能成为信用卡的潜在客户。我们将使用三个主要的机器学习模型:XGBoost、LightGBM和随机森林(Random Forest)。以下是项目的主要步骤:
1、数据预处理
2、数据可视化
3、模型训练
4、模型预测
5、模型保存
1. 数据预处理
数据预处理是机器学习项目中至关重要的一步。通过清洗和准备数据,我们可以提高模型的性能和准确性。
import numpy as np # linear algebra
import pandas as pd # data processing, CSV file I/O (e.g. pd.read_csv)
import matplotlib.pyplot as plt
import seaborn as sns
#Loading the dataset
df_train=pd.read_csv("dataset/train_s3TEQDk.csv")
df_train["source"]="train"
df_test=pd.read_csv("dataset/test_mSzZ8RL.csv")
df_test["source"]="test"
df=pd.concat([df_train,df_test],ignore_index=True)
df.head()
| ID | Gender | Age | Region_Code | Occupation | Channel_Code | Vintage | Credit_Product | Avg_Account_Balance | Is_Active | Is_Lead | source | |
|---|---|---|---|---|---|---|---|---|---|---|---|---|
| 0 | NNVBBKZB | Female | 73 | RG268 | Other | X3 | 43 | No | 1045696 | No | 0.0 | train |
| 1 | IDD62UNG | Female | 30 | RG277 | Salaried | X1 | 32 | No | 581988 | No | 0.0 | train |
| 2 | HD3DSEMC | Female | 56 | RG268 | Self_Employed | X3 | 26 | No | 1484315 | Yes | 0.0 | train |
| 3 | BF3NC7KV | Male | 34 | RG270 | Salaried | X1 | 19 | No | 470454 | No | 0.0 | train |
| 4 | TEASRWXV | Female | 30 | RG282 | Salaried | X1 | 33 | No | 886787 | No | 0.0 | train |
1. Checking and Cleaning Dataset :
#Checking columns of dataset
df.columns
Index(['ID', 'Gender', 'Age', 'Region_Code', 'Occupation', 'Channel_Code','Vintage', 'Credit_Product', 'Avg_Account_Balance', 'Is_Active','Is_Lead', 'source'],dtype='object')
#Checking shape
df.shape
(351037, 12)
#Checking unique values
df.nunique()
ID                     351037
Gender                      2
Age                        63
Region_Code                35
Occupation                  4
Channel_Code                4
Vintage                    66
Credit_Product              2
Avg_Account_Balance    162137
Is_Active                   2
Is_Lead                     2
source                      2
dtype: int64
#Check for Null Values
df.isnull().sum()
ID                          0
Gender                      0
Age                         0
Region_Code                 0
Occupation                  0
Channel_Code                0
Vintage                     0
Credit_Product          41847
Avg_Account_Balance         0
Is_Active                   0
Is_Lead                105312
source                      0
dtype: int64
Observation:
Null values are present in Credit _Product column.
#Fill null values in Credit_Product feature
df['Credit_Product']= df['Credit_Product'].fillna("NA")
#Again check for null values
df.isnull().sum()
ID                          0
Gender                      0
Age                         0
Region_Code                 0
Occupation                  0
Channel_Code                0
Vintage                     0
Credit_Product              0
Avg_Account_Balance         0
Is_Active                   0
Is_Lead                105312
source                      0
dtype: int64
#Checking Datatypes and info
df.info()
<class 'pandas.core.frame.DataFrame'>
RangeIndex: 351037 entries, 0 to 351036
Data columns (total 12 columns):#   Column               Non-Null Count   Dtype
---  ------               --------------   -----  0   ID                   351037 non-null  object 1   Gender               351037 non-null  object 2   Age                  351037 non-null  int64  3   Region_Code          351037 non-null  object 4   Occupation           351037 non-null  object 5   Channel_Code         351037 non-null  object 6   Vintage              351037 non-null  int64  7   Credit_Product       351037 non-null  object 8   Avg_Account_Balance  351037 non-null  int64  9   Is_Active            351037 non-null  object 10  Is_Lead              245725 non-null  float6411  source               351037 non-null  object
dtypes: float64(1), int64(3), object(8)
memory usage: 32.1+ MB
#Changing Yes to 1 and No to 0 in Is_Active column to covert  data into floatdf["Is_Active"].replace(["Yes","No"],[1,0],inplace=True)df['Is_Active'] = df['Is_Active'].astype(float)
df.head()
| ID | Gender | Age | Region_Code | Occupation | Channel_Code | Vintage | Credit_Product | Avg_Account_Balance | Is_Active | Is_Lead | source | |
|---|---|---|---|---|---|---|---|---|---|---|---|---|
| 0 | NNVBBKZB | Female | 73 | RG268 | Other | X3 | 43 | No | 1045696 | 0.0 | 0.0 | train |
| 1 | IDD62UNG | Female | 30 | RG277 | Salaried | X1 | 32 | No | 581988 | 0.0 | 0.0 | train |
| 2 | HD3DSEMC | Female | 56 | RG268 | Self_Employed | X3 | 26 | No | 1484315 | 1.0 | 0.0 | train |
| 3 | BF3NC7KV | Male | 34 | RG270 | Salaried | X1 | 19 | No | 470454 | 0.0 | 0.0 | train |
| 4 | TEASRWXV | Female | 30 | RG282 | Salaried | X1 | 33 | No | 886787 | 0.0 | 0.0 | train |
#Now changing all categorical column into numerical form using label endcoding
cat_col=[ 'Gender', 'Region_Code', 'Occupation','Channel_Code', 'Credit_Product']from sklearn.preprocessing import LabelEncoder
le = LabelEncoder()
for col in cat_col:df[col]= le.fit_transform(df[col])df_2= df
df_2.head()
| ID | Gender | Age | Region_Code | Occupation | Channel_Code | Vintage | Credit_Product | Avg_Account_Balance | Is_Active | Is_Lead | source | |
|---|---|---|---|---|---|---|---|---|---|---|---|---|
| 0 | NNVBBKZB | 0 | 73 | 18 | 1 | 2 | 43 | 1 | 1045696 | 0.0 | 0.0 | train |
| 1 | IDD62UNG | 0 | 30 | 27 | 2 | 0 | 32 | 1 | 581988 | 0.0 | 0.0 | train |
| 2 | HD3DSEMC | 0 | 56 | 18 | 3 | 2 | 26 | 1 | 1484315 | 1.0 | 0.0 | train |
| 3 | BF3NC7KV | 1 | 34 | 20 | 2 | 0 | 19 | 1 | 470454 | 0.0 | 0.0 | train |
| 4 | TEASRWXV | 0 | 30 | 32 | 2 | 0 | 33 | 1 | 886787 | 0.0 | 0.0 | train |
#Separating the train and test
df_train=df_2.loc[df_2["source"]=="train"]
df_test=df_2.loc[df_2["source"]=="test"]
df_1 = df_train
#we can drop column as they are irrelevant and have no effect on our data
df_1.drop(columns=['ID',"source"],inplace=True)
df_1.head()
| Gender | Age | Region_Code | Occupation | Channel_Code | Vintage | Credit_Product | Avg_Account_Balance | Is_Active | Is_Lead | |
|---|---|---|---|---|---|---|---|---|---|---|
| 0 | 0 | 73 | 18 | 1 | 2 | 43 | 1 | 1045696 | 0.0 | 0.0 |
| 1 | 0 | 30 | 27 | 2 | 0 | 32 | 1 | 581988 | 0.0 | 0.0 |
| 2 | 0 | 56 | 18 | 3 | 2 | 26 | 1 | 1484315 | 1.0 | 0.0 |
| 3 | 1 | 34 | 20 | 2 | 0 | 19 | 1 | 470454 | 0.0 | 0.0 |
| 4 | 0 | 30 | 32 | 2 | 0 | 33 | 1 | 886787 | 0.0 | 0.0 |
2. 数据可视化
数据可视化有助于我们更好地理解数据的分布和特征。以下是一些常用的数据可视化方法:
import warnings
warnings.filterwarnings("ignore")
plt.rcParams['figure.figsize']  = (10,6)
plt.rcParams['font.size']  = 16
sns.set_style("whitegrid")
sns.distplot(df['Age']);

sns.distplot(df['Avg_Account_Balance'])
plt.show()

#Countplot for Gender feature
# plt.figure(figsize=(8,4))
sns.countplot(df['Gender'],palette='Accent')
plt.show()

#Countplot for Target variable i.e 'Is_Lead'
target = 'Is_Lead'
# plt.figure(figsize=(8,4))
sns.countplot(df[target],palette='hls')
print(df[target].value_counts())
0.0    187437
1.0     58288
Name: Is_Lead, dtype: int64
plt.rcParams['figure.figsize'] = (12,6)
#Checking occupation with customers
# plt.figure(figsize=(8,4))
sns.countplot(x='Occupation',hue='Is_Lead',data=df,palette= 'magma')
plt.show()

#Plot showing Activness of customer in last 3 months with respect to Occupation of customer
# plt.figure(figsize=(8,4))
sns.catplot(y='Age',x='Occupation',hue='Is_Active',data=df,kind='bar',palette='Oranges')
plt.show()

3. 模型训练
我们将使用三个模型进行训练:XGBoost、LightGBM和随机森林。以下是模型的训练代码:
# To balance the dataset , we will apply undersampling method
from sklearn.utils import resample
# separate the minority and majority classes
df_majority = df_1[df_1['Is_Lead']==0]
df_minority = df_1[df_1['Is_Lead']==1]print(" The majority class values are", len(df_majority))
print(" The minority class values are", len(df_minority))
print(" The ratio of both classes are", len(df_majority)/len(df_minority))
The majority class values are 187437The minority class values are 58288The ratio of both classes are 3.215704776283283
# undersample majority class
df_majority_undersampled = resample(df_majority, replace=True, n_samples=len(df_minority), random_state=0)
# combine minority class with oversampled majority class
df_undersampled = pd.concat([df_minority, df_majority_undersampled])df_undersampled['Is_Lead'].value_counts()
df_1=df_undersampled# display new class value counts
print(" The undersamples class values count is:", len(df_undersampled))
print(" The ratio of both classes are", len(df_undersampled[df_undersampled["Is_Lead"]==0])/len(df_undersampled[df_undersampled["Is_Lead"]==1]))
The undersamples class values count is: 116576The ratio of both classes are 1.0
# dropping target variable
#assign the value of y for training and testing phase
xc = df_1.drop(columns=['Is_Lead'])
yc = df_1[["Is_Lead"]]
df_1.head()
| Gender | Age | Region_Code | Occupation | Channel_Code | Vintage | Credit_Product | Avg_Account_Balance | Is_Active | Is_Lead | |
|---|---|---|---|---|---|---|---|---|---|---|
| 6 | 1 | 62 | 32 | 1 | 2 | 20 | 0 | 1056750 | 1.0 | 1.0 |
| 15 | 1 | 33 | 18 | 3 | 1 | 69 | 0 | 517063 | 1.0 | 1.0 |
| 16 | 0 | 46 | 18 | 1 | 2 | 97 | 2 | 2282502 | 0.0 | 1.0 |
| 17 | 0 | 59 | 33 | 1 | 2 | 15 | 2 | 2384692 | 0.0 | 1.0 |
| 20 | 1 | 44 | 19 | 3 | 1 | 19 | 2 | 1001650 | 0.0 | 1.0 |
#Importing necessary libraries
from sklearn import metrics
from scipy.stats import zscore
from sklearn.preprocessing import LabelEncoder,StandardScaler
from sklearn.model_selection import train_test_split,GridSearchCV
from sklearn.decomposition import PCA
from sklearn.metrics import precision_score, recall_score, confusion_matrix, f1_score, roc_auc_score, roc_curve
from sklearn.metrics import accuracy_score,classification_report,confusion_matrix,roc_auc_score,roc_curve
from sklearn.metrics import auc
from sklearn.metrics import plot_roc_curve
from sklearn.linear_model import LogisticRegression
from sklearn.naive_bayes import MultinomialNB
from sklearn.neighbors import KNeighborsClassifier
from sklearn.ensemble import RandomForestClassifier
from sklearn.svm import SVC
from sklearn.tree import DecisionTreeClassifier
from sklearn.ensemble import AdaBoostClassifier,GradientBoostingClassifier
from sklearn.model_selection import cross_val_score
from sklearn.naive_bayes import GaussianNB#Import warnings
import warnings
warnings.filterwarnings('ignore')
#Standardizing value of x by using standardscaler to make the data normally distributed
sc = StandardScaler()
df_xc = pd.DataFrame(sc.fit_transform(xc),columns=xc.columns)
df_xc.head()
| Gender | Age | Region_Code | Occupation | Channel_Code | Vintage | Credit_Product | Avg_Account_Balance | Is_Active | |
|---|---|---|---|---|---|---|---|---|---|
| 0 | 0.871922 | 1.102987 | 1.080645 | -1.254310 | 1.098078 | -0.961192 | -1.495172 | -0.118958 | 1.192880 |
| 1 | 0.871922 | -0.895316 | -0.208525 | 1.008933 | -0.052828 | 0.484610 | -1.495172 | -0.748273 | 1.192880 |
| 2 | -1.146891 | 0.000475 | -0.208525 | -1.254310 | 1.098078 | 1.310784 | 1.220096 | 1.310361 | -0.838307 |
| 3 | -1.146891 | 0.896266 | 1.172729 | -1.254310 | 1.098078 | -1.108723 | 1.220096 | 1.429522 | -0.838307 |
| 4 | 0.871922 | -0.137339 | -0.116441 | 1.008933 | -0.052828 | -0.990699 | 1.220096 | -0.183209 | -0.838307 |
#defining a function to find fit of the modeldef max_accuracy_scr(names,model_c,df_xc,yc):accuracy_scr_max = 0roc_scr_max=0train_xc,test_xc,train_yc,test_yc = train_test_split(df_xc,yc,random_state = 42,test_size = 0.2,stratify = yc)model_c.fit(train_xc,train_yc)pred = model_c.predict_proba(test_xc)[:, 1]roc_score = roc_auc_score(test_yc, pred)accuracy_scr = accuracy_score(test_yc,model_c.predict(test_xc))if roc_score> roc_scr_max:roc_scr_max=roc_scorefinal_model = model_cmean_acc = cross_val_score(final_model,df_xc,yc,cv=5,scoring="accuracy").mean()std_dev = cross_val_score(final_model,df_xc,yc,cv=5,scoring="accuracy").std()cross_val = cross_val_score(final_model,df_xc,yc,cv=5,scoring="accuracy")print("*"*50)print("Results for model : ",names,'\n',"max roc score correspond to random state " ,roc_scr_max ,'\n',"Mean accuracy score is : ",mean_acc,'\n',"Std deviation score is : ",std_dev,'\n',"Cross validation scores are : " ,cross_val) print(f"roc_auc_score: {roc_score}")print("*"*50)
#Now by using multiple Algorithms we are calculating the best Algo which performs best for our data set
accuracy_scr_max = []
models=[]
#accuracy=[]
std_dev=[]
roc_auc=[]
mean_acc=[]
cross_val=[]
models.append(('Logistic Regression', LogisticRegression()))
models.append(('Random Forest', RandomForestClassifier()))
models.append(('Decision Tree Classifier',DecisionTreeClassifier()))
models.append(("GausianNB",GaussianNB()))for names,model_c in models:max_accuracy_scr(names,model_c,df_xc,yc)
**************************************************
Results for model : Logistic Regression max roc score correspond to random state 0.727315712597147 Mean accuracy score is : 0.6696918411779096 Std deviation score is : 0.0030322593046897828 Cross validation scores are : [0.67361469 0.66566588 0.66703839 0.67239974 0.66974051]
roc_auc_score: 0.727315712597147
**************************************************
**************************************************
Results for model : Random Forest max roc score correspond to random state 0.8792762631904103 Mean accuracy score is : 0.8117279862602139 Std deviation score is : 0.002031698139189051 Cross validation scores are : [0.81043061 0.81162342 0.81158053 0.81115162 0.81616985]
roc_auc_score: 0.8792762631904103
**************************************************
**************************************************
Results for model : Decision Tree Classifier max roc score correspond to random state 0.7397495282209642 Mean accuracy score is : 0.7426399792028343 Std deviation score is : 0.0025271129138200485 Cross validation scores are : [0.74288043 0.74162556 0.74149689 0.73870899 0.74462792]
roc_auc_score: 0.7397495282209642
**************************************************
**************************************************
Results for model : GausianNB max roc score correspond to random state 0.7956111563031266 Mean accuracy score is : 0.7158677336619202 Std deviation score is : 0.0015884106712636206 Cross validation scores are : [0.71894836 0.71550504 0.71546215 0.71443277 0.71499035]
roc_auc_score: 0.7956111563031266
**************************************************
First Attempt:Random Forest Classifier
# Estimating best n_estimator using grid search for Randomforest Classifier
parameters={"n_estimators":[1,10,100]}
rf_clf=RandomForestClassifier()
clf = GridSearchCV(rf_clf, parameters, cv=5,scoring="roc_auc")
clf.fit(df_xc,yc)
print("Best parameter : ",clf.best_params_,"\nBest Estimator : ", clf.best_estimator_,"\nBest Score : ", clf.best_score_)
Best parameter :  {'n_estimators': 100}
Best Estimator :  RandomForestClassifier()
Best Score :  0.8810508979668068
#Again running RFC with n_estimator = 100
rf_clf=RandomForestClassifier(n_estimators=100,random_state=42)
max_accuracy_scr("RandomForest Classifier",rf_clf,df_xc,yc)
**************************************************
Results for model :  RandomForest Classifier max roc score correspond to random state  0.879415808805665 Mean accuracy score is :  0.8115392510996895 Std deviation score is :  0.0008997445291505284 Cross validation scores are :   [0.81180305 0.81136607 0.81106584 0.81037958 0.81308171]
roc_auc_score: 0.879415808805665
**************************************************
xc_train,xc_test,yc_train,yc_test=train_test_split(df_xc, yc,random_state = 80,test_size=0.20,stratify=yc)
rf_clf.fit(xc_train,yc_train)
yc_pred=rf_clf.predict(xc_test)
plt.rcParams['figure.figsize'] = (12,8)
#  Random Forest Classifier Resultspred_pb=rf_clf.predict_proba(xc_test)[:,1]
Fpr,Tpr,thresholds = roc_curve(yc_test,pred_pb,pos_label=True)
auc = roc_auc_score(yc_test,pred_pb)print(" ROC_AUC score is ",auc)
print("accuracy score is : ",accuracy_score(yc_test,yc_pred))
print("Precision is : " ,precision_score(yc_test, yc_pred))
print("Recall is: " ,recall_score(yc_test, yc_pred))
print("F1 Score is : " ,f1_score(yc_test, yc_pred))
print("classification report \n",classification_report(yc_test,yc_pred))#Plotting confusion matrix
cnf = confusion_matrix(yc_test,yc_pred)
sns.heatmap(cnf, annot=True, cmap = "magma")
 ROC_AUC score is  0.8804566893762799
accuracy score is :  0.8127466117687425
Precision is :  0.8397949673811743
Recall is:  0.7729456167438669
F1 Score is :  0.8049848132928354
classification report precision    recall  f1-score   support0.0       0.79      0.85      0.82     116581.0       0.84      0.77      0.80     11658accuracy                           0.81     23316macro avg       0.81      0.81      0.81     23316
weighted avg       0.81      0.81      0.81     23316<AxesSubplot:>

plt.rcParams['figure.figsize'] = (12,6)
#plotting the graph for area under curve for representing accuracy of data
plt.plot([0,1],[1,0],'g--')
plt.plot(Fpr,Tpr)
plt.xlabel('False_Positive_Rate')
plt.ylabel('True_Positive_Rate')
plt.title("Random Forest Classifier")
plt.show()
Second Attempt: XG Boost Classifer
from sklearn.utils import class_weight
class_weight.compute_class_weight('balanced', np.unique(yc_train), yc_train["Is_Lead"])weights = np.ones(y_train.shape[0], dtype = 'float')
for i, val in enumerate(y_train):weights[i] = classes_weights[val-1]xgb_classifier.fit(X, y, sample_weight=weights)
#Trying XGBoost
import xgboost as xg
from xgboost import XGBClassifier
from sklearn.utils import class_weightclf2 = xg.XGBClassifier(class_weight='balanced').fit(xc_train, yc_train)
class_weight.compute_class_weight('balanced', np.unique(yc_train), yc_train["Is_Lead"])
xg_pred = clf2.predict(xc_test)
[23:35:16] WARNING: /private/var/folders/fc/8d9mxh2s4ssd8k64mkmlsrj00000gn/T/pip-req-build-y40nwdrb/build/temp.macosx-10.9-x86_64-3.8/xgboost/src/learner.cc:576:
Parameters: { "class_weight" } might not be used.This may not be accurate due to some parameters are only used in language bindings butpassed down to XGBoost core.  Or some parameters are not used but slip through thisverification. Please open an issue if you find above cases.[23:35:16] WARNING: /private/var/folders/fc/8d9mxh2s4ssd8k64mkmlsrj00000gn/T/pip-req-build-y40nwdrb/build/temp.macosx-10.9-x86_64-3.8/xgboost/src/learner.cc:1100: Starting in XGBoost 1.3.0, the default evaluation metric used with the objective 'binary:logistic' was changed from 'error' to 'logloss'. Explicitly set eval_metric if you'd like to restore the old behavior.
plt.rcParams['figure.figsize'] = (12,8)
#XG Boost Results
xg_pred_2=clf2.predict_proba(xc_test)[:,1]
Fpr,Tpr,thresholds = roc_curve(yc_test,xg_pred_2,pos_label=True)
auc = roc_auc_score(yc_test,xg_pred_2)print(" ROC_AUC score is ",auc)
print("accuracy score is : ",accuracy_score(yc_test,xg_pred))
print("Precision is : " ,precision_score(yc_test, xg_pred))
print("Recall is: " ,recall_score(yc_test, xg_pred))
print("F1 Score is : " ,f1_score(yc_test, xg_pred))
print("classification report \n",classification_report(yc_test,xg_pred))cnf = confusion_matrix(yc_test,xg_pred)
sns.heatmap(cnf, annot=True, cmap = "magma")
 ROC_AUC score is  0.8706238059470456
accuracy score is :  0.8033968090581575
Precision is :  0.8246741325500275
Recall is:  0.7706296105678504
F1 Score is :  0.7967364313586378
classification report precision    recall  f1-score   support0.0       0.78      0.84      0.81     116581.0       0.82      0.77      0.80     11658accuracy                           0.80     23316macro avg       0.80      0.80      0.80     23316
weighted avg       0.80      0.80      0.80     23316<AxesSubplot:>

plt.rcParams['figure.figsize'] = (12,6)
#plotting the graph for area under curve for representing accuracy of data
plt.plot([0,1],[1,0],'g--')
plt.plot(Fpr,Tpr)
plt.xlabel('False_Positive_Rate')
plt.ylabel('True_Positive_Rate')
plt.title("XG_Boost Classifier")
plt.show()

Third Attempt: LGBM Model with Stratification Folds
#Trying stratification modeling
from sklearn.model_selection import KFold, StratifiedKFolddef cross_val(xc, yc, model, params, folds=10):skf = StratifiedKFold(n_splits=folds, shuffle=True, random_state=42)for fold, (train_idx, test_idx) in enumerate(skf.split(xc, yc)):print(f"Fold: {fold}")xc_train, yc_train = xc.iloc[train_idx], yc.iloc[train_idx]xc_test, yc_test = xc.iloc[test_idx], yc.iloc[test_idx]model_c= model(**params)model_c.fit(xc_train, yc_train,eval_set=[(xc_test, yc_test)],early_stopping_rounds=100, verbose=300)pred_y = model_c.predict_proba(xc_test)[:, 1]roc_score = roc_auc_score(yc_test, pred_y)print(f"roc_auc_score: {roc_score}")print("-"*50)return model_c
#Applying LGBM Model with 10 stratified cross-folds
from lightgbm import LGBMClassifierlgb_params= {'learning_rate': 0.045, 'n_estimators': 10000,'max_bin': 84,'num_leaves': 10,'max_depth': 20,'reg_alpha': 8.457,'reg_lambda': 6.853,'subsample': 0.749}
lgb_model = cross_val(xc, yc, LGBMClassifier, lgb_params)
Fold: 0
Training until validation scores don't improve for 100 rounds
[300]	valid_0's binary_logloss: 0.433821
[600]	valid_0's binary_logloss: 0.433498
Early stopping, best iteration is:
[599]	valid_0's binary_logloss: 0.433487
roc_auc_score: 0.8748638095718249
--------------------------------------------------
Fold: 1
Training until validation scores don't improve for 100 rounds
[300]	valid_0's binary_logloss: 0.434881
[600]	valid_0's binary_logloss: 0.43445
Early stopping, best iteration is:
[569]	valid_0's binary_logloss: 0.43442
roc_auc_score: 0.8755631159104413
--------------------------------------------------
Fold: 2
Training until validation scores don't improve for 100 rounds
[300]	valid_0's binary_logloss: 0.431872
[600]	valid_0's binary_logloss: 0.43125
[900]	valid_0's binary_logloss: 0.430984
Early stopping, best iteration is:
[1013]	valid_0's binary_logloss: 0.430841
roc_auc_score: 0.877077541404848
--------------------------------------------------
Fold: 3
Training until validation scores don't improve for 100 rounds
[300]	valid_0's binary_logloss: 0.442048
[600]	valid_0's binary_logloss: 0.44142
[900]	valid_0's binary_logloss: 0.441142
Early stopping, best iteration is:
[895]	valid_0's binary_logloss: 0.44114
roc_auc_score: 0.8721270953106521
--------------------------------------------------
Fold: 4
Training until validation scores don't improve for 100 rounds
[300]	valid_0's binary_logloss: 0.439466
[600]	valid_0's binary_logloss: 0.438899
Early stopping, best iteration is:
[782]	valid_0's binary_logloss: 0.438824
roc_auc_score: 0.8709229804739002
--------------------------------------------------
Fold: 5
Training until validation scores don't improve for 100 rounds
[300]	valid_0's binary_logloss: 0.427545
Early stopping, best iteration is:
[445]	valid_0's binary_logloss: 0.42739
roc_auc_score: 0.8792290845510382
--------------------------------------------------
Fold: 6
Training until validation scores don't improve for 100 rounds
[300]	valid_0's binary_logloss: 0.440554
[600]	valid_0's binary_logloss: 0.439762
[900]	valid_0's binary_logloss: 0.439505
[1200]	valid_0's binary_logloss: 0.439264
Early stopping, best iteration is:
[1247]	valid_0's binary_logloss: 0.439142
roc_auc_score: 0.872610593872283
--------------------------------------------------
Fold: 7
Training until validation scores don't improve for 100 rounds
[300]	valid_0's binary_logloss: 0.423764
Early stopping, best iteration is:
[414]	valid_0's binary_logloss: 0.423534
roc_auc_score: 0.8806521642373888
--------------------------------------------------
Fold: 8
Training until validation scores don't improve for 100 rounds
[300]	valid_0's binary_logloss: 0.440673
Early stopping, best iteration is:
[409]	valid_0's binary_logloss: 0.440262
roc_auc_score: 0.8708570312002339
--------------------------------------------------
Fold: 9
Training until validation scores don't improve for 100 rounds
[300]	valid_0's binary_logloss: 0.441536
[600]	valid_0's binary_logloss: 0.441034
Early stopping, best iteration is:
[661]	valid_0's binary_logloss: 0.440952
roc_auc_score: 0.8713195377336685
--------------------------------------------------
#LGBM results
lgb_pred_2=clf2.predict_proba(xc_test)[:,1]
Fpr,Tpr,thresholds = roc_curve(yc_test,lgb_pred_2,pos_label=True)
auc = roc_auc_score(yc_test,lgb_pred_2)print(" ROC_AUC score is ",auc)
lgb_model.fit(xc_train,yc_train)
lgb_pred=lgb_model.predict(xc_test)
print("accuracy score is : ",accuracy_score(yc_test,lgb_pred))
print("Precision is : " ,precision_score(yc_test, lgb_pred))
print("Recall is: " ,recall_score(yc_test, lgb_pred))
print("F1 Score is : " ,f1_score(yc_test, lgb_pred))
print("classification report \n",classification_report(yc_test,lgb_pred))cnf = confusion_matrix(yc_test,lgb_pred)
sns.heatmap(cnf, annot=True, cmap = "magma")
 ROC_AUC score is  0.8706238059470456
accuracy score is :  0.8030965860353405
Precision is :  0.8258784469242829
Recall is:  0.7681420483787956
F1 Score is :  0.7959646237944981
classification report precision    recall  f1-score   support0.0       0.78      0.84      0.81     116581.0       0.83      0.77      0.80     11658accuracy                           0.80     23316macro avg       0.80      0.80      0.80     23316
weighted avg       0.80      0.80      0.80     23316<AxesSubplot:>

plt.rcParams['figure.figsize'] = (12,6)
#plotting the graph for area under curve for representing accuracy of data
plt.plot([0,1],[1,0],'g--')
plt.plot(Fpr,Tpr)
plt.xlabel('False_Positive_Rate')
plt.ylabel('True_Positive_Rate')
plt.title("LGB Classifier model")
plt.show()

5. 模型预测
模型训练完成后,我们使用测试数据进行预测:
#we can drop column as they are irrelevant and have no effect on our data
df_3 = df_test
df_3.drop(columns=["source"],inplace=True)
df_3.head()
| ID | Gender | Age | Region_Code | Occupation | Channel_Code | Vintage | Credit_Product | Avg_Account_Balance | Is_Active | Is_Lead | |
|---|---|---|---|---|---|---|---|---|---|---|---|
| 245725 | VBENBARO | 1 | 29 | 4 | 1 | 0 | 25 | 2 | 742366 | 0.0 | NaN |
| 245726 | CCMEWNKY | 1 | 43 | 18 | 1 | 1 | 49 | 0 | 925537 | 0.0 | NaN |
| 245727 | VK3KGA9M | 1 | 31 | 20 | 2 | 0 | 14 | 1 | 215949 | 0.0 | NaN |
| 245728 | TT8RPZVC | 1 | 29 | 22 | 1 | 0 | 33 | 1 | 868070 | 0.0 | NaN |
| 245729 | SHQZEYTZ | 0 | 29 | 20 | 1 | 0 | 19 | 1 | 657087 | 0.0 | NaN |
# dropping target variable
#assign the value of y for training and testing phase
xc_pred = df_3.drop(columns=['Is_Lead',"ID"])#Standardizing value of x by using standardscaler to make the data normally distributed
sc = StandardScaler()
df_xc_pred = pd.DataFrame(sc.fit_transform(xc_pred),columns=xc_pred.columns)
lead_pred_xg=clf2.predict_proba(df_xc_pred)[:,1]
lead_pred_lgb=lgb_model.predict_proba(df_xc_pred)[:,1]
lead_pred_rf=rf_clf.predict_proba(df_xc_pred)[:,1]
print(lead_pred_xg, lead_pred_lgb, lead_pred_rf)
[0.09673516 0.9428428 0.12728807 ... 0.31698707 0.1821623 0.17593904] [0.14278614 0.94357392 0.13603912 ... 0.22251432 0.24186564 0.16873483] [0.17 0.97 0.09 ... 0.5 0.09 0.15]
#Dataframe for lead prediction
lead_pred_lgb= pd.DataFrame(lead_pred_lgb,columns=["Is_Lead"])
lead_pred_xg= pd.DataFrame(lead_pred_xg,columns=["Is_Lead"])
lead_pred_rf= pd.DataFrame(lead_pred_rf,columns=["Is_Lead"])
df_test = df_test.reset_index()
df_test.head()
| index | ID | Gender | Age | Region_Code | Occupation | Channel_Code | Vintage | Credit_Product | Avg_Account_Balance | Is_Active | Is_Lead | |
|---|---|---|---|---|---|---|---|---|---|---|---|---|
| 0 | 245725 | VBENBARO | 1 | 29 | 4 | 1 | 0 | 25 | 2 | 742366 | 0.0 | NaN |
| 1 | 245726 | CCMEWNKY | 1 | 43 | 18 | 1 | 1 | 49 | 0 | 925537 | 0.0 | NaN |
| 2 | 245727 | VK3KGA9M | 1 | 31 | 20 | 2 | 0 | 14 | 1 | 215949 | 0.0 | NaN |
| 3 | 245728 | TT8RPZVC | 1 | 29 | 22 | 1 | 0 | 33 | 1 | 868070 | 0.0 | NaN |
| 4 | 245729 | SHQZEYTZ | 0 | 29 | 20 | 1 | 0 | 19 | 1 | 657087 | 0.0 | NaN |
#Saving ID  and prediction to csv file for XG Model
df_pred_xg=pd.concat([df_test["ID"],lead_pred_xg],axis=1,ignore_index=True)
df_pred_xg.columns = ["ID","Is_Lead"]
print(df_pred_xg.head())
df_pred_xg.to_csv("Credit_Card_Lead_Predictions_final_xg.csv",index=False)#Saving ID  and prediction to csv file for LGB Model
df_pred_lgb=pd.concat([df_test["ID"],lead_pred_lgb],axis=1,ignore_index=True)
df_pred_lgb.columns = ["ID","Is_Lead"]
print(df_pred_lgb.head())
df_pred_lgb.to_csv("Credit_Card_Lead_Predictions_final_lgb.csv",index=False)#Saving ID  and prediction to csv file for RF model
df_pred_rf=pd.concat([df_test["ID"],lead_pred_rf],axis=1,ignore_index=True)
df_pred_rf.columns = ["ID","Is_Lead"]
print(df_pred_rf.head())
df_pred_rf.to_csv("Credit_Card_Lead_Predictions_final_rf.csv",index=False)
         ID   Is_Lead
0  VBENBARO  0.096735
1  CCMEWNKY  0.942843
2  VK3KGA9M  0.127288
3  TT8RPZVC  0.052260
4  SHQZEYTZ  0.057762ID   Is_Lead
0  VBENBARO  0.142786
1  CCMEWNKY  0.943574
2  VK3KGA9M  0.136039
3  TT8RPZVC  0.084144
4  SHQZEYTZ  0.055887ID  Is_Lead
0  VBENBARO     0.17
1  CCMEWNKY     0.97
2  VK3KGA9M     0.09
3  TT8RPZVC     0.12
4  SHQZEYTZ     0.09
6. 模型保存
为了在未来能够方便地加载和使用训练好的模型,我们将模型保存为pickle文件:
import joblib
# 将模型保存为文件中的pickle
joblib.dump(lgb_model,'lgb_model.pkl')
['lgb_model.pkl']
如有遇到问题可以找小编沟通交流哦。另外小编帮忙辅导大课作业,学生毕设等。不限于MapReduce, MySQL, python,java,大数据,模型训练等。 hadoop hdfs yarn spark Django flask flink kafka flume datax sqoop seatunnel echart可视化 机器学习等

相关文章:

基于机器学习模型预测信用卡潜在用户(XGBoost、LightGBM和Random Forest)
基于机器学习模型预测信用卡潜在用户(XGBoost、LightGBM和Random Forest) 随着数据科学和机器学习的发展,越来越多的企业开始利用这些技术来提高运营效率。在这篇博客中,我将分享如何利用机器学习模型来预测信用卡的潜在客户。此…...
)
java 通过 microsoft graph 调用outlook(三)
这次会添加一个Reply接口, 并且使用6.10.0版本 直接上代码 一, POM <!-- office 365 --><dependency><groupId>com.microsoft.graph</groupId><artifactId>microsoft-graph</artifactId><version>6.1…...
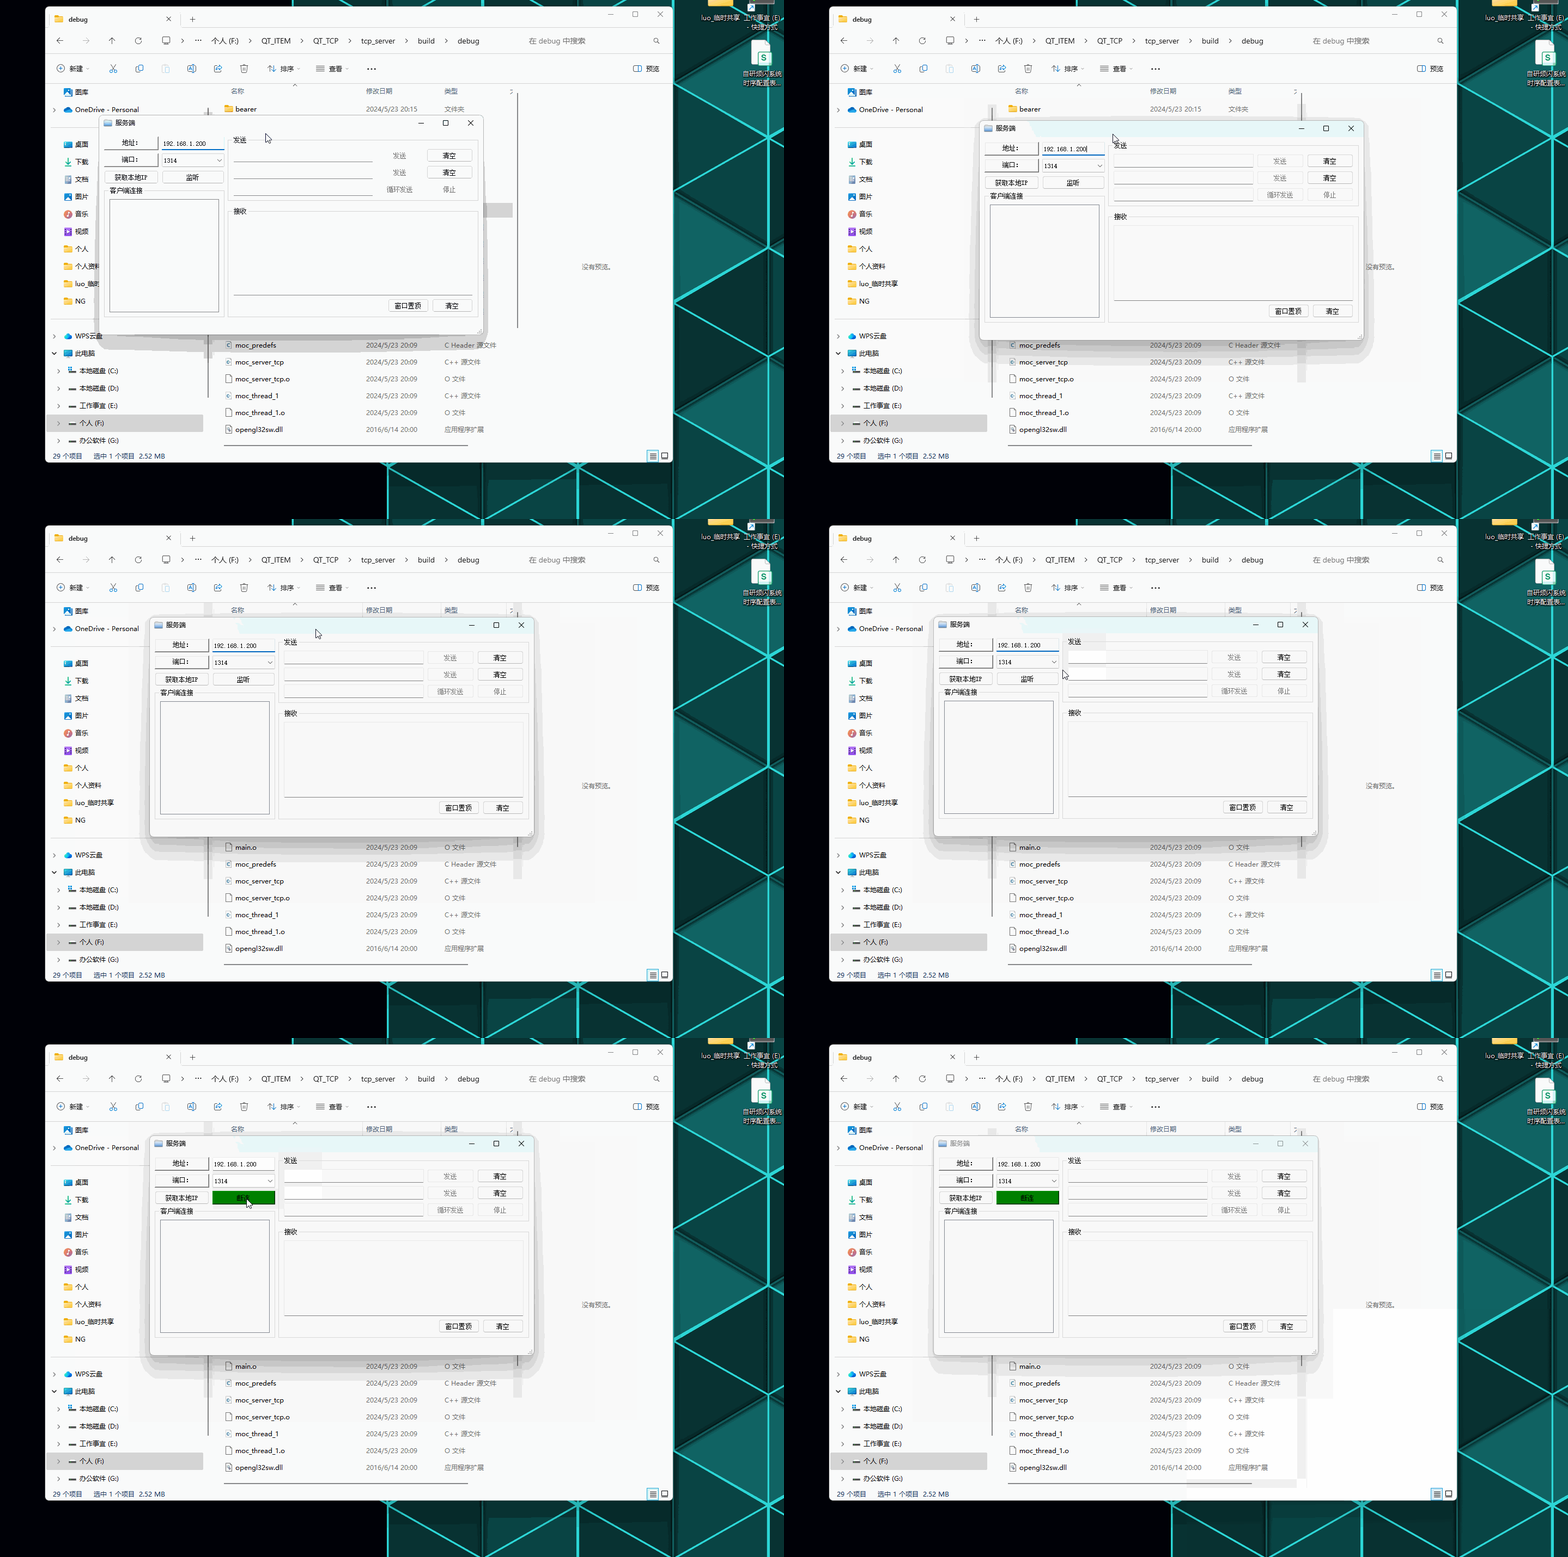
QT--TCP网络通讯工具编写记录
QT–TCP网络通讯工具编写记录 文章目录 QT--TCP网络通讯工具编写记录前言演示如下:一、服务端项目文件:【1.1】server_tcp.h 服务端声明文件【1.2】thread_1.h 线程处理声明文件【1.3】main.cpp 执行源文件【1.4】server_tcp.cpp 服务端逻辑实现源文件【…...

如何解决爬虫的IP地址受限问题?
使用代理IP池、采用动态IP更换策略、设置合理的爬取时间间隔和模拟正常用户行为,是解决爬虫IP地址受限问题的主要策略。代理IP池是通过集合多个代理IP来分配爬虫任务,从而避免相同的IP地址对目标网站进行高频次访问,减少被目标网站封禁的风险…...

harmony 文件上传
图片上传 1, 获取文件,这里指的是图片 在鸿蒙内部有一个API pick选择器,实现文件保存和文件选择的功能, 使用pick对象创建PhotoViewPicker实例 传入必要的参数,如选择图片的数量,和弹出窗口的位置…...

什么是安全左移如何实现安全左移
文章目录 一、传统软件开发面临的安全挑战二、什么是安全左移四、安全左移与安全开发生命周期(SDL)三、安全左移对开发的挑战五、从DevOps到DevSecOps六、SDL与DevSecOps 一、传统软件开发面临的安全挑战 传统软件开发面临的安全挑战主要包括以下几个方…...

将PCD点云投影到BEV平面得到图片
前言 点云数据作为一种丰富的三维空间信息表达方式,通常用于自动驾驶、机器人导航和三维建模等领域。然而,点云数据的直观性不如二维图像,这限制了它在一些需要快速视觉反馈的应用场景中的使用。本文将探讨如何将点云数据转换为二维图像&…...
)
计算机笔记14(续20个)
230.色彩的种类就是色相 饱和度就是彩度除以明度 231.RISC是精简指令集,CISC是复杂指令集 232.世界上第一台数字计算机,奠定了至今仍在使用计算机体系结构 233.数据传输中,电路交换的传输延迟最小 234.定点整数的小数点约定在最低…...

docker 使用桥接网
在Docker中使用桥接网络,你可以创建一个新的桥接网络或者使用默认的桥接网络(如果已经存在的话)。以下是创建新桥接网络和连接容器到这个网络的示例命令: 1.创建一个新的桥接网络(如果你想创建一个新的)&a…...

1金融风控相关业务介绍
金融风控相关业务介绍 学习目标 知道常见信贷风险知道机器学习风控模型的优势知道信贷领域常用术语含义1 信贷&风控介绍 信贷业务,就是贷款业务,是商业银行和互联网金融公司最重要的资产业务和主要赢利手段 通过放款收回本金和利息,扣除成本后获得利润。贷款平台预测有…...

521源码-免费教程-经常用到的Vue.js的Vue@Cli入门指导
更多网站源码学习教程,请点击👉-521源码-👈获取最新资源:521源码-网站源码-资源素材-免费下载 Vue.js是一款流行的JavaScript框架,它使得构建交互式的Web界面变得简单和快捷。VueCli是Vue.js官方提供的脚手架工具&…...

大数据技术原理(二):搭建hadoop伪分布式集群这一篇就够了
(实验一 搭建hadoop伪分布式) -------------------------------------------------------------------------------------------------------------------------------- 一、实验目的 1.理解Hadoop伪分布式的安装过程 实验内容涉及Hadoop平台的搭建和…...

中间件是什么?信创中间件有哪些牌子?哪家好用?
当今社会,中间件的重要性日益凸显,尤其是在信创背景下,选择适合的中间件产品对于推动企业数字化转型和升级具有重要意义。今天我们就来聊聊中间件是什么?信创中间件有哪些牌子?哪家好用?仅供参考哈…...

python实现520表白图案
今天是520哦,作为程序员有必要通过自己的专业知识来向你的爱人表达下你的爱意。那么python中怎么实现绘制520表白图案呢?这里给出方法: 1、使用图形库(如turtle) 使用turtle模块,你可以绘制各种形状和图案…...

【Linux】-Flink分布式内存计算集群部署[21]
注意: 本节的操作,需要前置准备好Hadoop生态集群,请先部署好Hadoop环境 简介 Flink同spark一样,是一款分布式内存计算引擎,可以支撑海量数据的分布式计算 Flink在大数据体系同样是明星产品,作为新一代的…...

《python程序语言设计》2018版第5章第44题利用python循环进行十进制变十六进制,依然是44题的旧问题。倒着打出来的16进制
它似乎也有上一道题同样道问题。就是结果可能是倒着的。我还不能用超纲的办法。似乎上一个问题的难点又传到了下面 note: 我建立了一个method_a的变量干脆把整数除16的第一次放到循环外。 这样是不是可以解决呢? 我感觉还是在整除和除于的概念中,没有解脱…...

【HarmonyOS4学习笔记】《HarmonyOS4+NEXT星河版入门到企业级实战教程》课程学习笔记(九)
课程地址: 黑马程序员HarmonyOS4NEXT星河版入门到企业级实战教程,一套精通鸿蒙应用开发 (本篇笔记对应课程第 16 节) P16《15.ArkUI-状态管理-任务统计案例》 1、实现任务进度卡片 怎么让进度条和进度展示文本堆叠展示࿱…...

海山数据库(He3DB)数据仓库发展历史与架构演进:(一)传统数仓
从1990年代Bill Inmon提出数据仓库概念后经过四十多的发展,经历了早期的PC时代、互联网时代、移动互联网时代再到当前的云计算时代,但是数据仓库的构建目标基本没有变化,都是为了支持企业或者用户的决策分析,包括运营报表、企业营…...

简单快捷的图片格式转换工具:认识webp2jpg-online
经常写博客或记笔记的朋友们可能会碰到图床不支持的图片格式或图片太大需要压缩的情况。通常,我们会在浏览器中搜索在线图片格式转换器,但这些转换器往往伴有烦人的广告或要求登录,并且支持的转换格式有限。最近,我在浏览 GitHub …...

iptablese防火墙【SNAT和DNAT】
目录 1.SNAT策略及应用 1.1SNAT原理与应用 1.2 SNAT策略的工作原理 1.3 实验操练 2.DNAT策略 2.1 DNAT策略的概述 2.2 DNAT原理与应用 2.3 实验操练 1.SNAT策略及应用 1.1SNAT原理与应用 SNAT 应用环境:局域网主机共享单个公网IP地址接入Internet…...
:OpenBCI_GUI:从环境搭建到数据可视化(下))
脑机新手指南(八):OpenBCI_GUI:从环境搭建到数据可视化(下)
一、数据处理与分析实战 (一)实时滤波与参数调整 基础滤波操作 60Hz 工频滤波:勾选界面右侧 “60Hz” 复选框,可有效抑制电网干扰(适用于北美地区,欧洲用户可调整为 50Hz)。 平滑处理&…...

DeepSeek 赋能智慧能源:微电网优化调度的智能革新路径
目录 一、智慧能源微电网优化调度概述1.1 智慧能源微电网概念1.2 优化调度的重要性1.3 目前面临的挑战 二、DeepSeek 技术探秘2.1 DeepSeek 技术原理2.2 DeepSeek 独特优势2.3 DeepSeek 在 AI 领域地位 三、DeepSeek 在微电网优化调度中的应用剖析3.1 数据处理与分析3.2 预测与…...
MongoDB学习和应用(高效的非关系型数据库)
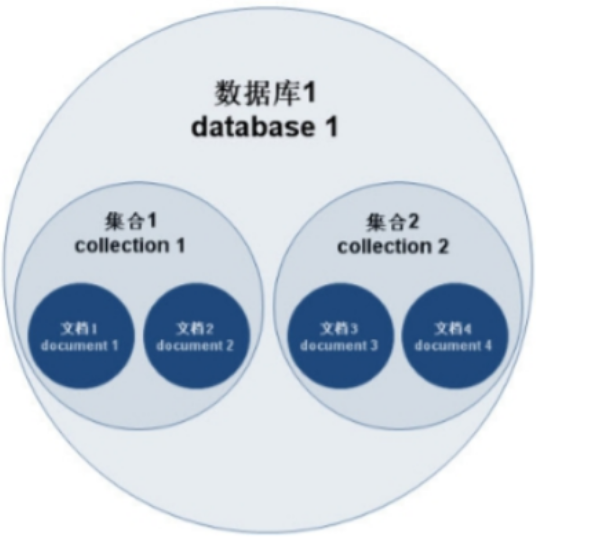
一丶 MongoDB简介 对于社交类软件的功能,我们需要对它的功能特点进行分析: 数据量会随着用户数增大而增大读多写少价值较低非好友看不到其动态信息地理位置的查询… 针对以上特点进行分析各大存储工具: mysql:关系型数据库&am…...

Cesium1.95中高性能加载1500个点
一、基本方式: 图标使用.png比.svg性能要好 <template><div id"cesiumContainer"></div><div class"toolbar"><button id"resetButton">重新生成点</button><span id"countDisplay&qu…...

Linux简单的操作
ls ls 查看当前目录 ll 查看详细内容 ls -a 查看所有的内容 ls --help 查看方法文档 pwd pwd 查看当前路径 cd cd 转路径 cd .. 转上一级路径 cd 名 转换路径 …...

【碎碎念】宝可梦 Mesh GO : 基于MESH网络的口袋妖怪 宝可梦GO游戏自组网系统
目录 游戏说明《宝可梦 Mesh GO》 —— 局域宝可梦探索Pokmon GO 类游戏核心理念应用场景Mesh 特性 宝可梦玩法融合设计游戏构想要素1. 地图探索(基于物理空间 广播范围)2. 野生宝可梦生成与广播3. 对战系统4. 道具与通信5. 延伸玩法 安全性设计 技术选…...

均衡后的SNRSINR
本文主要摘自参考文献中的前两篇,相关文献中经常会出现MIMO检测后的SINR不过一直没有找到相关数学推到过程,其中文献[1]中给出了相关原理在此仅做记录。 1. 系统模型 复信道模型 n t n_t nt 根发送天线, n r n_r nr 根接收天线的 MIMO 系…...
LINUX 69 FTP 客服管理系统 man 5 /etc/vsftpd/vsftpd.conf
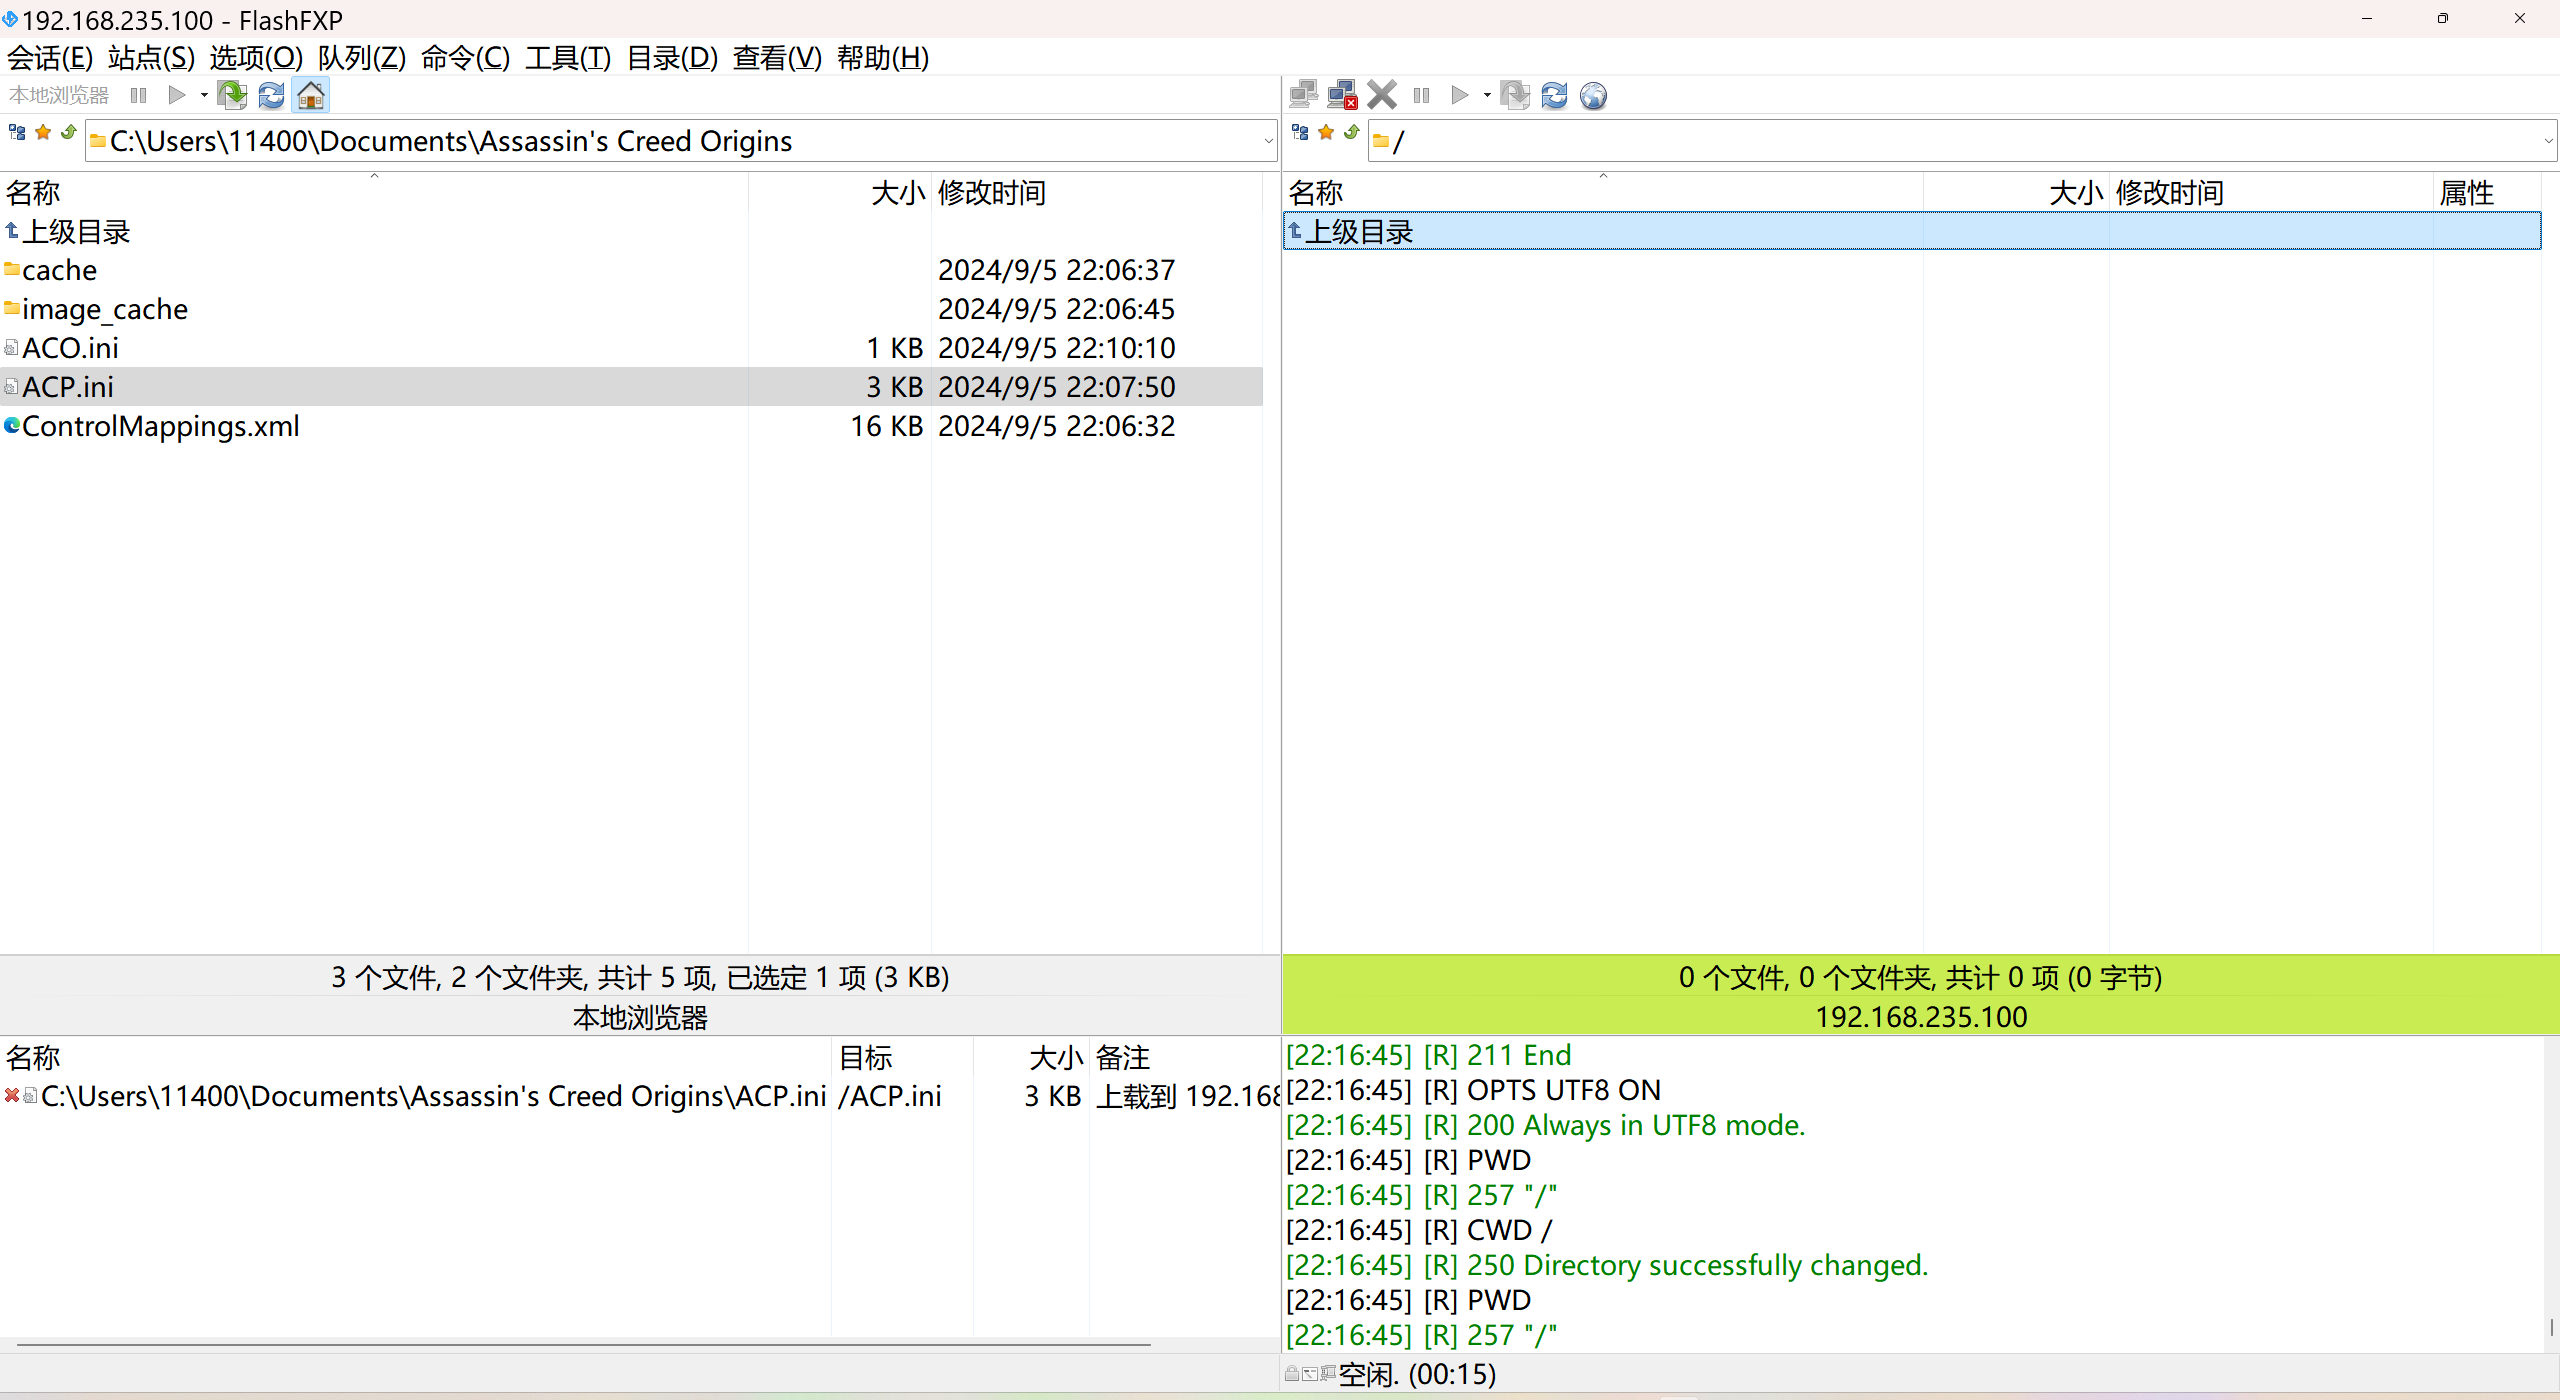
FTP 客服管理系统 实现kefu123登录,不允许匿名访问,kefu只能访问/data/kefu目录,不能查看其他目录 创建账号密码 useradd kefu echo 123|passwd -stdin kefu [rootcode caozx26420]# echo 123|passwd --stdin kefu 更改用户 kefu 的密码…...
Windows安装Miniconda
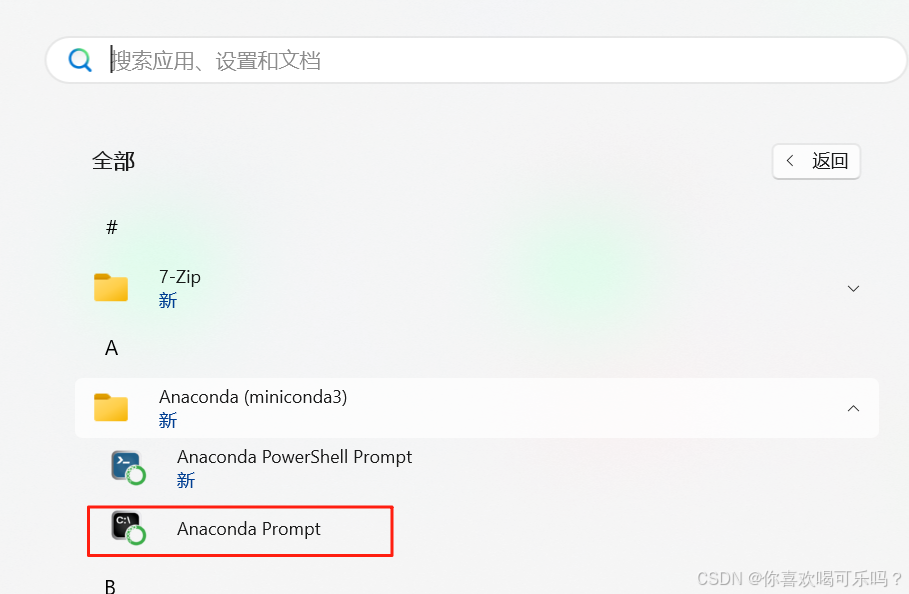
一、下载 https://www.anaconda.com/download/success 二、安装 三、配置镜像源 Anaconda/Miniconda pip 配置清华镜像源_anaconda配置清华源-CSDN博客 四、常用操作命令 Anaconda/Miniconda 基本操作命令_miniconda创建环境命令-CSDN博客...

三分算法与DeepSeek辅助证明是单峰函数
前置 单峰函数有唯一的最大值,最大值左侧的数值严格单调递增,最大值右侧的数值严格单调递减。 单谷函数有唯一的最小值,最小值左侧的数值严格单调递减,最小值右侧的数值严格单调递增。 三分的本质 三分和二分一样都是通过不断缩…...
