比较(一)利用python绘制条形图
比较(一)利用python绘制条形图
条形图(Barplot)简介
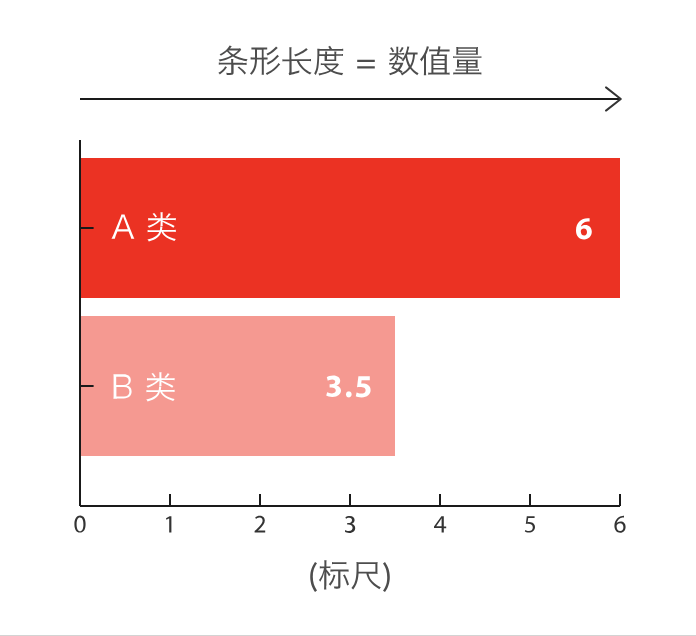
条形图主要用来比较不同类别间的数据差异,一条轴表示类别,另一条则表示对应的数值度量。
快速绘制
-
基于seaborn
import seaborn as sns
import matplotlib.pyplot as plt# 导入数据
tips = sns.load_dataset("tips")# 利用barplot函数快速绘制
sns.barplot(x="total_bill", y="day", data=tips, estimator=sum, errorbar=None, color='#69b3a2')plt.show()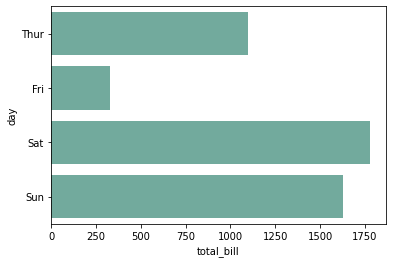
-
基于matplotlib
import matplotlib.pyplot as plt# 导入数据
tips = sns.load_dataset("tips")
grouped_tips = tips.groupby('day')['total_bill'].sum().reset_index()# 利用bar函数快速绘制
plt.bar(grouped_tips.day, grouped_tips.total_bill)plt.show()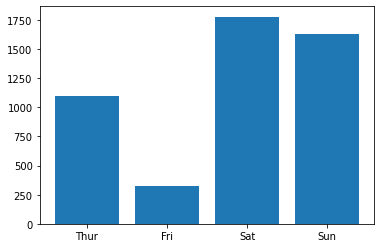
-
基于pandas
import matplotlib.pyplot as plt
import pandas as pd# 导入数据
tips = sns.load_dataset("tips")
grouped_tips = tips.groupby('day')['total_bill'].sum().reset_index()# 利用plot.bar函数快速绘制
grouped_tips.plot.bar(x='day', y='total_bill', rot=0)plt.show()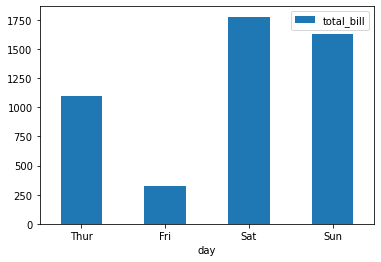
定制多样化的条形图
自定义条形图一般是结合使用场景对相关参数进行修改,并辅以其他的绘图知识。参数信息可以通过官网进行查看,其他的绘图知识则更多来源于实战经验,大家不妨将接下来的绘图作为一种学习经验,以便于日后总结。
通过seaborn绘制多样化的条形图
seaborn主要利用barplot绘制条形图,可以通过seaborn.barplot了解更多用法
-
修改参数
import seaborn as sns
import matplotlib.pyplot as plt
import numpy as npsns.set(font='SimHei', font_scale=0.8, style="darkgrid") # 解决Seaborn中文显示问题# 导入数据
tips = sns.load_dataset("tips")# 构造子图
fig, ax = plt.subplots(2,2,constrained_layout=True, figsize=(8, 8))# 修改方向-垂直
ax_sub = sns.barplot(y="total_bill", x="day", data=tips, estimator=sum, errorbar=None, color='#69b3a2',ax=ax[0][0])
ax_sub.set_title('垂直条形图')# 自定义排序
ax_sub = sns.barplot(y="total_bill", x="day", data=tips, estimator=sum, errorbar=None, color='#69b3a2',order=["Fri","Thur","Sat","Sun"],ax=ax[0][1])
ax_sub.set_title('自定义排序')# 数值排序
df = tips.groupby('day')['total_bill'].sum().sort_values(ascending=False).reset_index()
ax_sub = sns.barplot(y="day", x="total_bill", data=df, errorbar=None, color='#69b3a2',order=df['day'],ax=ax[1][0])
ax_sub.set_title('数值排序')# 添加误差线
ax_sub = sns.barplot(x="day", y="total_bill", data=tips, estimator=np.mean, errorbar=('ci', 85), capsize=.2, color='lightblue',ax=ax[1][1])
ax_sub.set_title('添加误差线')plt.show()
-
分组条形图
import seaborn as sns
import matplotlib.pyplot as plt
import numpy as npsns.set(style="darkgrid")# 导入数据
tips = sns.load_dataset("tips")fig, ax = plt.subplots(figsize=(4, 4))# 分组条形图
colors = ["#69b3a2", "#4374B3"]
sns.barplot(x="day", y="total_bill", hue="smoker", data=tips, errorbar=None, palette=colors)plt.show()# 分组/子分组条形图
sns.catplot(x="sex", y="total_bill", hue="smoker", col="day", data=tips, kind="bar", height=4, aspect=.7)plt.show()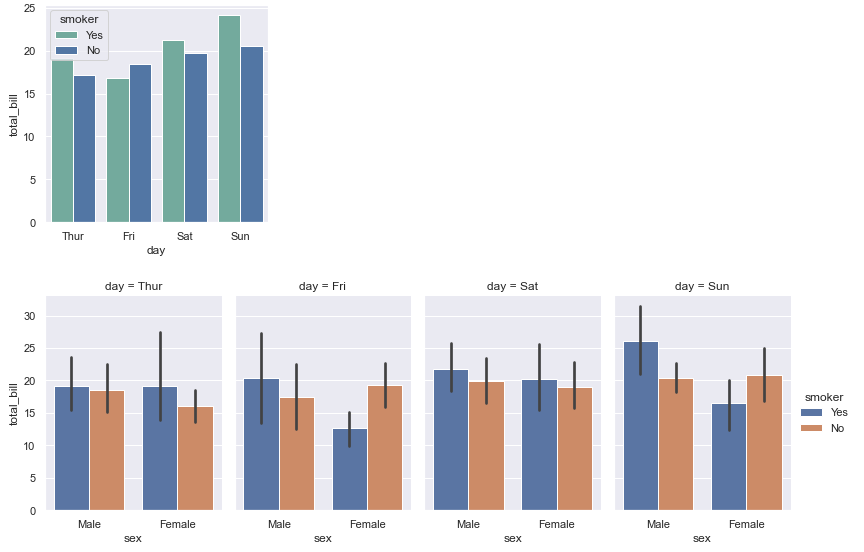
-
引申-数量堆积条形图
import seaborn as sns
import numpy as np
import matplotlib.pyplot as plt
import matplotlib.patches as mpatchessns.set(style="darkgrid")# 导入数据
tips = sns.load_dataset("tips")
df = tips.groupby(['day', 'smoker'])['total_bill'].sum().reset_index()
smoker_df = df[df['smoker']=='Yes']
non_smoker_df = df[df['smoker']=='No']# 布局
plt.figure(figsize=(6, 4))# 非吸烟者的条形图
bar1 = sns.barplot(x='day', y='total_bill', data=non_smoker_df, color='lightblue')
# 吸烟者的条形图,底部开始位置设置为非吸烟者的total_bill值(即吸烟者条形图在上面)
bar2 = sns.barplot(x='day', y='total_bill', bottom=non_smoker_df['total_bill'], data=smoker_df, color='darkblue')# 图例
top_bar = mpatches.Patch(color='darkblue', label='smoker = Yes')
bottom_bar = mpatches.Patch(color='lightblue', label='smoker = No')
plt.legend(handles=[top_bar, bottom_bar])plt.show()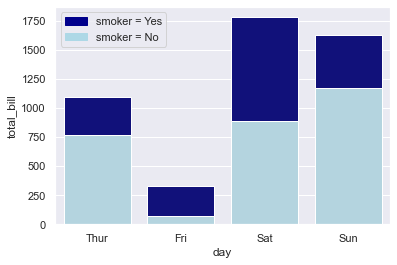
-
引申-百分比堆积条形图
import seaborn as sns
import matplotlib.pyplot as plt
import pandas as pd# 导入数据
tips = sns.load_dataset("tips")# 计算百分比
day_total_bill = tips.groupby('day')['total_bill'].sum() # 每日数据
group_total_bill = tips.groupby(['day', 'smoker'])['total_bill'].sum().reset_index() # 每日每组数据
group_total_bill['percent'] = group_total_bill.apply(lambda row: row['total_bill'] / day_total_bill[row['day']] * 100, axis=1)# 将数据分成smoker和non-smoker两份,方便我们绘制两个条形图
smoker_df = group_total_bill[group_total_bill['smoker'] == 'Yes']
non_smoker_df = group_total_bill[group_total_bill['smoker'] == 'No']# 布局
plt.figure(figsize=(6, 4))# 非吸烟者的条形图
bar1 = sns.barplot(x='day', y='percent', data=non_smoker_df, color='lightblue')
# 吸烟者的条形图,底部开始位置设置为非吸烟者的total_bill值(即吸烟者条形图在上面)
bar2 = sns.barplot(x='day', y='percent', bottom=non_smoker_df['percent'], data=smoker_df, color='darkblue')# 图例
top_bar = mpatches.Patch(color='darkblue', label='smoker = Yes')
bottom_bar = mpatches.Patch(color='lightblue', label='smoker = No')
plt.legend(handles=[top_bar, bottom_bar])plt.show()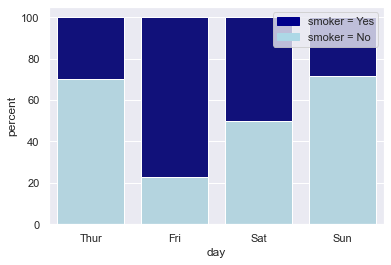
通过seaborn绘制多样化的条形图
seaborn主要利用barh绘制条形图,可以通过matplotlib.pyplot.barh了解更多用法
-
修改参数
import matplotlib as mpl
import matplotlib.pyplot as plt
import numpy as np
import pandas as pdmpl.rcParams.update(mpl.rcParamsDefault) # 恢复默认的matplotlib样式
plt.rcParams['font.sans-serif'] = ['SimHei'] # 用来正常显示中文标签# 自定义数据
height = [3, 12, 5, 18, 45]
bars = ('A', 'B', 'C', 'D', 'E')
y_pos = np.arange(len(bars))
x_pos = np.arange(len(bars))# 初始化布局
fig = plt.figure(figsize=(8,8))# 水平方向-水平条形图
plt.subplot(3, 3, 1)
plt.barh(y_pos, height)
plt.yticks(y_pos, bars)
plt.title('水平条形图')# 指定顺序
height_order, bars_order = zip(*sorted(zip(height, bars), reverse=False)) # 自定义顺序plt.subplot(3, 3, 2)
plt.barh(y_pos, height_order)
plt.yticks(y_pos, bars_order)
plt.title('指定顺序')# 自定义颜色
plt.subplot(3, 3, 3)
plt.bar(x_pos, height, color=['black', 'red', 'green', 'blue', 'cyan'])
plt.xticks(x_pos, bars)
plt.title('自定义颜色')# 自定义颜色-边框颜色
plt.subplot(3, 3, 4)
plt.bar(x_pos, height, color=(0.1, 0.1, 0.1, 0.1),  edgecolor='blue')
plt.xticks(x_pos, bars)
plt.title('自定义边框颜色')# 控制距离
width = [0.1,0.2,3,1.5,0.3]
x_pos_width = [0,0.3,2,4.5,5.5]plt.subplot(3, 3, 5)
plt.bar(x_pos_width, height, width=width)
plt.xticks(x_pos_width, bars)
plt.title('控制距离')# 控制宽度
x_pos_space = [0,1,5,8,9]plt.subplot(3, 3, 6)
plt.bar(x_pos_space, height)
plt.xticks(x_pos_space, bars)
plt.title('控制宽度')# 自定义布局
plt.subplot(3, 3, 7)
plt.bar(x_pos, height)
plt.xticks(x_pos, bars, color='orange', rotation=90) # 自定义x刻度名称颜色,自定义旋转
plt.xlabel('category', fontweight='bold', color = 'orange', fontsize='18') # 自定义x标签
plt.yticks(color='orange') # 自定义y刻度名称颜色plt.title('自定义布局')# 添加误差线
err = [val * 0.1 for val in height] # 计算误差(这里假设误差为height的10%)plt.subplot(3, 3, 8)
plt.bar(x_pos, height, yerr=err, alpha=0.5, ecolor='black', capsize=10)
plt.xticks(x_pos, bars)
plt.title('添加误差线')# 增加数值文本信息
plt.subplot(3, 3, 9)
ax = plt.bar(x_pos, height)
for bar in ax:yval = bar.get_height()plt.text(bar.get_x() + bar.get_width()/2.0, yval, int(yval), va='bottom') # va参数代表垂直对齐方式
plt.xticks(x_pos, bars)
plt.title('增加数值文本信息')fig.tight_layout() # 自动调整间距
plt.show()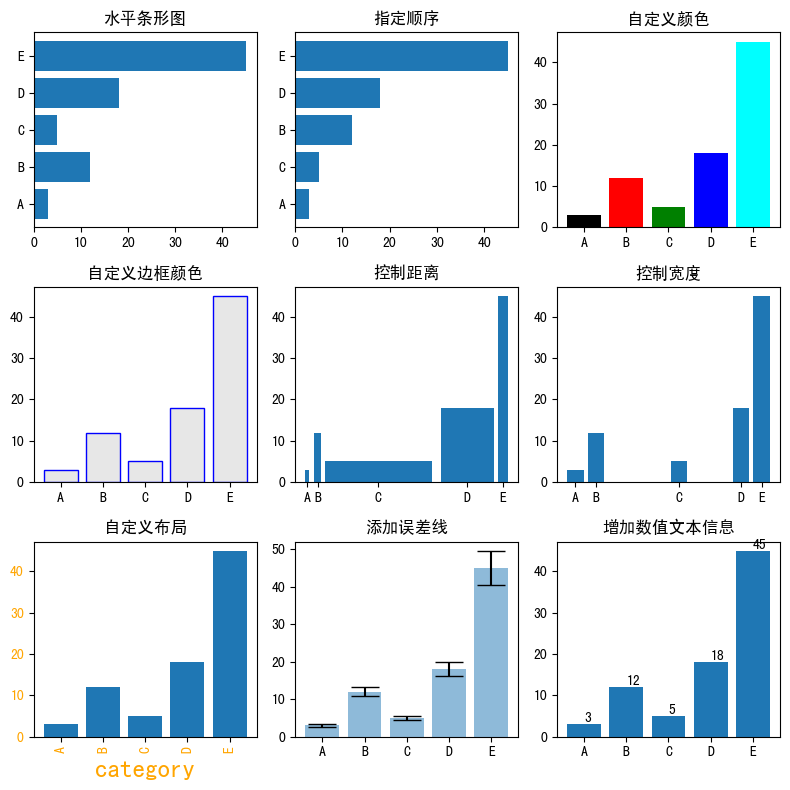
-
分组条形图
import numpy as np
import matplotlib.pyplot as plt# 宽度设置
barWidth = 0.25# 自定义数据
bars1 = [12, 30, 1, 8, 22]
bars2 = [28, 6, 16, 5, 10]
bars3 = [29, 3, 24, 25, 17]# x位置
r1 = np.arange(len(bars1))
r2 = [x + barWidth for x in r1]
r3 = [x + barWidth for x in r2]# 绘制分组条形图
plt.bar(r1, bars1, color='#7f6d5f', width=barWidth, edgecolor='white', label='g1')
plt.bar(r2, bars2, color='#557f2d', width=barWidth, edgecolor='white', label='g2')
plt.bar(r3, bars3, color='#2d7f5e', width=barWidth, edgecolor='white', label='g3')# 轴标签、图例
plt.xlabel('group', fontweight='bold')
plt.xticks([r + barWidth for r in range(len(bars1))], ['A', 'B', 'C', 'D', 'E'])
plt.legend()plt.show()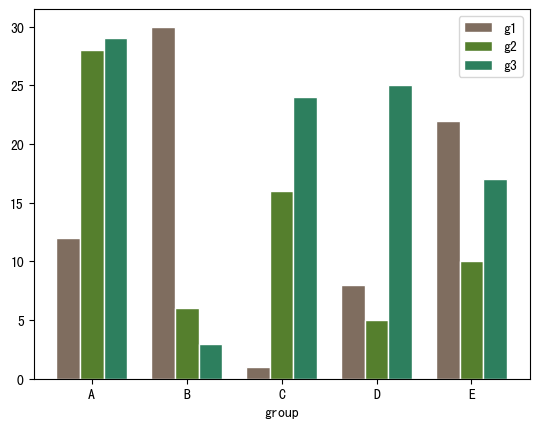
-
数量堆积条形图
import numpy as np
import matplotlib.pyplot as plt
import pandas as pd# 自定义数据
bars1 = [12, 28, 1, 8, 22]
bars2 = [28, 7, 16, 4, 10]
bars3 = [25, 3, 23, 25, 17]# bars1 + bars2的高度
bars = np.add(bars1, bars2).tolist()# x位置
r = [0,1,2,3,4]# bar名称、宽度
names = ['A','B','C','D','E']
barWidth = 1# 底部bar
plt.bar(r, bars1, color='#7f6d5f', edgecolor='white', width=barWidth, label="g1")
# 中间bar
plt.bar(r, bars2, bottom=bars1, color='#557f2d', edgecolor='white', width=barWidth, label="g2")
# 顶部bar
plt.bar(r, bars3, bottom=bars, color='#2d7f5e', edgecolor='white', width=barWidth, label="g3")# x轴设置、图例
plt.xticks(r, names, fontweight='bold')
plt.xlabel("group")
plt.legend()plt.show()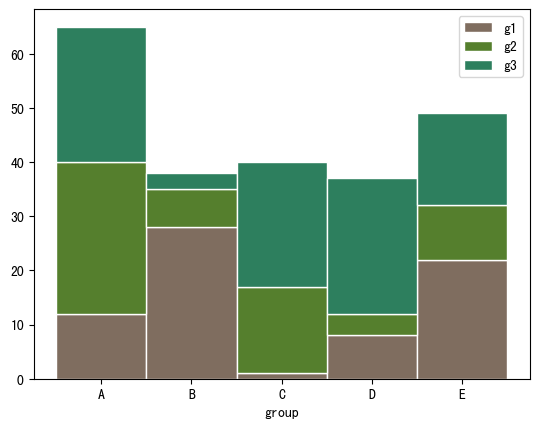
-
百分比堆积条形图
import numpy as np
import matplotlib.pyplot as plt
import pandas as pd# 自定义数据
r = [0,1,2,3,4] # x位置
raw_data = {'greenBars': [20, 1.5, 7, 10, 5], 'orangeBars': [5, 15, 5, 10, 15],'blueBars': [2, 15, 18, 5, 10]}
df = pd.DataFrame(raw_data)# 转为百分比
totals = [i+j+k for i,j,k in zip(df['greenBars'], df['orangeBars'], df['blueBars'])]
greenBars = [i / j * 100 for i,j in zip(df['greenBars'], totals)]
orangeBars = [i / j * 100 for i,j in zip(df['orangeBars'], totals)]
blueBars = [i / j * 100 for i,j in zip(df['blueBars'], totals)]# bar名称、宽度
barWidth = 0.85
names = ('A','B','C','D','E')# 底部bar
plt.bar(r, greenBars, color='#b5ffb9', edgecolor='white', width=barWidth, label="g1")
# 中间bar
plt.bar(r, orangeBars, bottom=greenBars, color='#f9bc86', edgecolor='white', width=barWidth, label="g2")
# 顶部bar
plt.bar(r, blueBars, bottom=[i+j for i,j in zip(greenBars, orangeBars)], color='#a3acff', edgecolor='white', width=barWidth, label="g3")# x轴、图例
plt.xticks(r, names)
plt.xlabel("group")
plt.legend()plt.show()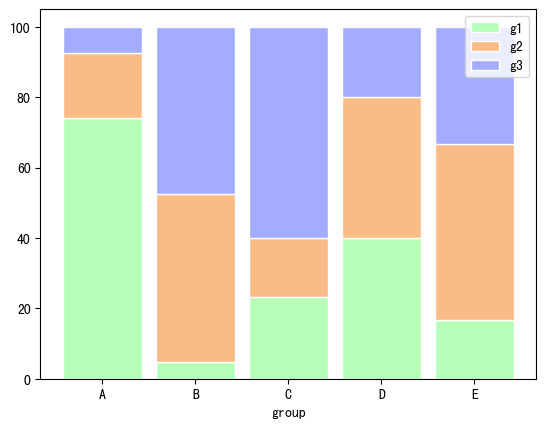
通过pandas绘制多样化的条形图
pandas主要利用barh绘制条形图,可以通过pandas.DataFrame.plot.barh了解更多用法
-
修改参数
import matplotlib as mpl
import matplotlib.pyplot as plt
import numpy as np
import pandas as pdplt.rcParams['font.sans-serif'] = ['SimHei'] # 用来正常显示中文标签# 自定义数据
category = ['Group1']*30 + ['Group2']*50 + ['Group3']*20
df = pd.DataFrame({'category': category})
values = df['category'].value_counts()# 初始化布局
fig = plt.figure(figsize=(8,4))# 水平方向-水平条形图
plt.subplot(1, 2, 1)
values.plot.barh(grid=True)
plt.title('水平条形图')# 自定义顺序、颜色
# 指定顺序
desired_order = ['Group1', 'Group2', 'Group3']
values_order = values.reindex(desired_order)
# 指定颜色
colors = ['#69b3a2', '#cb1dd1', 'palegreen']plt.subplot(1, 2, 2)
values.plot.bar(color=colors,grid=True, )
plt.title('自定义顺序、颜色')fig.tight_layout() # 自动调整间距
plt.show()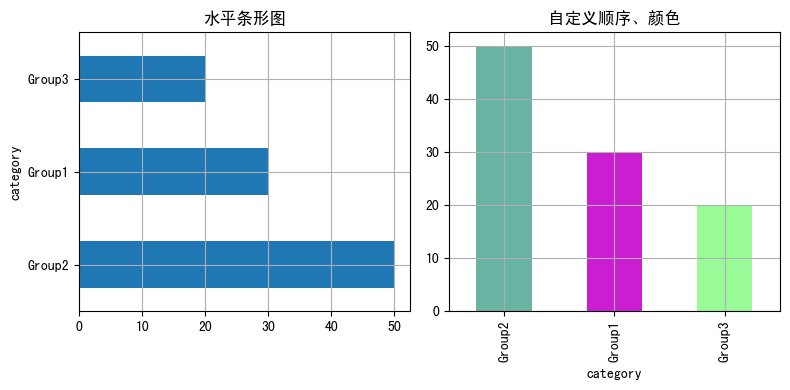
-
分组条形图
import pandas as pd
import matplotlib.pyplot as plt# 自定义数据
data = {"Product": ["Product A", "Product A", "Product A", "Product B", "Product B", "Product B"],"Segment": ["Segment 1", "Segment 2", "Segment 3", "Segment 1", "Segment 2", "Segment 3"],"Amount_sold": [100, 120, 120, 80, 160, 150]
}df = pd.DataFrame(data)
pivot_df = df.pivot(index='Segment',columns='Product',values='Amount_sold')# 分组条形图
pivot_df.plot.bar(grid=True)plt.show()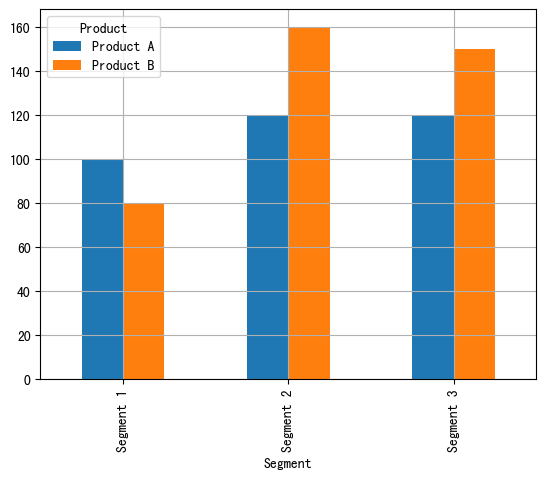
-
数量堆积条形图
import pandas as pd
import matplotlib.pyplot as plt# 自定义数据
data = {"Product": ["Product A", "Product A", "Product A", "Product B", "Product B", "Product B"],"Segment": ["Segment 1", "Segment 2", "Segment 3", "Segment 1", "Segment 2", "Segment 3"],"Amount_sold": [100, 120, 120, 80, 160, 150]
}df = pd.DataFrame(data)
pivot_df = df.pivot(index='Segment',columns='Product',values='Amount_sold')# 堆积条形图
pivot_df.plot.bar(stacked=True,grid=True)plt.show()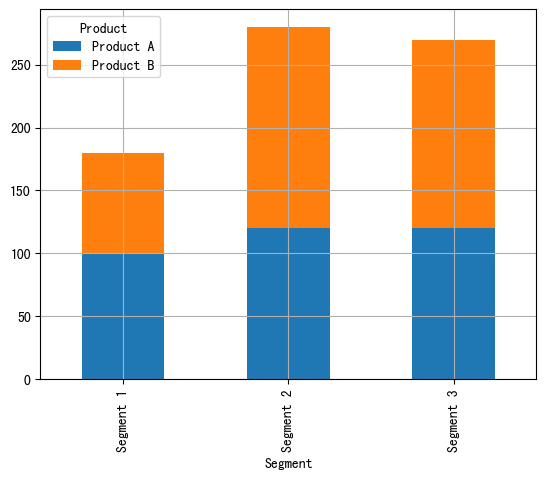
-
百分比堆积条形图
import pandas as pd
import matplotlib.pyplot as plt# 自定义数据
data = {"Product": ["Product A", "Product A", "Product A", "Product B", "Product B", "Product B"],"Segment": ["Segment 1", "Segment 2", "Segment 3", "Segment 1", "Segment 2", "Segment 3"],"Amount_sold": [100, 120, 120, 80, 160, 150]
}df = pd.DataFrame(data)
pivot_df = df.pivot(index='Segment',columns='Product',values='Amount_sold')
pivot_df_percentage = pivot_df.div(pivot_df.sum(axis=1), axis=0) * 100# 百分比堆积条形图
pivot_df_percentage.plot.bar(stacked=True,grid=True)# 图例
plt.legend(bbox_to_anchor=(1.04, 1),loc='upper left')
plt.show()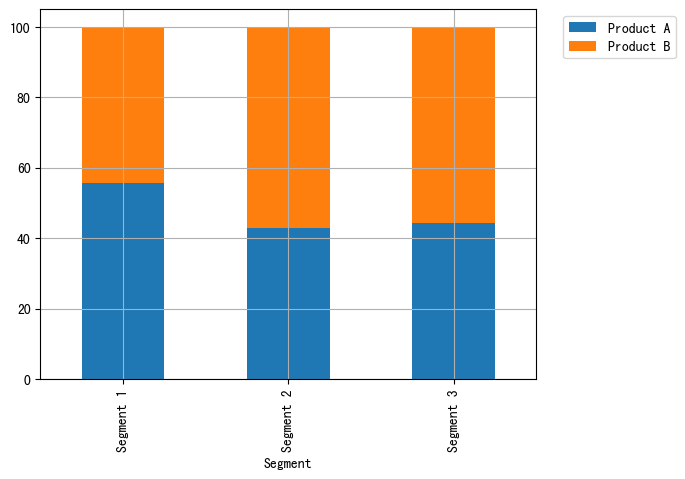
总结
以上通过seaborn的barplot、matplotlib的bar和pandas的bar快速绘制条形图,并通过修改参数或者辅以其他绘图知识自定义各种各样的条形图来适应相关使用场景。
共勉~
相关文章:

比较(一)利用python绘制条形图
比较(一)利用python绘制条形图 条形图(Barplot)简介 条形图主要用来比较不同类别间的数据差异,一条轴表示类别,另一条则表示对应的数值度量。 快速绘制 基于seaborn import seaborn as sns import matplo…...

【面试】Oracle JDK和Open JDK什么关系?
目录 1. 起源与发展2. 代码与许可3. 功能与组件4. 使用场景5. 版本更新与支持 1. 起源与发展 1.Oracle JDK是由Oracle公司基于Open JDK源代码开发的商业版本。2.Open JDK是java语言的一个开源实现。 2. 代码与许可 1.Oracle JDK包含了闭源组件,并根据二进制代码许…...

科学技术创新杂志科学技术创新杂志社科学技术创新编辑部2024年第10期目录
科技创新 单桩穿越岩溶发育地层力学特征与溶洞处置措施研究 刘飞; 1-7《科学技术创新》投稿:cnqikantg126.com 基于多目标优化的中低压配电网电力规划研究 向星山;杨承俊;张寒月; 8-11 激光雷达测绘技术在工程测绘中的应用研究 张军伟;闫宏昌; 12-15 …...

ES数据导出成csv文件
推荐使用es2csv 工具。 命令行实用程序,用Python编写,用于用Lucene查询语法或查询DSL语法查询Elasticsearch,并将结果作为文档导出到CSV文件中。该工具可以在多个索引中查询批量文档,并且只获取选定的字段,这减少了查…...

结构型设计模式之装饰模式
文章目录 概述装饰模式原理代码案例小结 概述 装饰模式(decorator pattern) 的原始定义是:动态的给一个对象添加一些额外的职责. 就扩展功能而言,装饰器模式提供了一种比使用子类更加灵活的替代方案。 装饰模式原理 装饰模式中的角色: 抽象构件角色 …...

Java - 当年很流行,现在已经淘汰的 Java 技术,请不要在继续学了!!!
最近这段时间收到了一些读者的私信,问我某个技术要不要学,还有一些在国外的同学竟然对 Java 图形化很感兴趣,还想找这方面的工作。 比较忙,一直没抽出时间去回答这类问题,刚好看到我关注的一位大佬回答过,这…...

驻波比VSWR
最近看大家写的VSWR文章,发现有很多误解, 1)错误解释是入射波和反射波叠加的驻波的波峰/波谷。大家可以向下驻波也是正弦波,波峰和波谷的值不都是振幅吗?因此相当于VSWR恒等于1了。 2)VSWR越小越好; 正确…...

多线程-线程池
为什么要使用线程池 在Java中使用线程池的主要原因有以下几点: 提高性能:使用线程池可以减少线程的创建和销毁过程的开销。线程的创建和销毁是比较昂贵的操作,如果每次需要执行任务时都创建一个新线程,会造成系统资源的浪费。而线…...

护网期间遇到的几个上传bypass waf、edr
1. weblogic部署war的时候 http/1.1 改成http/2绕过waf 其实jar和ear部署应该也可以,但是我没成功。 weblogoic 部署war死活出错,用linux下的浏览器 linux下打包war马 zip -r zipjob4.zip job/ mv zipjob3.zip zipjob3.war 然后部署成功之后&am…...

简述MVC模式
这里为什么讲MVC模式,是因为在学习的过程中,很多人不知怎的,将观察者模式和MVC混为一谈。MVC模式最开始出现在WEB开发中,该模式能够很好的做到软件模块的高内聚,低耦合,所以其思想逐渐在各个软件开发领域都…...
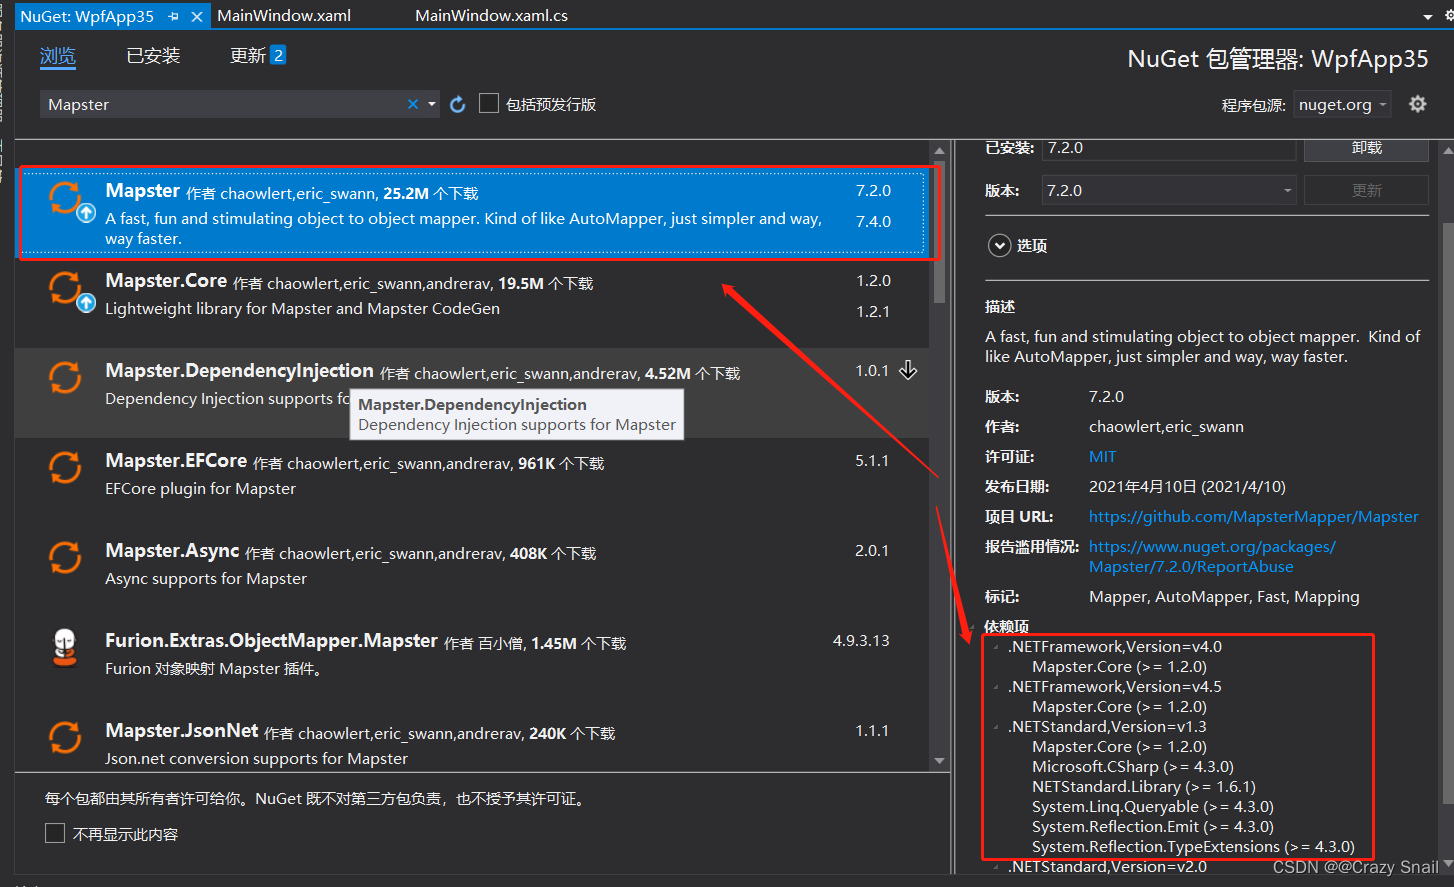
C#--Mapster(高性能映射)用法
1.Nuget安装Mapster包引用 2.界面XAML部分 <Window x:Class"WpfApp35.MainWindow"xmlns"http://schemas.microsoft.com/winfx/2006/xaml/presentation"xmlns:x"http://schemas.microsoft.com/winfx/2006/xaml"xmlns:d"http://schemas.m…...
mysql实战——Mysql8.0高可用之双主+keepalived
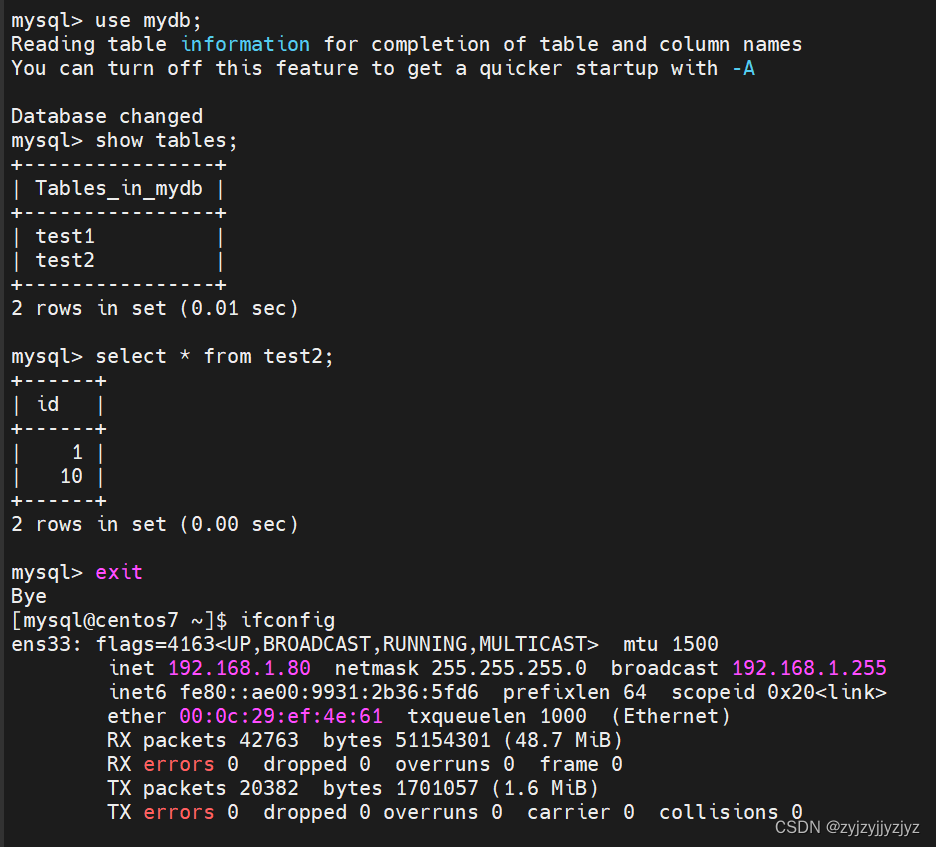
一、介绍 利用keepalived实现Mysql数据库的高可用,KeepalivedMysql双主来实现MYSQL-HA,两台Mysql数据库的数据保持完全一致,实现方法是两台Mysql互为主从关系,通过keepalived配置VIP,实现当其中的一台Mysql数据库宕机…...

关于同一个地址用作两个不同页面时,列表操作栏按钮混淆状态
同一个地址用作两个不同页面时,列表页的操作栏中有好多个按钮,如果用了v-if,可能会导致按钮混淆状态如disabled等属性混乱 解决方法1: 将v-if换成v-show,用了v-show之后意味着所有按钮都在只是在页面上隐藏了 解决方…...
解析)
Oracle段延迟分配(Deferred Segment Creation)解析
目录 一、基本概念二、工作原理三、优势四、潜在风险与注意事项五、配置与管理 Oracle段延迟分配(Deferred Segment Creation)是Oracle 11g引入的一项重要特性,旨在优化资源使用和提高数据库管理效率。 一、基本概念 段延迟分配意味着当创建…...
Linux:IPC - System V
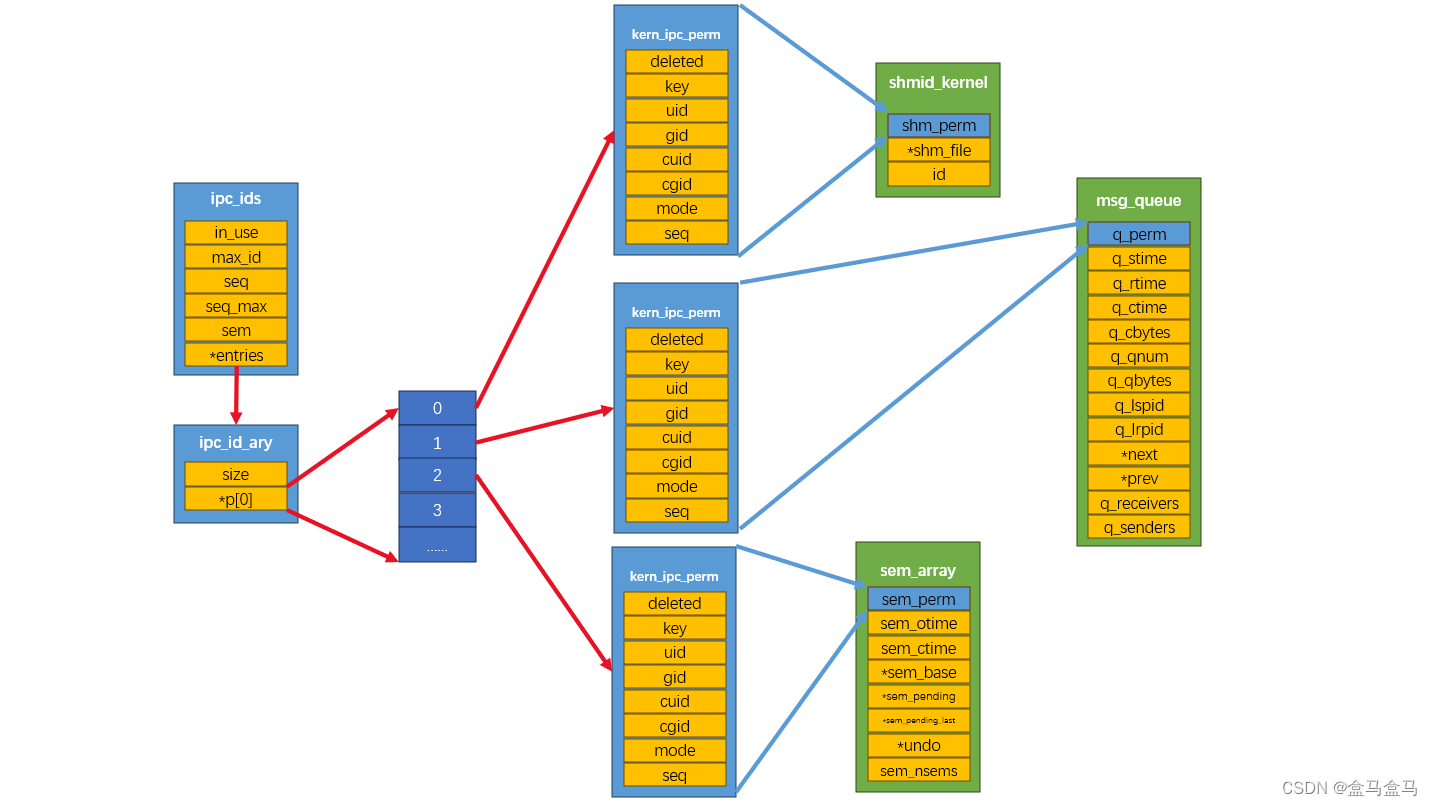
Linux:IPC - System V 共享内存 shm创建共享内存shmgetshmctlftok 挂接共享内存shmatshmdt shm特性 消息队列 msgmsggetmsgctlmsgsndmsgrcv 信号量 semSystem V 管理机制 System V IPC 是Linux系统中一种重要的进程间通信机制,它主要包括共享内存 shm&am…...
Laravel 图片添加水印
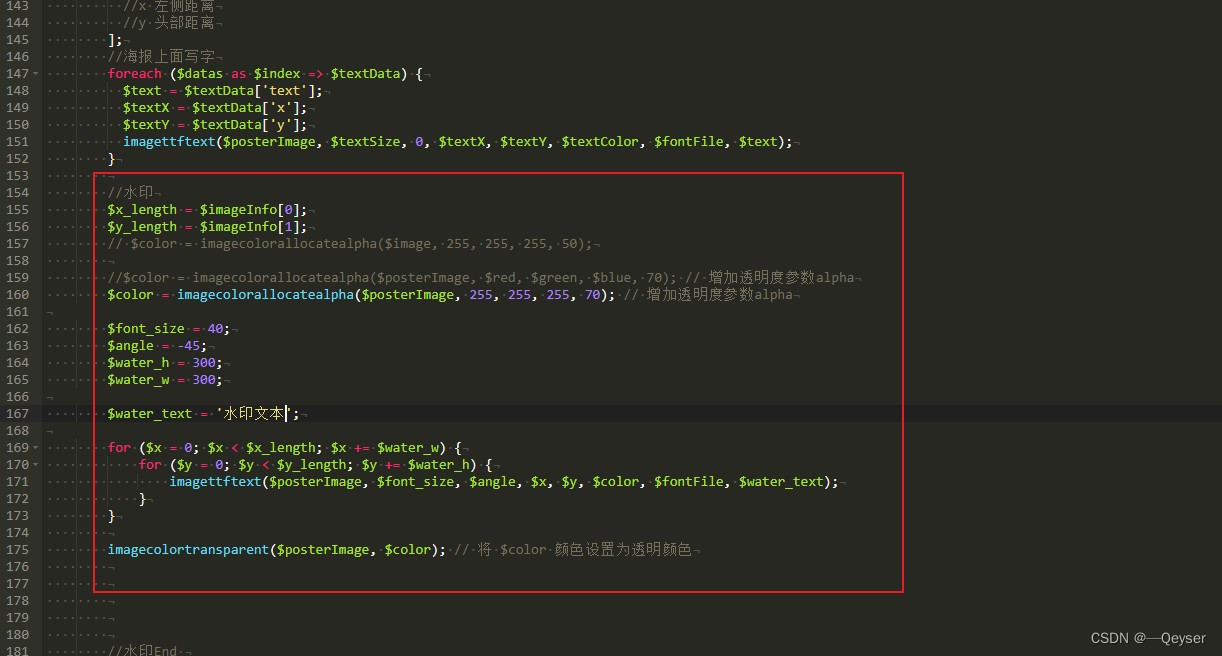
和这个配合使用 Laravel ThinkPhP 海报生成_laravel 制作海报-CSDN博客 代码 //水印 $x_length $imageInfo[0]; $y_length $imageInfo[1];$color imagecolorallocatealpha($posterImage, 255, 255, 255, 70); // 增加透明度参数alpha$font_size 40; //字体大小 $angle …...
嵌入式进阶——矩阵键盘
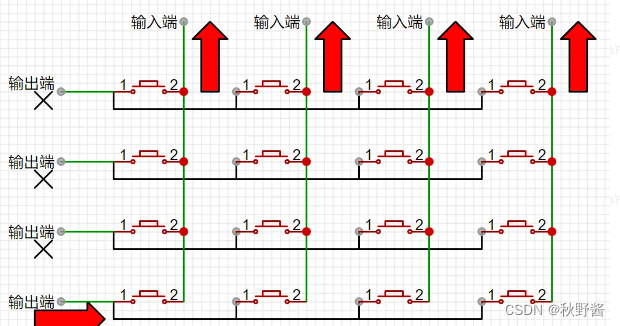
🎬 秋野酱:《个人主页》 🔥 个人专栏:《Java专栏》《Python专栏》 ⛺️心若有所向往,何惧道阻且长 文章目录 矩阵按键原理图按键状态检测单行按键状态检测多行按键状态检测 状态记录状态优化循环优化 矩阵按键 矩阵键盘是一种常见的数字输入…...

请说出vue.cli项目中src目录每个文件夹和文件的用法
在Vue CLI项目中,src目录是存放项目源码及需要引用的资源文件的主要位置。以下是src目录下常见文件夹和文件的用法: components 用途:存放可重用的Vue组件。这些组件通常用于在多个页面或布局中共享UI和功能。特点:组件应该是模块…...
)
【MySQL精通之路】InnoDB磁盘I/O和文件空间管理(11)
主博客: 【MySQL精通之路】InnoDB存储引擎-CSDN博客 目录 1.InnoDB磁盘I/O 1.1 预读 1.2 双写缓冲区 2.文件空间管理 2.1 Pages, Extents, Segments, and Tablespaces(很重要) 2.2 配置保留文件段页面的百分比 2.3 页与表行的关系 …...
基于springboot+html的二手交易平台(附源码)
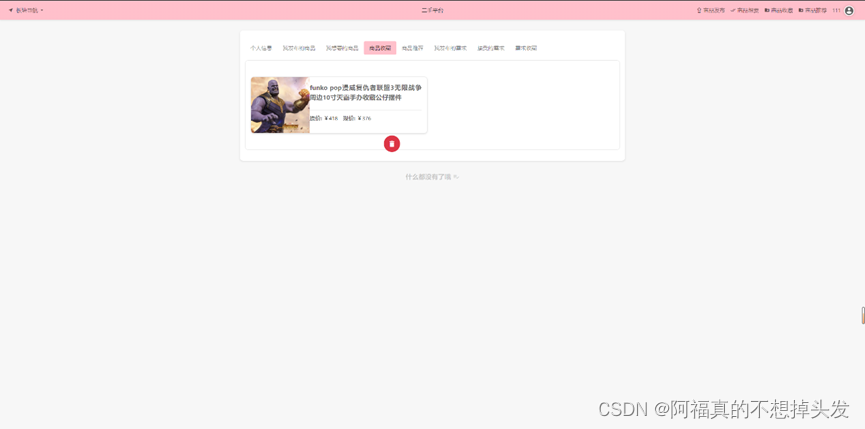
基于springboothtml的二手交易平台 介绍部分界面截图如下联系我 介绍 本系统是基于springboothtml的二手交易平台,数据库为mysql,可用于毕设或学习,附数据库 部分界面截图如下 联系我 VX:Zzllh_...

synchronized 学习
学习源: https://www.bilibili.com/video/BV1aJ411V763?spm_id_from333.788.videopod.episodes&vd_source32e1c41a9370911ab06d12fbc36c4ebc 1.应用场景 不超卖,也要考虑性能问题(场景) 2.常见面试问题: sync出…...
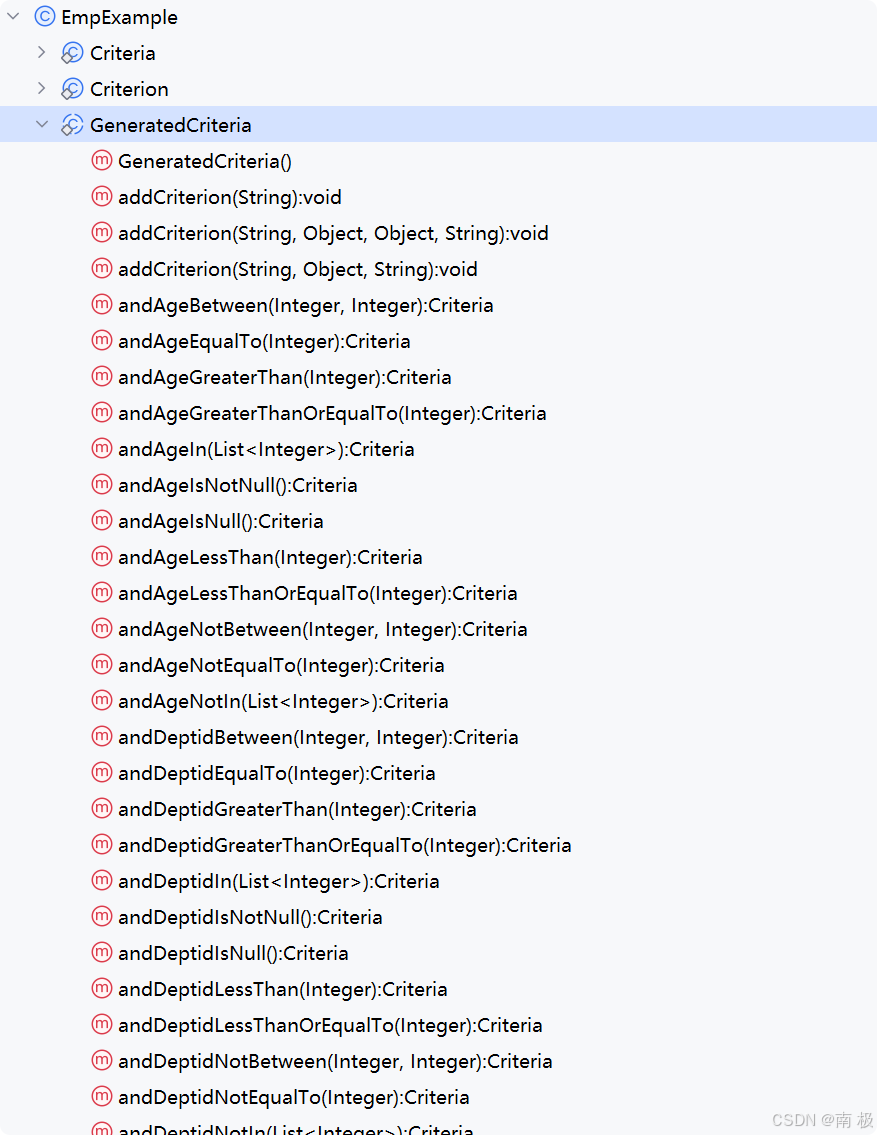
Mybatis逆向工程,动态创建实体类、条件扩展类、Mapper接口、Mapper.xml映射文件
今天呢,博主的学习进度也是步入了Java Mybatis 框架,目前正在逐步杨帆旗航。 那么接下来就给大家出一期有关 Mybatis 逆向工程的教学,希望能对大家有所帮助,也特别欢迎大家指点不足之处,小生很乐意接受正确的建议&…...

unix/linux,sudo,其发展历程详细时间线、由来、历史背景
sudo 的诞生和演化,本身就是一部 Unix/Linux 系统管理哲学变迁的微缩史。来,让我们拨开时间的迷雾,一同探寻 sudo 那波澜壮阔(也颇为实用主义)的发展历程。 历史背景:su的时代与困境 ( 20 世纪 70 年代 - 80 年代初) 在 sudo 出现之前,Unix 系统管理员和需要特权操作的…...

JavaScript 数据类型详解
JavaScript 数据类型详解 JavaScript 数据类型分为 原始类型(Primitive) 和 对象类型(Object) 两大类,共 8 种(ES11): 一、原始类型(7种) 1. undefined 定…...

Git常用命令完全指南:从入门到精通
Git常用命令完全指南:从入门到精通 一、基础配置命令 1. 用户信息配置 # 设置全局用户名 git config --global user.name "你的名字"# 设置全局邮箱 git config --global user.email "你的邮箱example.com"# 查看所有配置 git config --list…...

Spring Security 认证流程——补充
一、认证流程概述 Spring Security 的认证流程基于 过滤器链(Filter Chain),核心组件包括 UsernamePasswordAuthenticationFilter、AuthenticationManager、UserDetailsService 等。整个流程可分为以下步骤: 用户提交登录请求拦…...
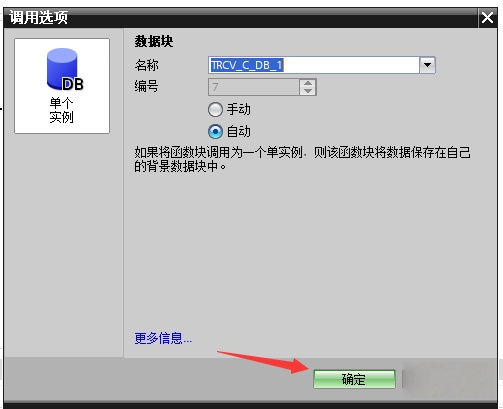
协议转换利器,profinet转ethercat网关的两大派系,各有千秋
随着工业以太网的发展,其高效、便捷、协议开放、易于冗余等诸多优点,被越来越多的工业现场所采用。西门子SIMATIC S7-1200/1500系列PLC集成有Profinet接口,具有实时性、开放性,使用TCP/IP和IT标准,符合基于工业以太网的…...
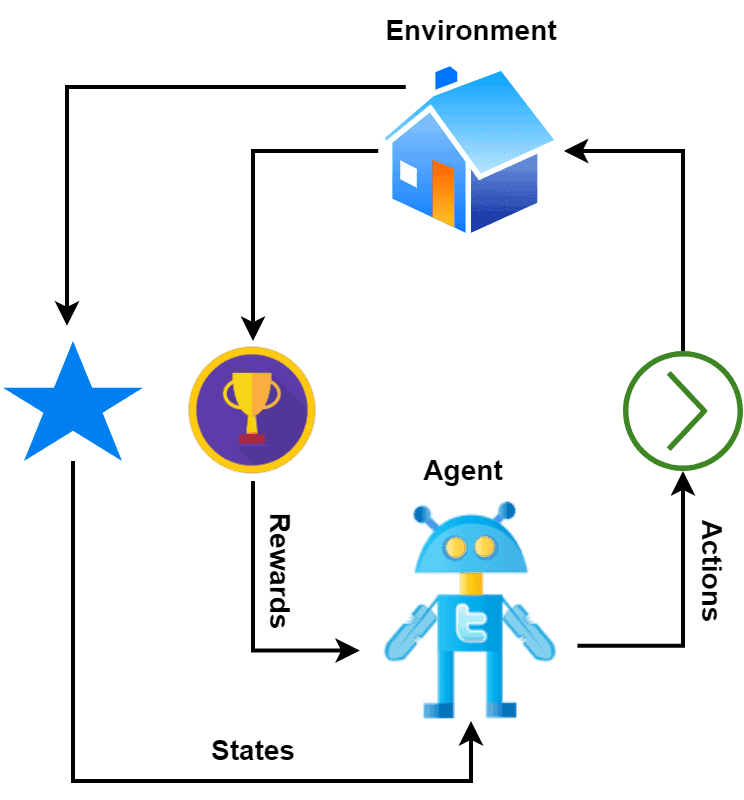
【深度学习新浪潮】什么是credit assignment problem?
Credit Assignment Problem(信用分配问题) 是机器学习,尤其是强化学习(RL)中的核心挑战之一,指的是如何将最终的奖励或惩罚准确地分配给导致该结果的各个中间动作或决策。在序列决策任务中,智能体执行一系列动作后获得一个最终奖励,但每个动作对最终结果的贡献程度往往…...

前端高频面试题2:浏览器/计算机网络
本专栏相关链接 前端高频面试题1:HTML/CSS 前端高频面试题2:浏览器/计算机网络 前端高频面试题3:JavaScript 1.什么是强缓存、协商缓存? 强缓存: 当浏览器请求资源时,首先检查本地缓存是否命中。如果命…...
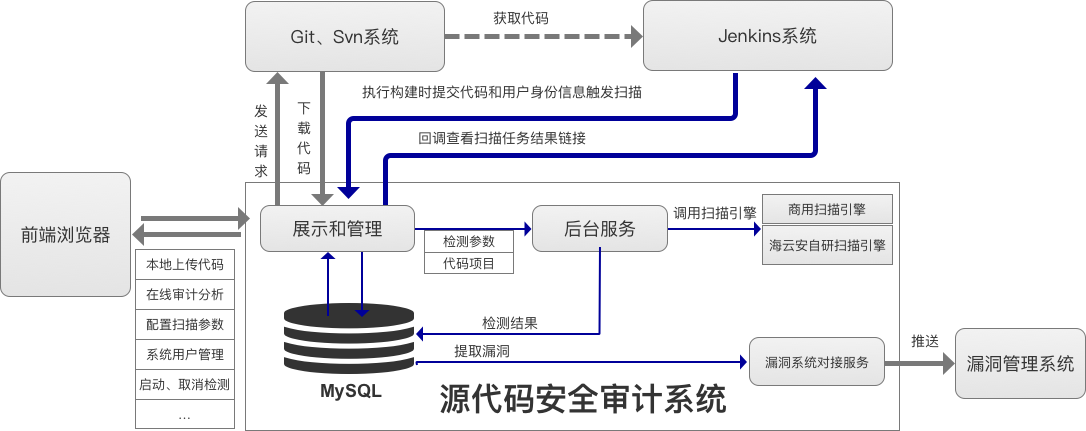
海云安高敏捷信创白盒SCAP入选《中国网络安全细分领域产品名录》
近日,嘶吼安全产业研究院发布《中国网络安全细分领域产品名录》,海云安高敏捷信创白盒(SCAP)成功入选软件供应链安全领域产品名录。 在数字化转型加速的今天,网络安全已成为企业生存与发展的核心基石,为了解…...
