GEE数据集——ERA5-陆地每日汇总--ECMWF气候再分析数据集
目录
简介
数据集说明
Dataset Availability
Dataset Provider
Collection Snippet
空间信息
Resolution
Bands Table
变量
代码
代码链接
结果
引用
许可
网址推荐
0代码在线构建地图应用
机器学习
简介
注(2024-04-19): 由于哥白尼气候数据存储的现代化工作受到影响,ECMWF 数据集的生产可能会中断。 提供商未说明计划完成日期,详情请参见用户论坛。 ERA5-陆地是一个再分析数据集,以比ERA5更高的分辨率提供了几十年陆地变量演变的一致视图。 ERA5-陆地是通过重放 ECMWF ERA5 气候再分析的陆地部分而生成的。 再分析利用物理定律将模式数据与世界各地的观测数据相结合,形成一个全球完整一致的数据集。 再分析产生的数据可追溯到几十年前,能准确描述过去的气候。 该数据集包括 CDS 上提供的全部 50 个变量,是 ECMWF ERA5 陆地小时数据的每日总和,包括流动带和非流动带。 流量带是通过收集次日第一小时的数据形成的,其中包含前一天的总和,而非流量带则是通过平均当天所有小时数据形成的。 流量带用"_sum "标识符标注,这种方法与哥白尼气候数据存储库生成的日数据不同,后者也对流量带进行平均。 日总量已预先计算,以方便许多需要方便快捷地访问数据的应用。
ERA5-陆地每日汇总数据可提供从 1950 年到三个月的实时数据。 更多信息,请访问哥白尼气候数据商店。 降水量和其他流量(累积)带偶尔会出现负值,这在物理上是不合理的。 这个问题是由于 GRIB 格式保存数据的方式造成的:它将数据简化或 "打包 "成更小、更不精确的数字,这可能会带来误差。 当数据变化很大时,这些误差就会变得更严重。 正因为如此,当我们查看一整天的数据来计算日降雨总量时,有时某一次记录的最高降雨量可能会比全天测得的总降雨量要大。 要了解更多信息,请参阅: "为什么有时会出现小的负累积降水量?Climate Data Store
数据集说明
Dataset Availability
1950-01-02T00:00:00 -
Dataset Provider
Daily Aggregates: Google and Copernicus Climate Data Store
Collection Snippet
Copied
ee.ImageCollection("ECMWF/ERA5_LAND/DAILY_AGGR")
空间信息
Resolution
11132 meters
Bands Table
| Name | Description | Units |
|---|---|---|
| dewpoint_temperature_2m | Temperature to which the air, at 2 meters above the surface of the Earth, would have to be cooled for saturation to occur. It is a measure of the humidity of the air. Combined with temperature and pressure, it can be used to calculate the relative humidity. 2m dew point temperature is calculated by interpolating between the lowest model level and the Earth's surface, taking account of the atmospheric conditions. | K |
| temperature_2m | Temperature of air at 2m above the surface of land, sea or in-land waters. 2m temperature is calculated by interpolating between the lowest model level and the Earth's surface, taking account of the atmospheric conditions. | K |
| skin_temperature | Temperature of the surface of the Earth. The skin temperature is the theoretical temperature that is required to satisfy the surface energy balance. It represents the temperature of the uppermost surface layer, which has no heat capacity and so can respond instantaneously to changes in surface fluxes. Skin temperature is calculated differently over land and sea. | K |
| soil_temperature_level_1 | Temperature of the soil in layer 1 (0 - 7 cm) of the ECMWF Integrated Forecasting System. The surface is at 0 cm. Soil temperature is set at the middle of each layer, and heat transfer is calculated at the interfaces between them. It is assumed that there is no heat transfer out of the bottom of the lowest layer. | K |
| soil_temperature_level_2 | Temperature of the soil in layer 2 (7-28 cm) of the ECMWF Integrated Forecasting System. | K |
| soil_temperature_level_3 | Temperature of the soil in layer 3 (28-100 cm) of the ECMWF Integrated Forecasting System. | K |
| soil_temperature_level_4 | Temperature of the soil in layer 4 (100-289 cm) of the ECMWF Integrated Forecasting System. | K |
| lake_bottom_temperature | Temperature of water at the bottom of inland water bodies (lakes, reservoirs, rivers) and coastal waters. ECMWF implemented a lake model in May 2015 to represent the water temperature and lake ice of all the world's major inland water bodies in the Integrated Forecasting System. The model keeps lake depth and surface area (or fractional cover) constant in time. | K |
| lake_ice_depth | The thickness of ice on inland water bodies (lakes, reservoirs and rivers) and coastal waters. The ECMWF Integrated Forecasting System (IFS) represents the formation and melting of ice on inland water bodies (lakes, reservoirs and rivers) and coastal water. A single ice layer is represented. This parameter is the thickness of that ice layer. | m |
| lake_ice_temperature | The temperature of the uppermost surface of ice on inland water bodies (lakes, reservoirs, rivers) and coastal waters. The ECMWF Integrated Forecasting System represents the formation and melting of ice on lakes. A single ice layer is represented. | K |
| lake_mix_layer_depth | The thickness of the upper most layer of an inland water body (lake, reservoirs, and rivers) or coastal waters that is well mixed and has a near constant temperature with depth (uniform distribution of temperature). The ECMWF Integrated Forecasting System represents inland water bodies with two layers in the vertical, the mixed layer above and the thermocline below. Thermoclines upper boundary is located at the mixed layer bottom, and the lower boundary at the lake bottom. Mixing within the mixed layer can occur when the density of the surface (and near-surface) water is greater than that of the water below. Mixing can also occur through the action of wind on the surface of the lake. | m |
| lake_mix_layer_temperature | The temperature of the upper most layer of inland water bodies (lakes, reservoirs and rivers) or coastal waters) that is well mixed. The ECMWF Integrated Forecasting System represents inland water bodies with two layers in the vertical, the mixed layer above and the thermocline below. Thermoclines upper boundary is located at the mixed layer bottom, and the lower boundary at the lake bottom. Mixing within the mixed layer can occur when the density of the surface (and near-surface) water is greater than that of the water below. Mixing can also occur through the action of wind on the surface of the lake. | K |
| lake_shape_factor | This parameter describes the way that temperature changes with depth in the thermocline layer of inland water bodies (lakes, reservoirs and rivers) and coastal waters. It is used to calculate the lake bottom temperature and other lake-related parameters. The ECMWF Integrated Forecasting System represents inland and coastal water bodies with two layers in the vertical, the mixed layer above and the thermocline below where temperature changes with depth. | |
| lake_total_layer_temperature | The mean temperature of total water column in inland water bodies (lakes, reservoirs and rivers) and coastal waters. The ECMWF Integrated Forecasting System represents inland water bodies with two layers in the vertical, the mixed layer above and the thermocline below where temperature changes with depth. This parameter is the mean over the two layers. | K |
| snow_albedo | It is defined as the fraction of solar (shortwave) radiation reflected by the snow, across the solar spectrum, for both direct and diffuse radiation. It is a measure of the reflectivity of the snow covered grid cells. Values vary between 0 and 1. Typically, snow and ice have high reflectivity with albedo values of 0.8 and above. | |
| snow_cover | It represents the fraction (0-1) of the cell / grid-box occupied by snow (similar to the cloud cover fields of ERA5). | % |
| snow_density | Mass of snow per cubic meter in the snow layer. The ECMWF Integrated Forecast System (IFS) model represents snow as a single additional layer over the uppermost soil level. The snow may cover all or part of the grid box. | kg/m^3 |
| snow_depth | Instantaneous grib-box average of the snow thickness on the ground (excluding snow on canopy). | m |
| snow_depth_water_equivalent | Depth of snow from the snow-covered area of a grid box. Its units are meters of water equivalent, so it is the depth the water would have if the snow melted and was spread evenly over the whole grid box. The ECMWF Integrated Forecast System represents snow as a single additional layer over the uppermost soil level. The snow may cover all or part of the grid box. | m of water equivalent |
| snowfall_sum | Accumulated total snow that has fallen to the Earth's surface. It consists of snow due to the large-scale atmospheric flow (horizontal scales greater than around a few hundred meters) and convection where smaller scale areas (around 5km to a few hundred kilometers) of warm air rise. If snow has melted during the period over which this variable was accumulated, then it will be higher than the snow depth. This variable is the total amount of water accumulated from the beginning of the forecast time to the end of the forecast step. The units given measure the depth the water would have if the snow melted and was spread evenly over the grid box. Care should be taken when comparing model variables with observations, because observations are often local to a particular point in space and time, rather than representing averages over a model grid box and model time step. | m of water equivalent |
| snowmelt_sum | Melting of snow averaged over the grid box (to find melt over snow, divide by snow fraction). This variable is accumulated from the beginning of the forecast time to the end of the forecast step. | m of water equivalent |
| temperature_of_snow_layer | This variable gives the temperature of the snow layer from the ground to the snow-air interface. The ECMWF Integrated Forecast System (IFS) model represents snow as a single additional layer over the uppermost soil level. The snow may cover all or part of the grid box. | K |
| skin_reservoir_content | Amount of water in the vegetation canopy and/or in a thin layer on the soil. It represents the amount of rain intercepted by foliage, and water from dew. The maximum amount of 'skin reservoir content' a grid box can hold depends on the type of vegetation, and may be zero. Water leaves the 'skin reservoir' by evaporation. | m of water equivalent |
| volumetric_soil_water_layer_1 | Volume of water in soil layer 1 (0 - 7 cm) of the ECMWF Integrated Forecasting System. The surface is at 0 cm. The volumetric soil water is associated with the soil texture (or classification), soil depth, and the underlying groundwater level. | Volume fraction |
| volumetric_soil_water_layer_2 | Volume of water in soil layer 2 (7 -28 cm) of the ECMWF Integrated Forecasting System. | Volume fraction |
| volumetric_soil_water_layer_3 | Volume of water in soil layer 3 (28-100 cm) of the ECMWF Integrated Forecasting System. | Volume fraction |
| volumetric_soil_water_layer_4 | Volume of water in soil layer 4 (100-289 cm) of the ECMWF Integrated Forecasting System. | Volume fraction |
| forecast_albedo | Is a measure of the reflectivity of the Earth's surface. It is the fraction of solar (shortwave) radiation reflected by Earth's surface, across the solar spectrum, for both direct and diffuse radiation. Values are between 0 and 1. Typically, snow and ice have high reflectivity with albedo values of 0.8 and above, land has intermediate values between about 0.1 and 0.4 and the ocean has low values of 0.1 or less. Radiation from the Sun (solar, or shortwave, radiation) is partly reflected back to space by clouds and particles in the atmosphere (aerosols) and some of it is absorbed. The rest is incident on the Earth's surface, where some of it is reflected. The portion that is reflected by the Earth's surface depends on the albedo. In the ECMWF Integrated Forecasting System (IFS), a climatological background albedo (observed values averaged over a period of several years) is used, modified by the model over water, ice and snow. Albedo is often shown as a percentage (%). | |
| surface_latent_heat_flux_sum | Exchange of latent heat with the surface through turbulent diffusion. This variables is accumulated from the beginning of the forecast time to the end of the forecast step. By model convention, downward fluxes are positive. | J/m^2 |
| surface_net_solar_radiation_sum | Amount of solar radiation (also known as shortwave radiation) reaching the surface of the Earth (both direct and diffuse) minus the amount reflected by the Earth's surface (which is governed by the albedo). Radiation from the Sun (solar, or shortwave, radiation) is partly reflected back to space by clouds and particles in the atmosphere (aerosols) and some of it is absorbed. The rest is incident on the Earth's surface, where some of it is reflected. The difference between downward and reflected solar radiation is the surface net solar radiation. This variable is accumulated from the beginning of the forecast time to the end of the forecast step. The units are joules per square meter (J m-2). To convert to watts per square meter (W m-2), the accumulated values should be divided by the accumulation period expressed in seconds. The ECMWF convention for vertical fluxes is positive downwards. | J/m^2 |
| surface_net_thermal_radiation_sum | Net thermal radiation at the surface. Accumulated field from the beginning of the forecast time to the end of the forecast step. By model convention downward fluxes are positive. | J/m^2 |
| surface_sensible_heat_flux_sum | Transfer of heat between the Earth's surface and the atmosphere through the effects of turbulent air motion (but excluding any heat transfer resulting from condensation or evaporation). The magnitude of the sensible heat flux is governed by the difference in temperature between the surface and the overlying atmosphere, wind speed and the surface roughness. For example, cold air overlying a warm surface would produce a sensible heat flux from the land (or ocean) into the atmosphere. This is a single level variable and it is accumulated from the beginning of the forecast time to the end of the forecast step. The units are joules per square meter (J m-2). To convert to watts per square meter (W m-2), the accumulated values should be divided by the accumulation period expressed in seconds. The ECMWF convention for vertical fluxes is positive downwards. | J/m^2 |
| surface_solar_radiation_downwards_sum | Amount of solar radiation (also known as shortwave radiation) reaching the surface of the Earth. This variable comprises both direct and diffuse solar radiation. Radiation from the Sun (solar, or shortwave, radiation) is partly reflected back to space by clouds and particles in the atmosphere (aerosols) and some of it is absorbed. The rest is incident on the Earth's surface (represented by this variable). To a reasonably good approximation, this variable is the model equivalent of what would be measured by a pyranometer (an instrument used for measuring solar radiation) at the surface. However, care should be taken when comparing model variables with observations, because observations are often local to a particular point in space and time, rather than representing averages over a model grid box and model time step. This variable is accumulated from the beginning of the forecast time to the end of the forecast step. The units are joules per square meter (J m-2). To convert to watts per square meter (W m-2), the accumulated values should be divided by the accumulation period expressed in seconds. The ECMWF convention for vertical fluxes is positive downwards. | J/m^2 |
| surface_thermal_radiation_downwards_sum | Amount of thermal (also known as longwave or terrestrial) radiation emitted by the atmosphere and clouds that reaches the Earth's surface. The surface of the Earth emits thermal radiation, some of which is absorbed by the atmosphere and clouds. The atmosphere and clouds likewise emit thermal radiation in all directions, some of which reaches the surface (represented by this variable). This variable is accumulated from the beginning of the forecast time to the end of the forecast step. The units are joules per square meter (J m-2). To convert to watts per square meter (W m-2), the accumulated values should be divided by the accumulation period expressed in seconds. The ECMWF convention for vertical fluxes is positive downwards. | J/m^2 |
| evaporation_from_bare_soil_sum | The amount of evaporation from bare soil at the top of the land surface. This variable is accumulated from the beginning of the forecast time to the end of the forecast step. | m of water equivalent |
| evaporation_from_open_water_surfaces_excluding_oceans_sum | Amount of evaporation from surface water storage like lakes and inundated areas but excluding oceans. This variable is accumulated from the beginning of the forecast time to the end of the forecast step. | m of water equivalent |
| evaporation_from_the_top_of_canopy_sum | The amount of evaporation from the canopy interception reservoir at the top of the canopy. This variable is accumulated from the beginning of the forecast time to the end of the forecast step. | m of water equivalent |
| evaporation_from_vegetation_transpiration_sum | Amount of evaporation from vegetation transpiration. This has the same meaning as root extraction i.e. the amount of water extracted from the different soil layers. This variable is accumulated from the beginning of the forecast time to the end of the forecast step. | m of water equivalent |
| potential_evaporation_sum | Potential evaporation (pev) in the current ECMWF model is computed, by making a second call to the surface energy balance routine with the vegetation variables set to "crops/mixed farming" and assuming no stress from soil moisture. In other words, evaporation is computed for agricultural land as if it is well watered and assuming that the atmosphere is not affected by this artificial surface condition. The latter may not always be realistic. Although pev is meant to provide an estimate of irrigation requirements, the method can give unrealistic results in arid conditions due to too strong evaporation forced by dry air. This variable is accumulated from the beginning of the forecast time to the end of the forecast step. | m |
| runoff_sum | Some water from rainfall, melting snow, or deep in the soil, stays stored in the soil. Otherwise, the water drains away, either over the surface (surface runoff), or under the ground (sub-surface runoff) and the sum of these two is simply called 'runoff'. This variable is the total amount of water accumulated from the beginning of the forecast time to the end of the forecast step. The units of runoff are depth in meters. This is the depth the water would have if it were spread evenly over the grid box. Care should be taken when comparing model variables with observations, because observations are often local to a particular point rather than averaged over a grid square area. Observations are also often taken in different units, such as mm/day, rather than the accumulated meters produced here. Runoff is a measure of the availability of water in the soil, and can, for example, be used as an indicator of drought or flood. More information about how runoff is calculated is given in the IFS Physical Processes documentation. | m |
| snow_evaporation_sum | Evaporation from snow averaged over the grid box (to find flux over snow, divide by snow fraction). This variable is accumulated from the beginning of the forecast time to the end of the forecast step. | m of water equivalent |
| sub_surface_runoff_sum | Some water from rainfall, melting snow, or deep in the soil, stays stored in the soil. Otherwise, the water drains away, either over the surface (surface runoff), or under the ground(sub-surface runoff) and the sum of these two is simply called 'runoff'. This variable is accumulated from the beginning of the forecast time to the end of the forecast step. The units of runoff are depth in meters. This is the depth the water would have if it were spread evenly over the grid box. Care should be taken when comparing model variables with observations, because observations are often local to a particular point rather than averaged over a grid square area. Observations are also often taken in different units, such as mm/day, rather than the accumulated meters produced here. Runoff is a measure of the availability of water in the soil, and can, for example, be used as an indicator of drought or flood. More information about how runoff is calculated is given in the IFS Physical Processes documentation. | m |
| surface_runoff_sum | Some water from rainfall, melting snow, or deep in the soil, stays stored in the soil. Otherwise, the water drains away, either over the surface (surface runoff), or under the ground (sub-surface runoff) and the sum of these two is simply called 'runoff'. This variable is the total amount of water accumulated from the beginning of the forecast time to the end of the forecast step. The units of runoff are depth in meters. This is the depth the water would have if it were spread evenly over the grid box. Care should be taken when comparing model variables with observations, because observations are often local to a particular point rather than averaged over a grid square area. Observations are also often taken in different units, such as mm/day, rather than the accumulated meters produced here. Runoff is a measure of the availability of water in the soil, and can, for example, be used as an indicator of drought or flood. More information about how runoff is calculated is given in the IFS Physical Processes documentation. | m |
| total_evaporation_sum | Accumulated amount of water that has evaporated from the Earth's surface, including a simplified representation of transpiration (from vegetation), into vapor in the air above. This variable is accumulated from the beginning of the forecast to the end of the forecast step. The ECMWF Integrated Forecasting System convention is that downward fluxes are positive. Therefore, negative values indicate evaporation and positive values indicate condensation. | m of water equivalent |
| u_component_of_wind_10m | Eastward component of the 10m wind. It is the horizontal speed of air moving towards the east, at a height of ten meters above the surface of the Earth, in meters per second. Care should be taken when comparing this variable with observations, because wind observations vary on small space and time scales and are affected by the local terrain, vegetation and buildings that are represented only on average in the ECMWF Integrated Forecasting System. This variable can be combined with the V component of 10m wind to give the speed and direction of the horizontal 10m wind. | m/s |
| v_component_of_wind_10m | Northward component of the 10m wind. It is the horizontal speed of air moving towards the north, at a height of ten meters above the surface of the Earth, in meters per second. Care should be taken when comparing this variable with observations, because wind observations vary on small space and time scales and are affected by the local terrain, vegetation and buildings that are represented only on average in the ECMWF Integrated Forecasting System. This variable can be combined with the U component of 10m wind to give the speed and direction of the horizontal 10m wind. | m/s |
| surface_pressure | Pressure (force per unit area) of the atmosphere on the surface of land, sea and in-land water. It is a measure of the weight of all the air in a column vertically above the area of the Earth's surface represented at a fixed point. Surface pressure is often used in combination with temperature to calculate air density. The strong variation of pressure with altitude makes it difficult to see the low and high pressure systems over mountainous areas, so mean sea level pressure, rather than surface pressure, is normally used for this purpose. The units of this variable are Pascals (Pa). Surface pressure is often measured in hPa and sometimes is presented in the old units of millibars, mb (1 hPa = 1 mb = 100 Pa). | Pa |
| total_precipitation_sum | Accumulated liquid and frozen water, including rain and snow, that falls to the Earth's surface. It is the sum of large-scale precipitation (that precipitation which is generated by large-scale weather patterns, such as troughs and cold fronts) and convective precipitation (generated by convection which occurs when air at lower levels in the atmosphere is warmer and less dense than the air above, so it rises). Precipitation variables do not include fog, dew or the precipitation that evaporates in the atmosphere before it lands at the surface of the Earth. This variable is accumulated from the beginning of the forecast time to the end of the forecast step. The units of precipitation are depth in meters. It is the depth the water would have if it were spread evenly over the grid box. Care should be taken when comparing model variables with observations, because observations are often local to a particular point in space and time, rather than representing averages over a model grid box and model time step. | m |
| leaf_area_index_high_vegetation | One-half of the total green leaf area per unit horizontal ground surface area for high vegetation type. | Area fraction |
| leaf_area_index_low_vegetation | One-half of the total green leaf area per unit horizontal ground surface area for low vegetation type. | Area fraction |
| dewpoint_temperature_2m_min | daily minimum dewpoint_temperature_2m value | K |
| dewpoint_temperature_2m_max | daily maximum dewpoint_temperature_2m value | K |
| temperature_2m_min | daily minimum temperature_2m value | K |
| temperature_2m_max | daily maximum temperature_2m value | K |
| skin_temperature_min | daily minimum skin_temperature value | K |
| skin_temperature_max | daily maximum skin_temperature value | K |
| soil_temperature_level_1_min | daily minimum soil_temperature_level_1 value | K |
| soil_temperature_level_1_max | daily maximum soil_temperature_level_1 value | K |
| soil_temperature_level_2_min | daily minimum soil_temperature_level_2 value | K |
| soil_temperature_level_2_max | daily maximum soil_temperature_level_2 value | K |
| soil_temperature_level_3_min | daily minimum soil_temperature_level_3 value | K |
| soil_temperature_level_3_max | daily maximum soil_temperature_level_3 value | K |
| soil_temperature_level_4_min | daily minimum soil_temperature_level_4 value | K |
| soil_temperature_level_4_max | daily maximum soil_temperature_level_4 value | K |
| lake_bottom_temperature_min | daily minimum lake_bottom_temperature value | K |
| lake_bottom_temperature_max | daily maximum lake_bottom_temperature value | K |
| lake_ice_depth_min | daily minimum lake_ice_depth value | m |
| lake_ice_depth_max | daily maximum lake_ice_depth value | m |
| lake_ice_temperature_min | daily minimum lake_ice_temperature value | K |
| lake_ice_temperature_max | daily maximum lake_ice_temperature value | K |
| lake_mix_layer_depth_min | daily minimum lake_mix_layer_depth value | m |
| lake_mix_layer_depth_max | daily maximum lake_mix_layer_depth value | m |
| lake_mix_layer_temperature_min | daily minimum lake_mix_layer_temperature value | K |
| lake_mix_layer_temperature_max | daily maximum lake_mix_layer_temperature value | K |
| lake_shape_factor_min | daily minimum lake_shape_factor value | |
| lake_shape_factor_max | daily maximum lake_shape_factor value | |
| lake_total_layer_temperature_min | daily minimum lake_total_layer_temperature value | K |
| lake_total_layer_temperature_max | daily maximum lake_total_layer_temperature value | K |
| snow_albedo_min | daily minimum snow_albedo value | |
| snow_albedo_max | daily maximum snow_albedo value | |
| snow_cover_min | daily minimum snow_cover value | % |
| snow_cover_max | daily maximum snow_cover value | % |
| snow_density_min | daily minimum snow_density value | kg/m^3 |
| snow_density_max | daily maximum snow_density value | kg/m^3 |
| snow_depth_min | daily minimum snow_depth value | m |
| snow_depth_max | daily maximum snow_depth value | m |
| snow_depth_water_equivalent_min | daily minimum snow_depth_water_equivalent value | m of water equivalent |
| snow_depth_water_equivalent_max | daily maximum snow_depth_water_equivalent value | m of water equivalent |
| snowfall_min | daily minimum snowfall value | m of water equivalent |
| snowfall_max | daily maximum snowfall value | m of water equivalent |
| snowmelt_min | daily minimum snowmelt value | m of water equivalent |
| snowmelt_max | daily maximum snowmelt value | m of water equivalent |
| temperature_of_snow_layer_min | daily minimum temperature_of_snow_layer value | K |
| temperature_of_snow_layer_max | daily maximum temperature_of_snow_layer value | K |
| skin_reservoir_content_min | daily minimum skin_reservoir_content value | m of water equivalent |
| skin_reservoir_content_max | daily maximum skin_reservoir_content value | m of water equivalent |
| volumetric_soil_water_layer_1_min | daily minimum volumetric_soil_water_layer_1 value | Volume fraction |
| volumetric_soil_water_layer_1_max | daily maximum volumetric_soil_water_layer_1 value | Volume fraction |
| volumetric_soil_water_layer_2_min | daily minimum volumetric_soil_water_layer_2 value | Volume fraction |
| volumetric_soil_water_layer_2_max | daily maximum volumetric_soil_water_layer_2 value | Volume fraction |
| volumetric_soil_water_layer_3_min | daily minimum volumetric_soil_water_layer_3 value | Volume fraction |
| volumetric_soil_water_layer_3_max | daily maximum volumetric_soil_water_layer_3 value | Volume fraction |
| volumetric_soil_water_layer_4_min | daily minimum volumetric_soil_water_layer_4 value | Volume fraction |
| volumetric_soil_water_layer_4_max | daily maximum volumetric_soil_water_layer_4 value | Volume fraction |
| forecast_albedo_min | daily minimum forecast_albedo value | |
| forecast_albedo_max | daily maximum forecast_albedo value | |
| surface_latent_heat_flux_min | daily minimum surface_latent_heat_flux value | J/m^2 |
| surface_latent_heat_flux_max | daily maximum surface_latent_heat_flux value | J/m^2 |
| surface_net_solar_radiation_min | daily minimum surface_net_solar_radiation value | J/m^2 |
| surface_net_solar_radiation_max | daily maximum surface_net_solar_radiation value | J/m^2 |
| surface_net_thermal_radiation_min | daily minimum surface_net_thermal_radiation value | J/m^2 |
| surface_net_thermal_radiation_max | daily maximum surface_net_thermal_radiation value | J/m^2 |
| surface_sensible_heat_flux_min | daily minimum surface_sensible_heat_flux value | J/m^2 |
| surface_sensible_heat_flux_max | daily maximum surface_sensible_heat_flux value | J/m^2 |
| surface_solar_radiation_downwards_min | daily minimum surface_solar_radiation_downwards value | J/m^2 |
| surface_solar_radiation_downwards_max | daily maximum surface_solar_radiation_downwards value | J/m^2 |
| surface_thermal_radiation_downwards_min | daily minimum surface_thermal_radiation_downwards value | J/m^2 |
| surface_thermal_radiation_downwards_max | daily maximum surface_thermal_radiation_downwards value | J/m^2 |
| evaporation_from_bare_soil_min | daily minimum evaporation_from_bare_soil value | m of water equivalent |
| evaporation_from_bare_soil_max | daily maximum evaporation_from_bare_soil value | m of water equivalent |
| evaporation_from_open_water_surfaces_excluding_oceans_min | daily minimum evaporation_from_open_water_surfaces_excluding_oceans value | m of water equivalent |
| evaporation_from_open_water_surfaces_excluding_oceans_max | daily maximum evaporation_from_open_water_surfaces_excluding_oceans value | m of water equivalent |
| evaporation_from_the_top_of_canopy_min | daily minimum evaporation_from_the_top_of_canopy value | m of water equivalent |
| evaporation_from_the_top_of_canopy_max | daily maximum evaporation_from_the_top_of_canopy value | m of water equivalent |
| evaporation_from_vegetation_transpiration_min | daily minimum evaporation_from_vegetation_transpiration value | m of water equivalent |
| evaporation_from_vegetation_transpiration_max | daily maximum evaporation_from_vegetation_transpiration value | m of water equivalent |
| potential_evaporation_min | daily minimum potential_evaporation value | m |
| potential_evaporation_max | daily maximum potential_evaporation value | m |
| runoff_min | daily minimum runoff value | m |
| runoff_max | daily maximum runoff value | m |
| snow_evaporation_min | daily minimum snow_evaporation value | m of water equivalent |
| snow_evaporation_max | daily maximum snow_evaporation value | m of water equivalent |
| sub_surface_runoff_min | daily minimum sub_surface_runoff value | m |
| sub_surface_runoff_max | daily maximum sub_surface_runoff value | m |
| surface_runoff_min | daily minimum surface_runoff value | m |
| surface_runoff_max | daily maximum surface_runoff value | m |
| total_evaporation_min | daily minimum total_evaporation value | m of water equivalent |
| total_evaporation_max | daily maximum total_evaporation value | m of water equivalent |
| u_component_of_wind_10m_min | daily minimum u_component_of_wind_10m value | m/s |
| u_component_of_wind_10m_max | daily maximum u_component_of_wind_10m value | m/s |
| v_component_of_wind_10m_min | daily minimum v_component_of_wind_10m value | m/s |
| v_component_of_wind_10m_max | daily maximum v_component_of_wind_10m value | m/s |
| surface_pressure_min | daily minimum surface_pressure value | Pa |
| surface_pressure_max | daily maximum surface_pressure value | Pa |
| total_precipitation_min | daily minimum total_precipitation value | m |
| total_precipitation_max | daily maximum total_precipitation value | m |
| leaf_area_index_high_vegetation_min | daily minimum leaf_area_index_high_vegetation value | Area fraction |
| leaf_area_index_high_vegetation_max | daily maximum leaf_area_index_high_vegetation value | Area fraction |
| leaf_area_index_low_vegetation_min | daily minimum leaf_area_index_low_vegetation value | Area fraction |
| leaf_area_index_low_vegetation_max | daily maximum leaf_area_index_low_vegetation value | Area fraction |
变量
NameTypeDescriptiondayInt
Calendar day
monthInt
Calendar month
yearInt
Calendar year
代码
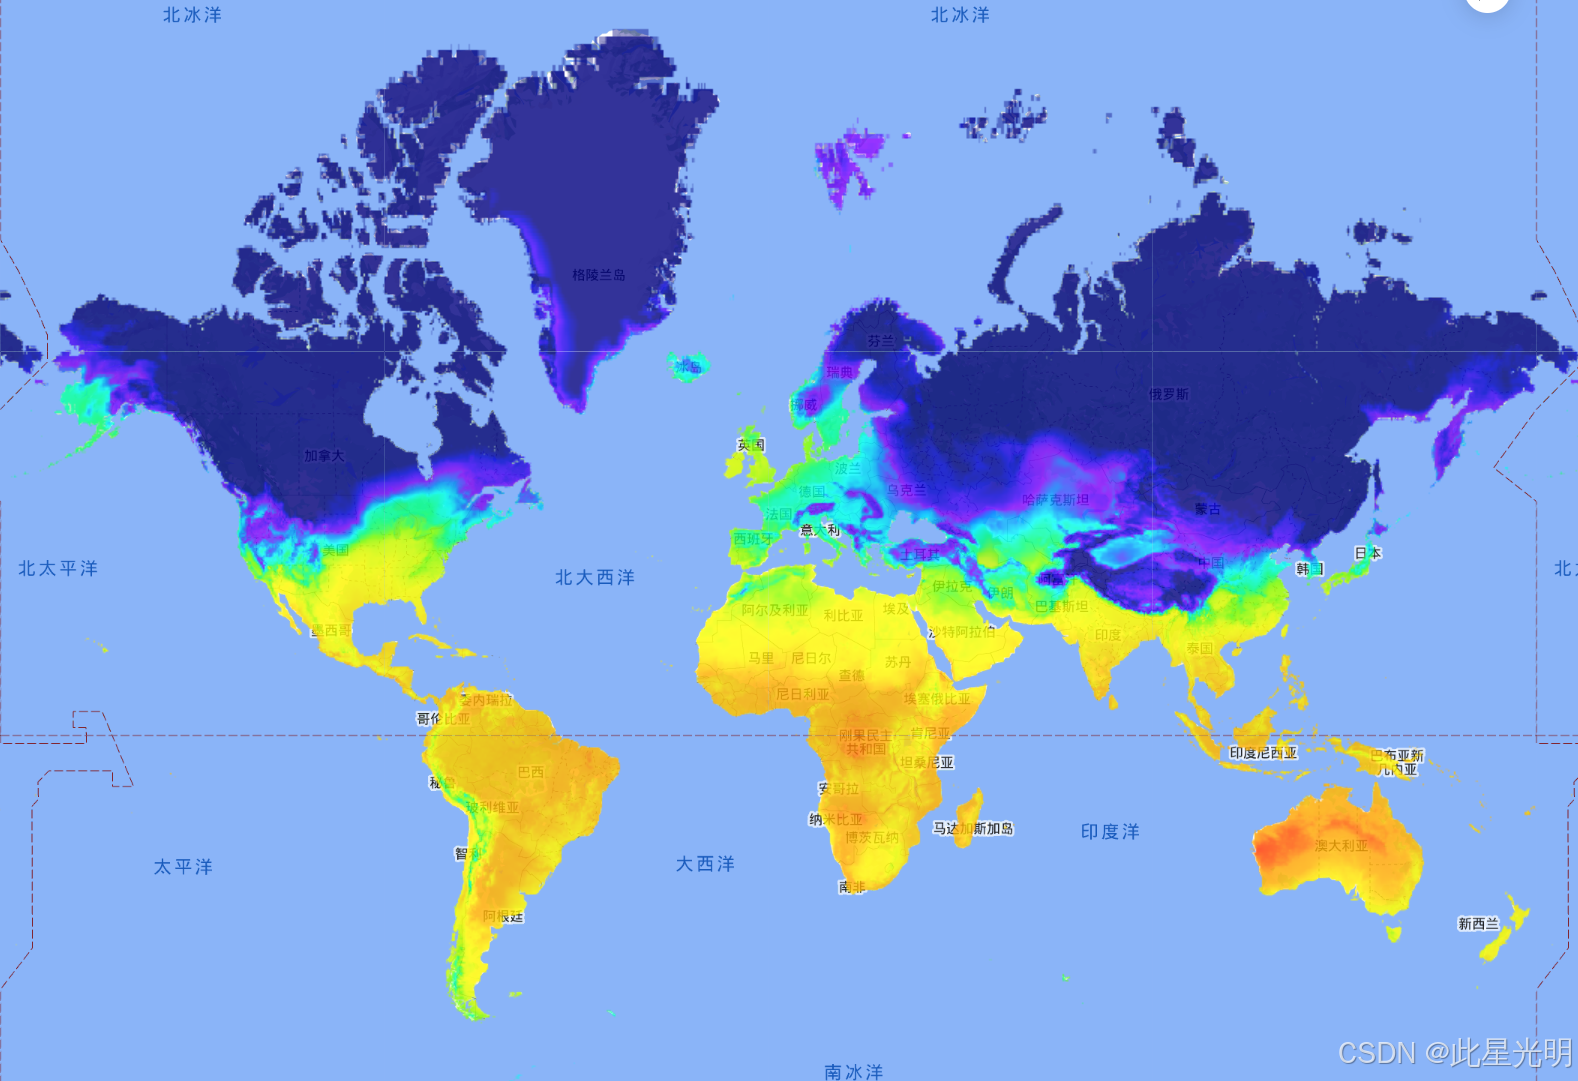
var dataset = ee.ImageCollection('ECMWF/ERA5_LAND/DAILY_AGGR').first();var visualization = {bands: ['temperature_2m'],min: 250,max: 320,palette: ['000080', '0000d9', '4000ff', '8000ff', '0080ff', '00ffff','00ff80', '80ff00', 'daff00', 'ffff00', 'fff500', 'ffda00','ffb000', 'ffa400', 'ff4f00', 'ff2500', 'ff0a00', 'ff00ff',]
};
Map.setCenter(70, 45, 3);
Map.addLayer(dataset, visualization, 'Air temperature (K) at 2m height', true, 0.8);
代码链接
https://code.earthengine.google.com/?scriptPath=Examples%3ADatasets%2FECMWF%2FECMWF_ERA5_LAND_DAILY_AGGR
结果
引用
Muñoz Sabater, J., (2019): ERA5-Land monthly averaged data from 1981 to present. Copernicus Climate Change Service (C3S) Climate Data Store (CDS). (<date of access>), doi:10.24381/cds.68d2bb30
许可
请按照哥白尼 C3S/CAMS 许可协议中的规定,确认ERA5-Land 的使用: 5.1.1 当被许可人向公众传播或分发哥白尼产品时,被许可人应使用以下或任何类似通知告知接收者其来源: "使用哥白尼气候变化服务信息[年份]生成"。2 当被许可人制作或协助制作包含改编或修改的哥白尼产品的出版物或分发时,被许可人应提供以下或任何类似的通知:"包含修改的哥白尼气候变化服务信息[年份]";第5.1.1和5.1.2条所涉及的任何此类出版物或分发应说明欧盟委员会或ECMWF对其所包含的哥白尼信息或数据的任何使用均不承担责任。
网址推荐
0代码在线构建地图应用
https://www.mapmost.com/#/?source_inviter=CnVrwIQs
机器学习
https://www.cbedai.net/xg
相关文章:
GEE数据集——ERA5-陆地每日汇总--ECMWF气候再分析数据集
目录 简介 数据集说明 Dataset Availability Dataset Provider Collection Snippet 空间信息 Resolution Bands Table 变量 代码 代码链接 结果 引用 许可 网址推荐 0代码在线构建地图应用 机器学习 简介 注(2024-04-19): …...

Spring Boot 中的 @RequestMapping 和 Spring 中的 @RequestMapping 有什么区别?
在Spring框架中,RequestMapping注解用于映射Web请求到处理器(Controller)的方法上。在Spring Boot中,这个注解的使用方式和目的与Spring框架中是完全相同的。RequestMapping注解可以用于类或方法上,以声明请求的映射。…...

PROFINET开发或EtherNet/IP开发嵌入式归一板有用于工业称重秤
这是真实案例。然而,客户选择不展示其品牌名称。 Anybus嵌入式解决方案帮助工业称重设备制造商连接到任何工业网络。多网络连接使称重设备能够轻松访问不同的控制系统,从而加快上市时间。 我们最终找到了HMSNetworks的Anybus解决方案。他们的成熟技术和专…...

【Kafka】Kafka源码解析之producer过程解读
从本篇开始 打算用三篇文章 分别介绍下Producer生产消费,Consumer消费消息 以及Spring是如何集成Kafka 三部分,致于对于Broker的源码解析,因为是scala语言写的,暂时不打算进行学习分享。 总体介绍 clients : 保存的是Kafka客户端…...

深度学习笔记20_数据增强
🍨 本文为🔗365天深度学习训练营 中的学习记录博客🍖 原作者:K同学啊 | 接辅导、项目定制 一、我的环境 1.语言环境:Python 3.9 2.编译器:Pycharm 3.深度学习环境:TensorFlow 2.10.0 二、GPU设置…...

模板变量与php变量对比做判断
${item.create_name}如何与php变量对比 在PHP中,您可以通过将字符串内嵌到双引号中来将模板变量 ${item.create_name} 与PHP变量进行对比。如果您有一个PHP变量 $phpVariable 并且想要检查它是否与 ${item.create_name} 相同,您可以使用 str_replace 函…...

C语言 | Leetcode C语言题解之第485题最大连续1的个数
题目: 题解: int findMaxConsecutiveOnes(int* nums, int numsSize) {int maxCount 0, count 0;for (int i 0; i < numsSize; i) {if (nums[i] 1) {count;} else {maxCount fmax(maxCount, count);count 0;}}maxCount fmax(maxCount, count);…...

C语言复习概要(六)
公主请阅 1. 深入理解数组与指针在C语言中的应用1.1 数组名的理解 2. 使用指针访问数组3. 一维数组传参的本质4. 冒泡排序的实现5. 二级指针6. 指针数组7. 指针数组模拟二维数组8.总结 1. 深入理解数组与指针在C语言中的应用 数组与指针是C语言的核心概念之一,理解…...

PyQt 入门教程(2)搭建开发环境
文章目录 一、搭建开发环境1、安装PyQt5与pyqt5-tools2、配置QtDesigner3、配置Pyuic4、配置Pyrcc 一、搭建开发环境 1、安装PyQt5与pyqt5-tools PyQt5: PyQt的开发库。Pyqt5-tools: 它是一个包含多种工具的工具包,旨在帮助开发者更方便地使…...

Flink Kubernetes Operator
Flink Kubernetes Operator是一个用于在Kubernetes集群上管理Apache Flink应用的工具。 一、基本概念 Flink Kubernetes Operator允许用户通过Kubernetes的原生工具(如kubectl)来管理Flink应用程序及其生命周期。它简化了Flink应用在Kubernetes集群上的…...

【最新华为OD机试E卷-支持在线评测】字符统计及重排(100分)多语言题解-(Python/C/JavaScript/Java/Cpp)
🍭 大家好这里是春秋招笔试突围 ,一枚热爱算法的程序员 💻 ACM金牌🏅️团队 | 大厂实习经历 | 多年算法竞赛经历 ✨ 本系列打算持续跟新华为OD-E/D卷的多语言AC题解 🧩 大部分包含 Python / C / Javascript / Java / Cpp 多语言代码 👏 感谢大家的订阅➕ 和 喜欢�…...

springboot使用GDAL获取tif文件的缩略图并转为base64
springboot使用GDAL获取tif文件的缩略图并转为base64 首先需要安装gdal:https://blog.csdn.net/qq_61950936/article/details/142880279?spm1001.2014.3001.5501 然后是配置pom.xml文件: <!--处理缩略图的--><dependency><groupId>o…...

Pytorch——pip下载安装pytorch慢的解决办法
一、找到需要下载的pytorch链接 运行:pip install torch1.11.0cu113 torchvision0.12.0cu113 torchaudio0.11.0 --extra-index-url https://download.pytorch.org/whl/cu113。然后得到: 我这里为:https://download.pytorch.org/whl/cu113/t…...

uniapp微信小程序调用百度OCR
uniapp编写微信小程序调用百度OCR 公司有一个识别行驶证需求,调用百度ocr识别 使用了image-tools这个插件,因为百度ocr接口用图片的base64 这里只是简单演示,accesstoken获取接口还是要放在服务器端,不然就暴露了自己的百度项目k…...

Vue3+TS项目---实用的复杂类型定义总结
namespace 概念 在TypeScript中,namespace是一种用于组织代码得结构,主要用于将相关得功能(例如类、接口、函数等)组合在一起。它可以帮助避免命名冲突,尤其是在大项目中。 用法 1.定义命名空间 使用namespace关键…...

尚硅谷rabbitmq2024 工作模式路由篇 第11节 答疑
String exchangeName "test_direct"; /! 创建交换机 人图全 channel.exchangeDeclare(exchangeName,BuiltinExchangeType.DIREcT, b: true, b1: false, b2: false, map: null); /1 创建队列 String queue1Name "test_direct_queue1"; String queue2Name &q…...

HTTP vs WebSocket
本文将对比介绍HTTP 和 WebSocket ! 相关文章: 1.HTTP 详解 2.WebSocket 详解 一、HTTP:请求/响应的主流协议 HTTP(超文本传输协议)是用于发送和接收网页数据的标准协议。它最早于1991年由Tim Berners-Lee提出来&…...

R语言医学数据分析实践-数据读写
【图书推荐】《R语言医学数据分析实践》-CSDN博客 《R语言医学数据分析实践 李丹 宋立桓 蔡伟祺 清华大学出版社9787302673484》【摘要 书评 试读】- 京东图书 (jd.com) R语言编程_夏天又到了的博客-CSDN博客 R编程环境的搭建-CSDN博客 在分析公共卫生数据时,数…...

JavaWeb环境下Spring Boot在线考试系统的优化策略
摘要 随着信息技术在管理上越来越深入而广泛的应用,管理信息系统的实施在技术上已逐步成熟。本文介绍了基于JavaWeb技术的在线考试系统设计与实现的开发全过程。通过分析基于Java Web技术的在线考试系统设计与实现管理的不足,创建了一个计算机管理基于Ja…...

ETL技术在金蝶云星空与旺店通WMS集成中的应用
金蝶云星空数据集成到旺店通WMS的技术案例分享 在数字化转型的背景下,现代企业对系统间的数据集成需求日益增加。本篇文章将以“组装入库>其他入库单-1”方案为例,详细解析如何通过轻易云数据集成平台,实现金蝶云星空与旺店通WMS之间的数…...

UE5 BaseEditorSettings.ini加载原理与配置生效机制
1. 为什么你改了BaseEditorSettings.ini却没生效?——从UE5编辑器启动流程讲起很多人在UE5项目里折腾半天,把BaseEditorSettings.ini文件翻来覆去改了十几遍,重启编辑器后发现:缩放比例还是不对、网格间距没变、甚至“启用实时预览…...

ARMv8 HFGITR_EL2寄存器解析与虚拟化指令陷阱控制
1. AArch64 HFGITR_EL2寄存器架构解析HFGITR_EL2(Hypervisor Fine-Grained Instruction Trap Register)是ARMv8架构中专门用于指令级陷阱控制的系统寄存器,属于虚拟化扩展的重要组成部分。这个64位寄存器通过位映射机制实现对特定AArch64指令…...

政企数据安全:危机与出路
随着数字化转型的浪潮席卷全球,公共部门积累的数据量呈爆炸式增长。从公民个人信息到公共服务记录,从财政预算到基础设施管理数据——这些宝贵资源在提升政府治理效率的同时,也悄然成为网络犯罪分子的“新猎物”。当公共数据逐渐成为数字时代…...
)
别再用SonarQube凑数了!DeepSeek原生圈复杂度引擎的6大颠覆性能力(含GitHub私有部署密钥)
更多请点击: https://kaifayun.com 第一章:DeepSeek圈复杂度分析的底层原理与范式革命 DeepSeek圈复杂度分析并非传统McCabe度量的简单复刻,而是基于控制流图(CFG)动态重构与语义感知路径裁剪的双重机制构建的新范式。…...

3步解锁专业级MMD创作:Blender插件如何重塑二次元动画工作流
3步解锁专业级MMD创作:Blender插件如何重塑二次元动画工作流 【免费下载链接】blender_mmd_tools MMD Tools is a blender addon for importing/exporting Models and Motions of MikuMikuDance. 项目地址: https://gitcode.com/gh_mirrors/bl/blender_mmd_tools …...

如何高效批量下载音乐歌词:智能歌词管理完整指南
如何高效批量下载音乐歌词:智能歌词管理完整指南 【免费下载链接】ZonyLrcToolsX ZonyLrcToolsX 是一个能够方便地下载歌词的小软件。 项目地址: https://gitcode.com/gh_mirrors/zo/ZonyLrcToolsX ZonyLrcToolsX 是一款专业的跨平台歌词下载工具,…...

Unity发行版DLL调试实战:DnSpy无源码IL级断点指南
1. 这不是“反编译”,而是Unity游戏开发者的日常调试手段你有没有遇到过这样的情况:接手一个Unity发行版游戏,想快速验证某个功能逻辑是否按预期执行,或者排查一个偶发的崩溃,但手头只有打包后的Assembly-CSharp.dll&a…...
做电影评论情感分类)
告别数据饥荒:用PyTorch手把手实现原型网络(Prototypical Networks)做电影评论情感分类
告别数据饥荒:用PyTorch手把手实现原型网络做电影评论情感分类 在自然语言处理领域,情感分析一直是热门研究方向,但现实中的开发者常面临一个尴尬困境:标注数据太少。传统深度学习方法动辄需要成千上万的标注样本,而实…...

如何快速批量下载高质量歌词:ZonyLrcToolsX跨平台终极解决方案
如何快速批量下载高质量歌词:ZonyLrcToolsX跨平台终极解决方案 【免费下载链接】ZonyLrcToolsX ZonyLrcToolsX 是一个能够方便地下载歌词的小软件。 项目地址: https://gitcode.com/gh_mirrors/zo/ZonyLrcToolsX 还在为本地音乐库缺少歌词而烦恼吗࿱…...

C++ vector容器总结
vector基本概念功能:vector数据结构和数组非常相似,也称为单端数组vector与普通数组区别:不同之处在于数组是静态空间,而vector可以动态扩展动态扩展:并不是在原空间之后续接新空间,而是找更大的内存空间&a…...