Prometheus+Grafana监控系统
一、简介
1、Prometheus简介
官网:https://prometheus.io
项目代码:https://github.com/prometheus
- Prometheus(普罗米修斯)是一个最初在SoundCloud上构建的监控系统。自2012年成为社区开源项目,拥有非常活跃的开发人员和用户社区。为强调开源及独立维护,Prometheus于2016年加入云原生云计算基金会(CNCF),成为继Kubernetes之后的第二个托管项目。
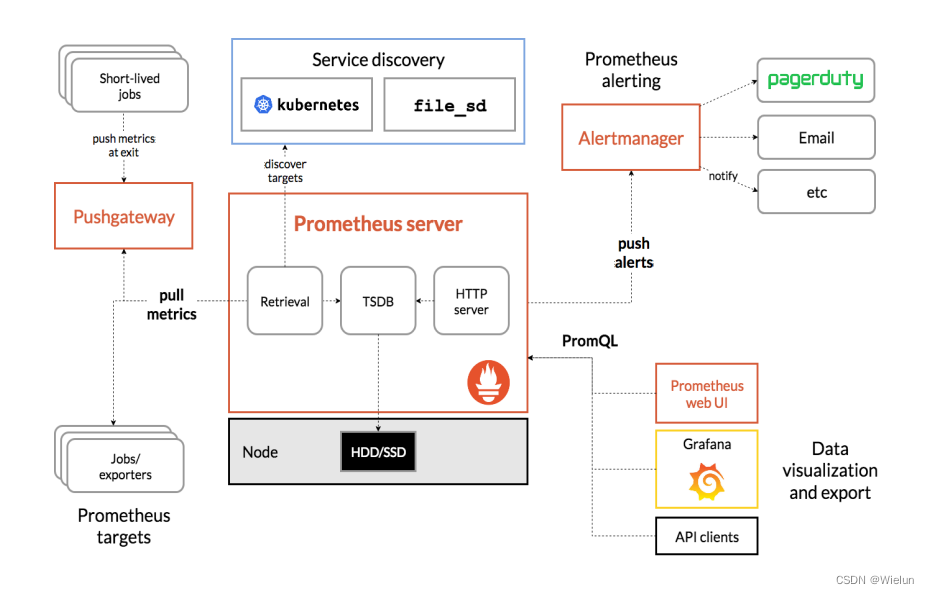
2、Prometheus组件与架构
- Prometheus Server:收集指标和存储时间序列数据,并提供查询接口
- ClientLibrary:客户端库
- Push Gateway:短期存储指标数据。主要用于临时性的任务
- Exporters:采集已有的第三方服务监控指标并暴露metrics
- Alertmanager:告警
- Web UI:简单的Web控制台
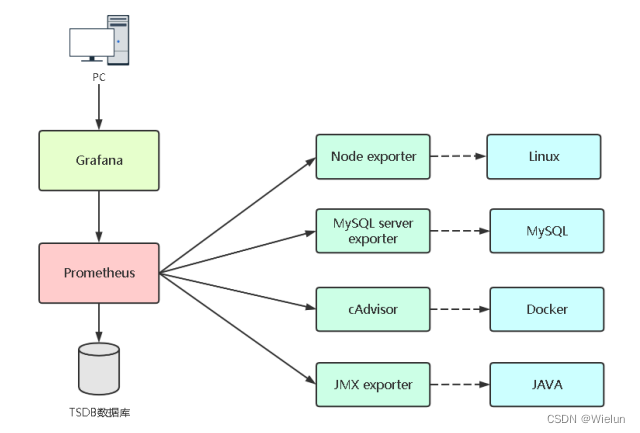
3、监控实现
exporter列表:https://prometheus.io/docs/instrumenting/exporters
4、Grafana 简介
-
Grafana 官方是这么介绍 Grafana 的:grafana是用于可视化大型测量数据的开源程序,他提供了强大和优雅的方式去创建、共享、浏览数据。dashboard中显示了你不同metric数据源中的数据。
-
Grafana 官方还对 Grafana 的适用场景以及基本特征作了介绍:
- grafana最常用于因特网基础设施和应用分析,但在其他领域也有机会用到,比如:工业传感器、家庭自动化、过程控制等等。
- grafana有热插拔控制面板和可扩展的数据源,目前已经支持Graphite、InfluxDB、OpenTSDB、Elasticsearch。
二、实验环境
selinux iptables off
| 主机名 | IP | 系统版本 |
|---|---|---|
| jenkins | 10.10.10.10 | rhel7.5 |
| tomcat | 10.10.10.11 | rhel7.5 |
三、部署Prometheus
安装文档:https://prometheus.io/docs/prometheus/latest/installation/
1、创建prometheus.yml
[root@jenkins ~]# mkdir Prometheus
[root@jenkins ~]# mkdir Prometheus/data
[root@jenkins ~]# cat Prometheus/prometheus.yml
# my global config
global:scrape_interval: 15s # Set the scrape interval to every 15 seconds. Default is every 1 minute.evaluation_interval: 15s # Evaluate rules every 15 seconds. The default is every 1 minute.# scrape_timeout is set to the global default (10s).# Alertmanager configuration
alerting:alertmanagers:- static_configs:- targets:# - alertmanager:9093# Load rules once and periodically evaluate them according to the global 'evaluation_interval'.
rule_files:# - "first_rules.yml"# - "second_rules.yml"# A scrape configuration containing exactly one endpoint to scrape:
# Here it's Prometheus itself.
scrape_configs:# The job name is added as a label `job=<job_name>` to any timeseries scraped from this config.- job_name: "prometheus"# metrics_path defaults to '/metrics'# scheme defaults to 'http'.static_configs:- targets: ["localhost:9090"][
2、安装
(1)docker启动
docker run -d \
--name=prometheus \
-v /root/Prometheus/prometheus.yml:/etc/prometheus/prometheus.yml \
-v /root/Prometheus/data:/prometheus \
-p 9090:9090 \
prom/prometheus
(2)报错
[root@jenkins ~]# docker logs -f 3e0e4270bd92
ts=2023-05-21T05:26:40.392Z caller=main.go:531 level=info msg="No time or size retention was set so using the default time retention" duration=15d
ts=2023-05-21T05:26:40.392Z caller=main.go:575 level=info msg="Starting Prometheus Server" mode=server version="(version=2.44.0, branch=HEAD, revi                                                                                                                                             sion=1ac5131f698ebc60f13fe2727f89b115a41f6558)"
ts=2023-05-21T05:26:40.392Z caller=main.go:580 level=info build_context="(go=go1.20.4, platform=linux/amd64, user=root@739e8181c5db, date=20230514                                                                                                                                             -06:18:11, tags=netgo,builtinassets,stringlabels)"
ts=2023-05-21T05:26:40.392Z caller=main.go:581 level=info host_details="(Linux 3.10.0-862.el7.x86_64 #1 SMP Wed Mar 21 18:14:51 EDT 2018 x86_64 3e                                                                                                                                             0e4270bd92 (none))"
ts=2023-05-21T05:26:40.392Z caller=main.go:582 level=info fd_limits="(soft=65536, hard=65536)"
ts=2023-05-21T05:26:40.392Z caller=main.go:583 level=info vm_limits="(soft=unlimited, hard=unlimited)"
ts=2023-05-21T05:26:40.393Z caller=query_logger.go:91 level=error component=activeQueryTracker msg="Error opening query log file" file=/prometheus                                                                                                                                             /queries.active err="open /prometheus/queries.active: permission denied"
panic: Unable to create mmap-ed active query loggoroutine 1 [running]:
github.com/prometheus/prometheus/promql.NewActiveQueryTracker({0x7fffcfb19f02, 0xb}, 0x14, {0x3c76360, 0xc0009bb360})/app/promql/query_logger.go:121 +0x3cd
main.main()/app/cmd/prometheus/main.go:637 +0x6f13
[root@jenkins ~]# chmod 777 -R Prometheus/
[root@jenkins ~]# docker ps -a
CONTAINER ID        IMAGE                               COMMAND                  CREATED             STATUS                     PORTS                                              NAMES
3e0e4270bd92        prom/prometheus                     "/bin/prometheus --c…"   2 minutes ago       Exited (2) 2 minutes ago                                                      prometheus
[root@jenkins ~]# docker start 3e0e4270bd92
3e0e4270bd92
[root@jenkins ~]# docker ps -a
CONTAINER ID        IMAGE                               COMMAND                  CREATED             STATUS              PORTS                                              NAMES
3e0e4270bd92        prom/prometheus                     "/bin/prometheus --c…"   2 minutes ago       Up 2 seconds        0.0.0.0:9090->9090/tcp                             prometheus
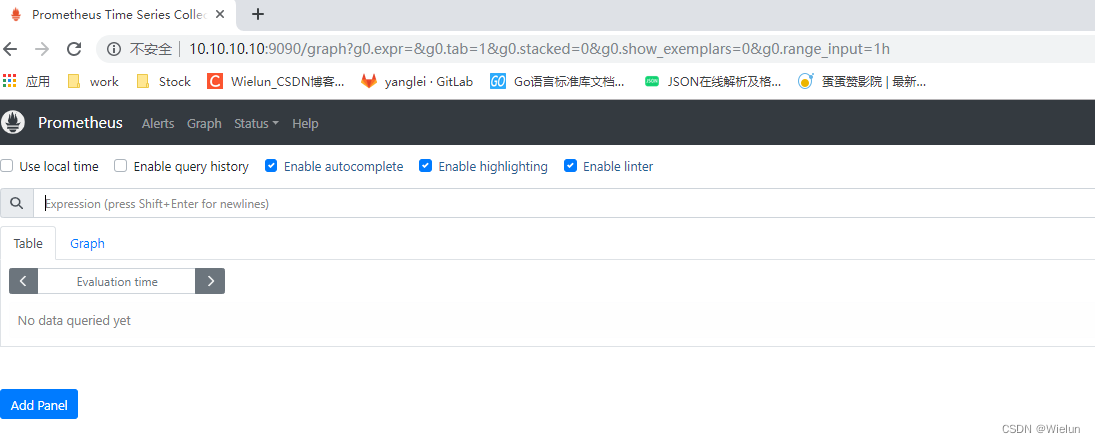
3、浏览器查看
http://10.10.10.10:9090
四、Grafana安装与使用
安装文档:https://grafana.com/grafana/download?platform=docker
1、安装
[root@jenkins ~]# docker run -d --name=grafana -p 3000:3000 grafana/grafana-enterprise
2、报错
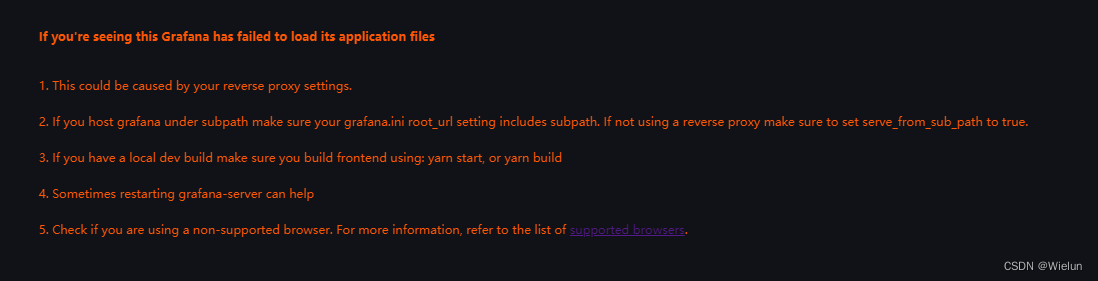
升级下Google浏览器版本即可
If you're seeing this Grafana has failed to load its application files
1. This could be caused by your reverse proxy settings.
2. If you host grafana under subpath make sure your grafana.ini root_url setting includes subpath. If not using a reverse proxy make sure to set serve_from_sub_path to true.
3. If you have a local dev build make sure you build frontend using: yarn start, or yarn build
4. Sometimes restarting grafana-server can help
5. Check if you are using a non-supported browser. For more information, refer to the list of supported browsers.
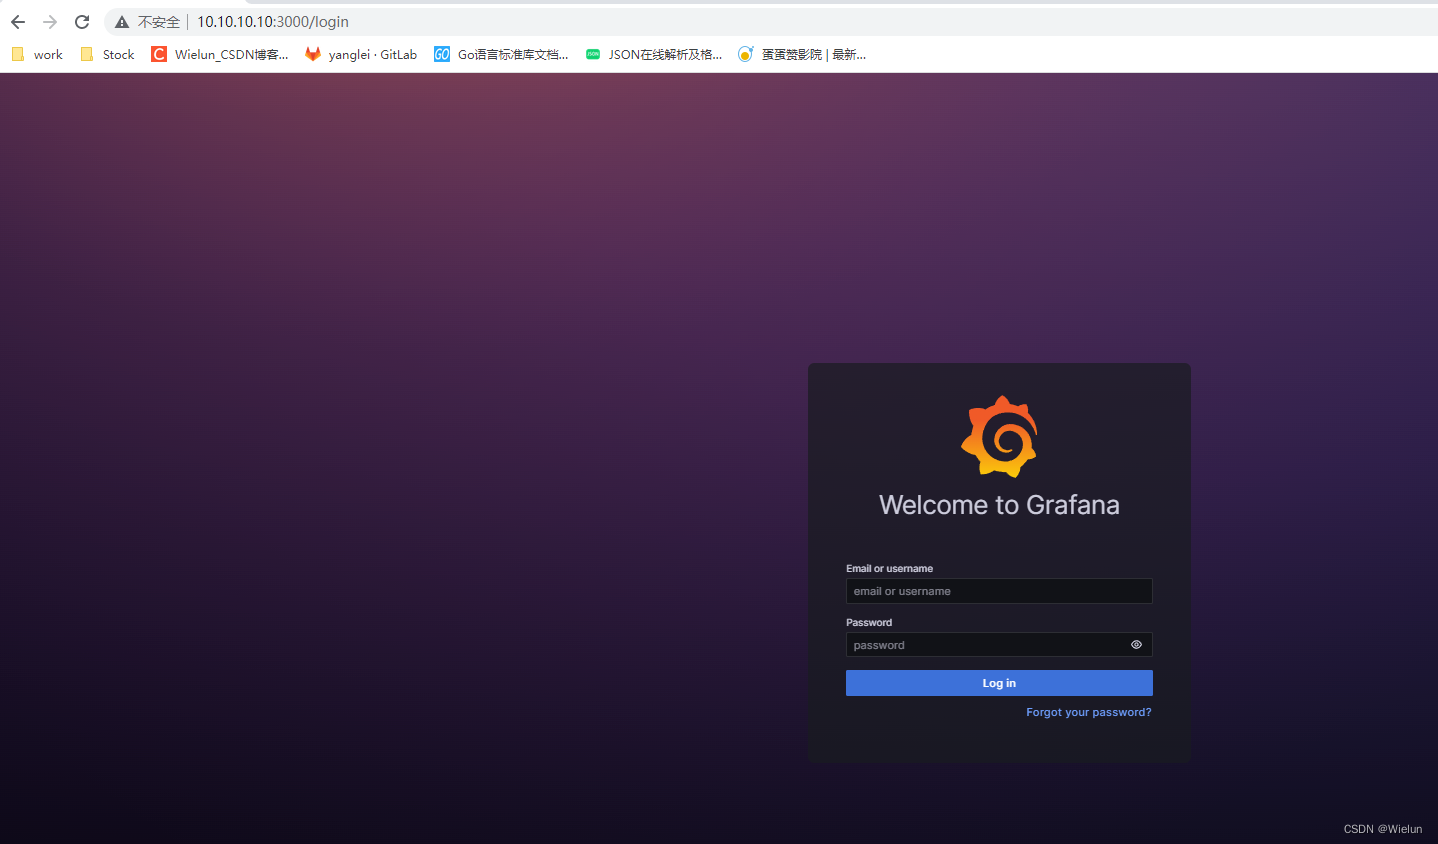
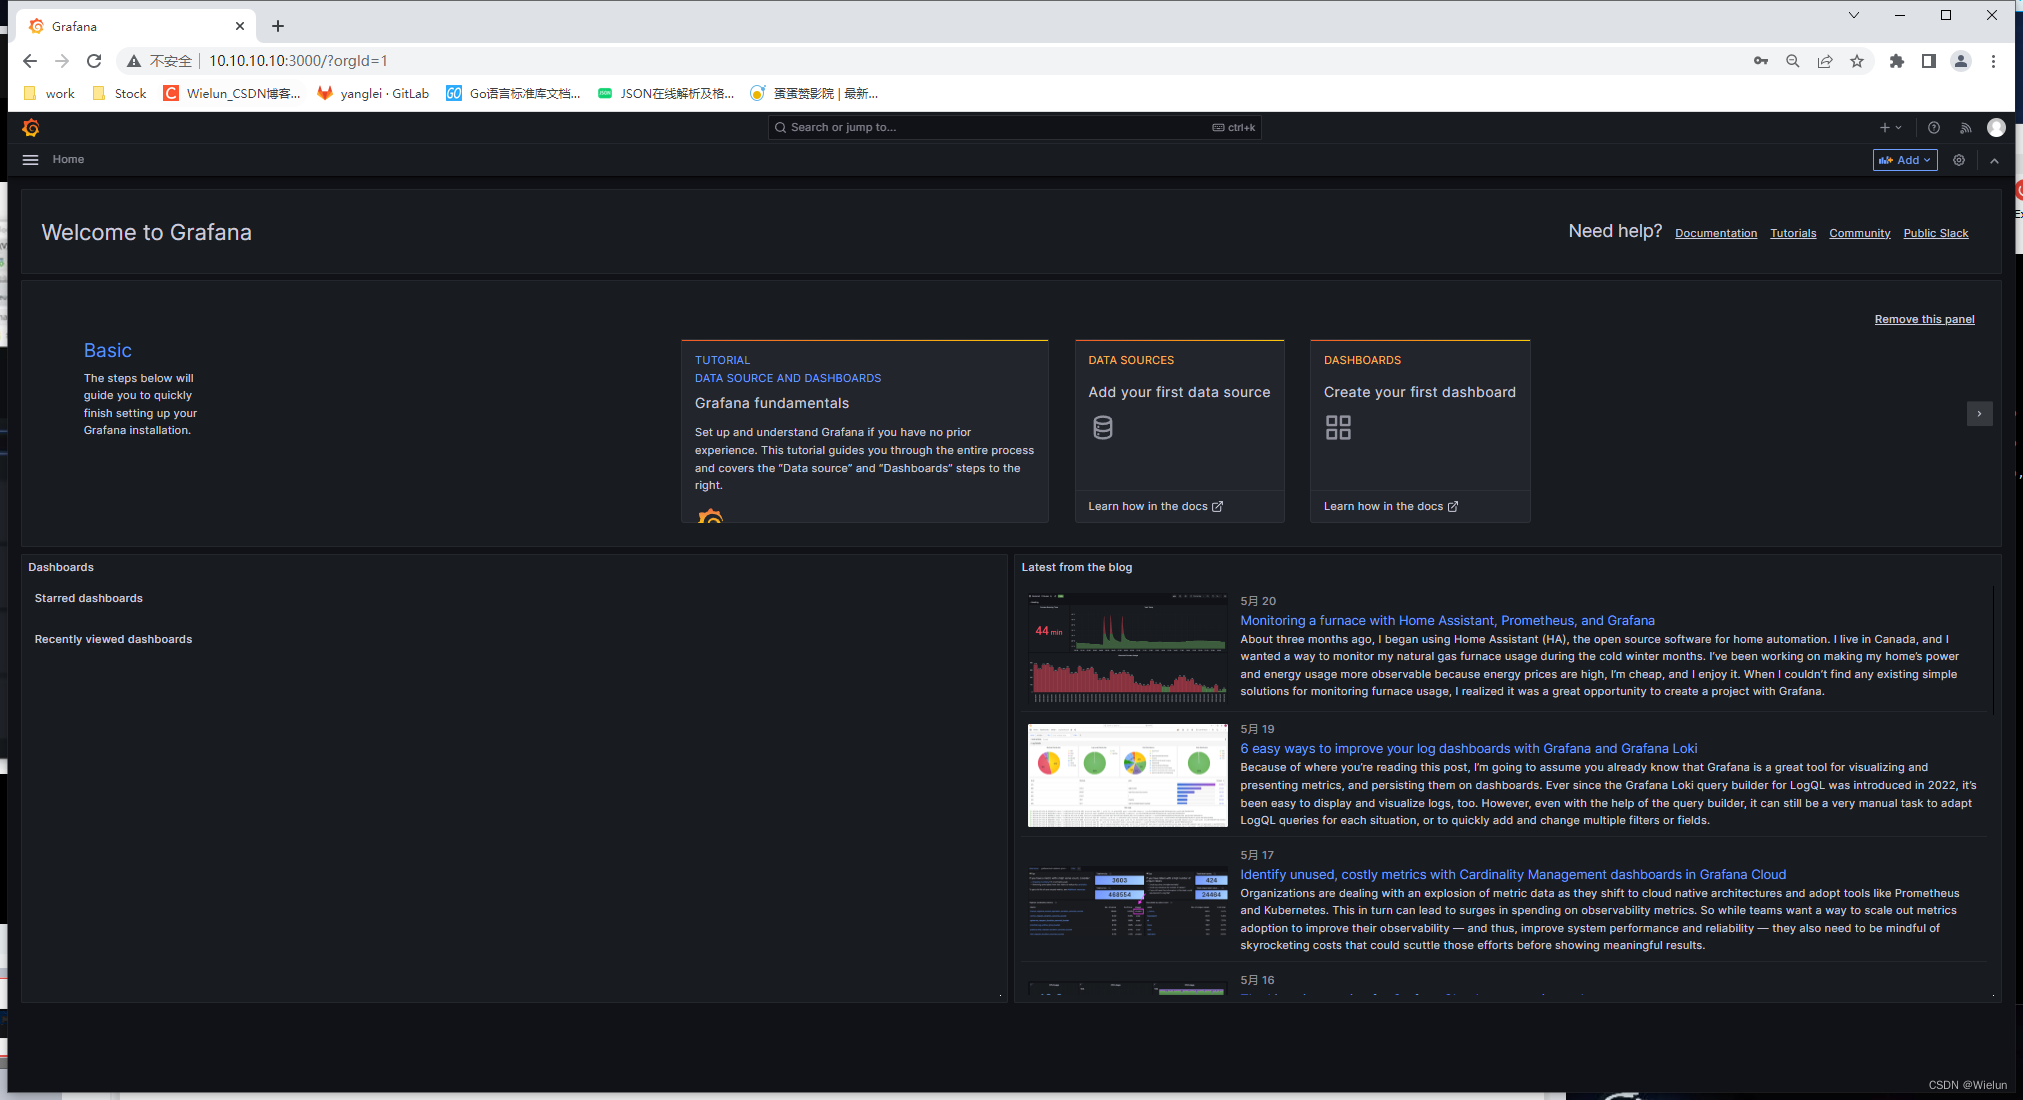
3、访问登录
http://10.10.10.10:3000/login
直接输入账号密码设置即可,默认admin/admin
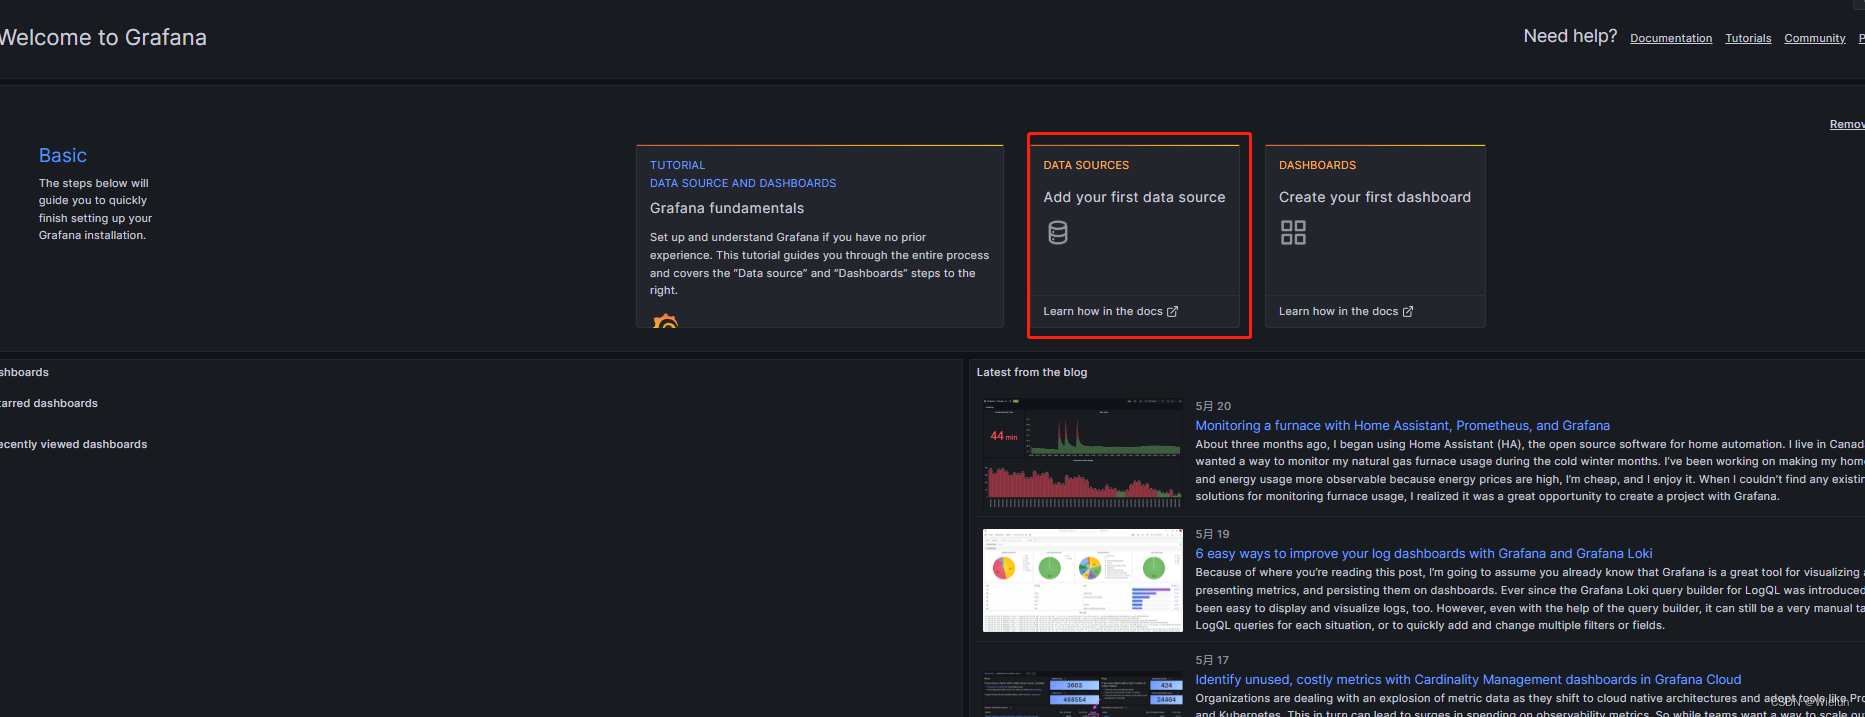
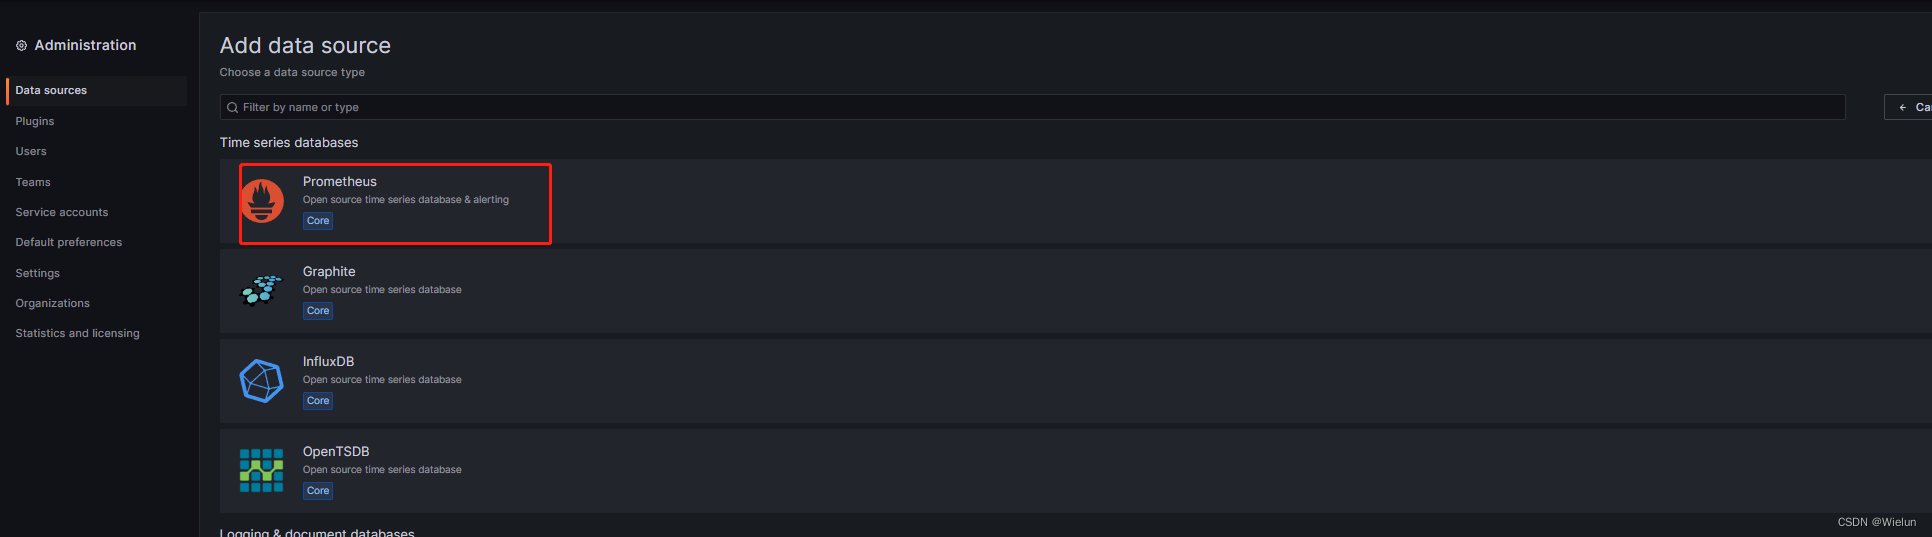
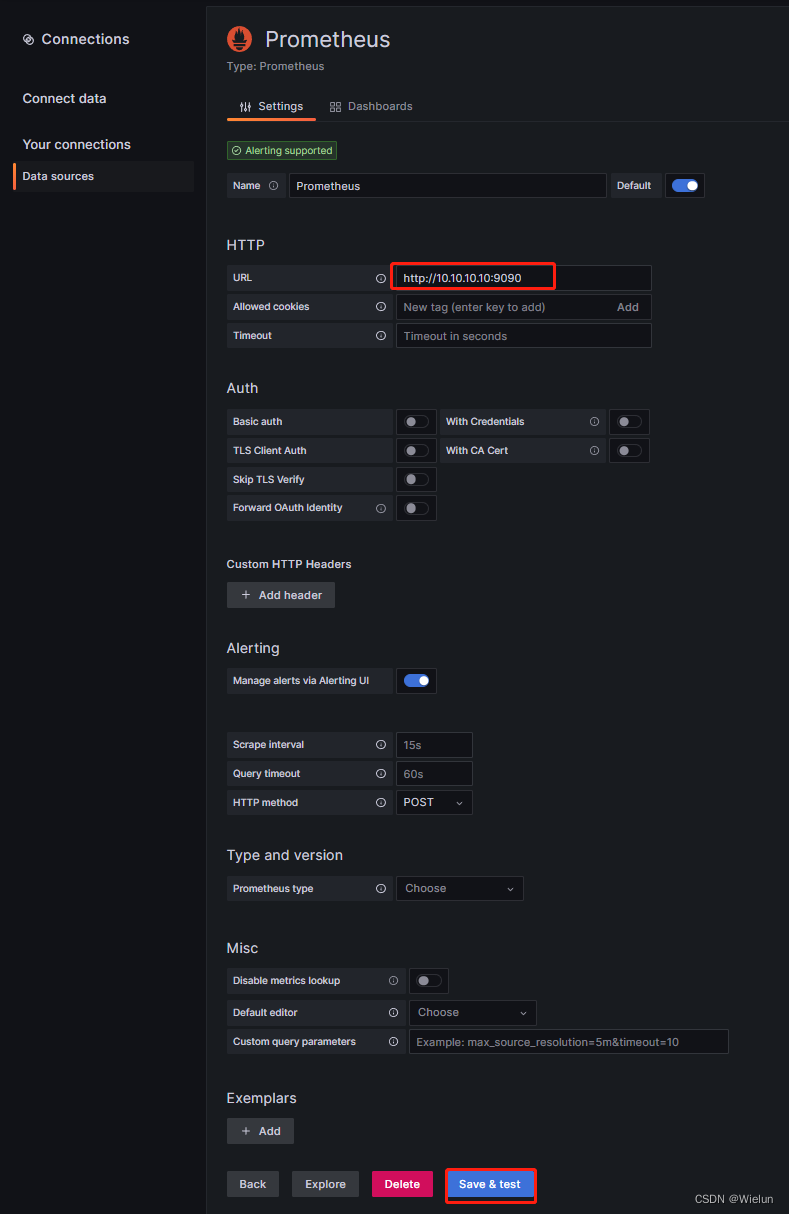
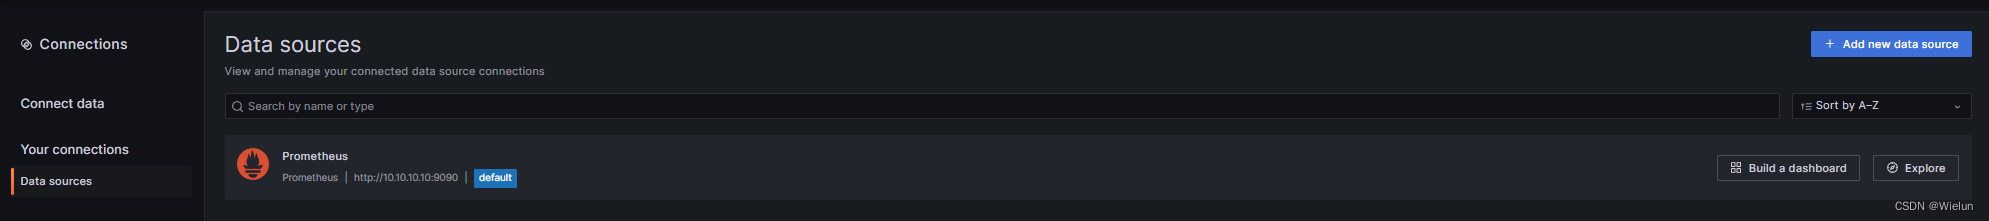
4、添加数据源
五、监控Linux服务器
1、安装node_exporter
node_exporter:用于监控Linux系统的指标采集器。
使用文档:https://prometheus.io/docs/guides/node-exporter/
项目代码:https://github.com/prometheus/node_exporter
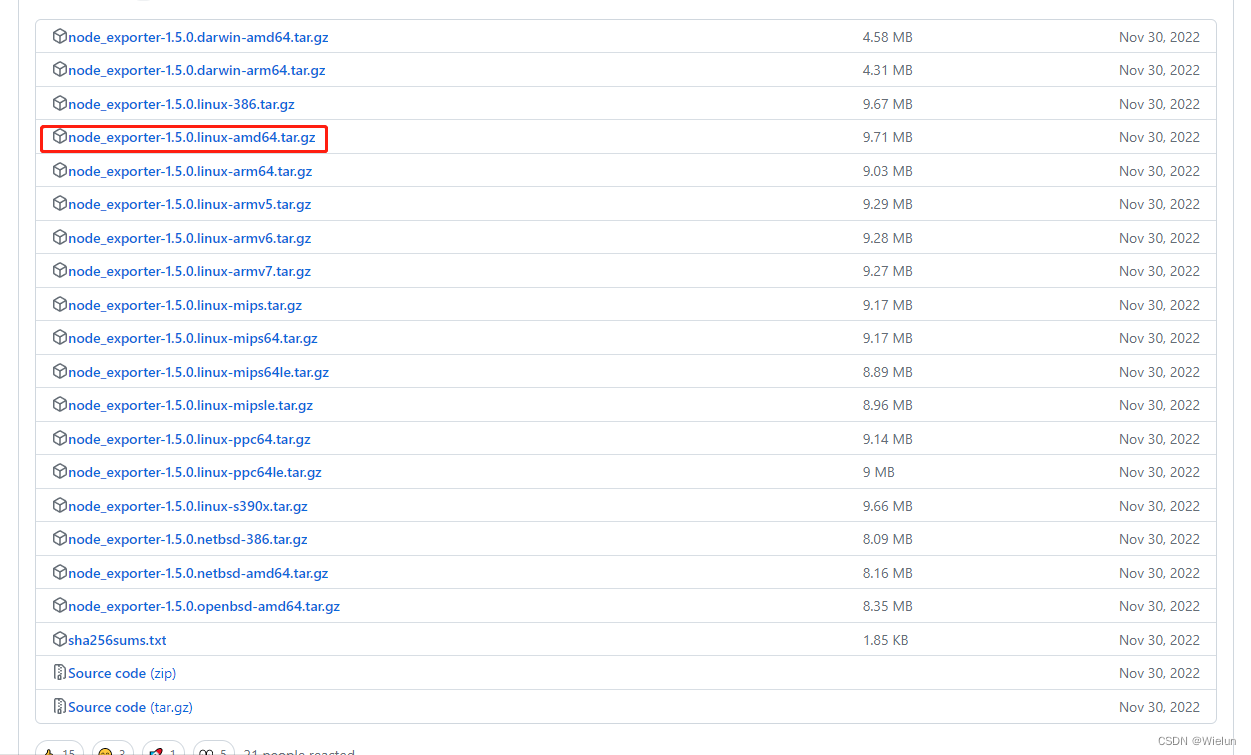
下载地址:https://github.com/prometheus/node_exporter/releases/tag/v1.5.0
[root@server1 ~]# tar xf node_exporter-1.5.0.linux-amd64.tar.gz
[root@server1 ~]# mv node_exporter-1.5.0.linux-amd64 /usr/local/node_exporter
[root@server1 ~]# cat /usr/lib/systemd/system/node_exporter.service
[Unit]
Description=node_exporter[Service]
ExecStart=/usr/local/node_exporter/node_exporter
ExecReload=/bin/kill -HUP $MAINPID
KillMode=process
Restart=on-failure[Install]
WantedBy=multi-user.target[root@server1 ~]# systemctl daemon-reload
[root@server1 ~]# systemctl enable node_exporter && systemctl start node_exporter
[root@server1 ~]# netstat -lntup|grep 9100
tcp6       0      0 :::9100                 :::*                    LISTEN      4136/node_exporter
2、配置prometheus.yml
[root@jenkins ~]# cat Prometheus/prometheus.yml
# my global config
global:scrape_interval: 15s # Set the scrape interval to every 15 seconds. Default is every 1 minute.evaluation_interval: 15s # Evaluate rules every 15 seconds. The default is every 1 minute.# scrape_timeout is set to the global default (10s).# Alertmanager configuration
alerting:alertmanagers:- static_configs:- targets:# - alertmanager:9093# Load rules once and periodically evaluate them according to the global 'evaluation_interval'.
rule_files:# - "first_rules.yml"# - "second_rules.yml"# A scrape configuration containing exactly one endpoint to scrape:
# Here it's Prometheus itself.
scrape_configs:# The job name is added as a label `job=<job_name>` to any timeseries scraped from this config.- job_name: "prometheus"# metrics_path defaults to '/metrics'# scheme defaults to 'http'.static_configs:- targets: ["localhost:9090"]- job_name: "Linux Server"static_configs:- targets: ["10.10.10.11:9100"][root@jenkins ~]# docker restart prometheus
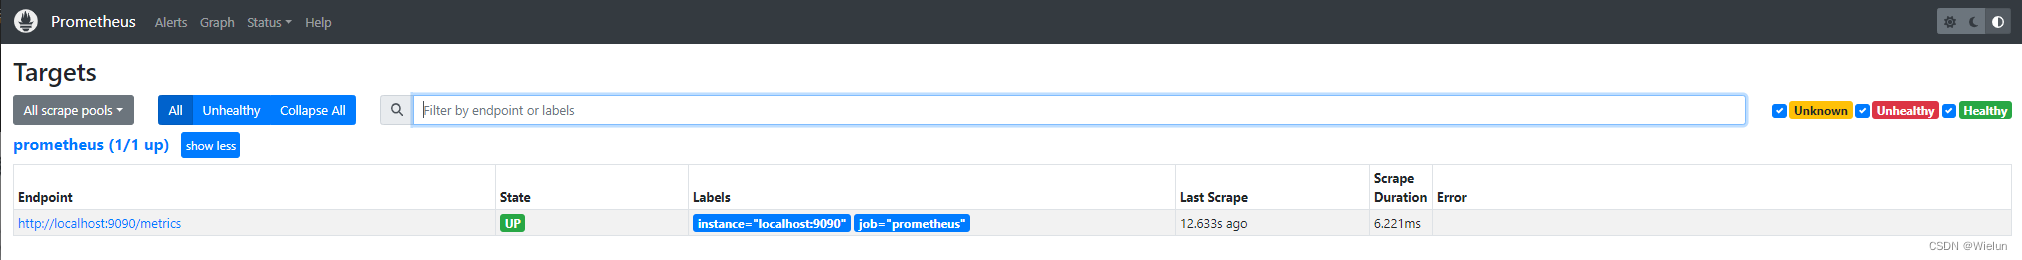
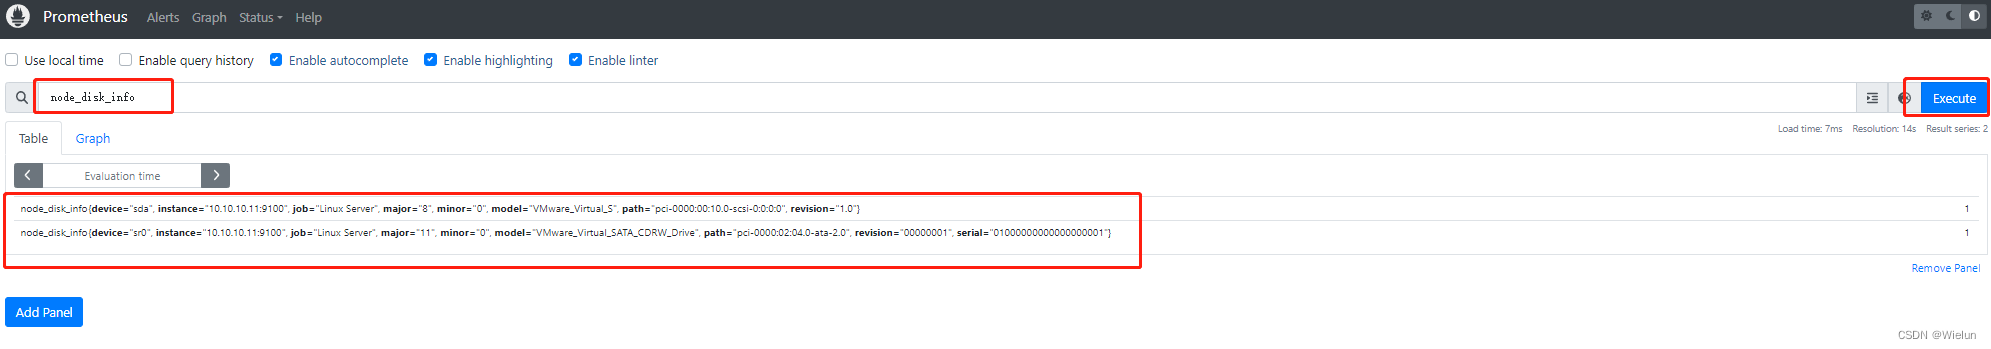
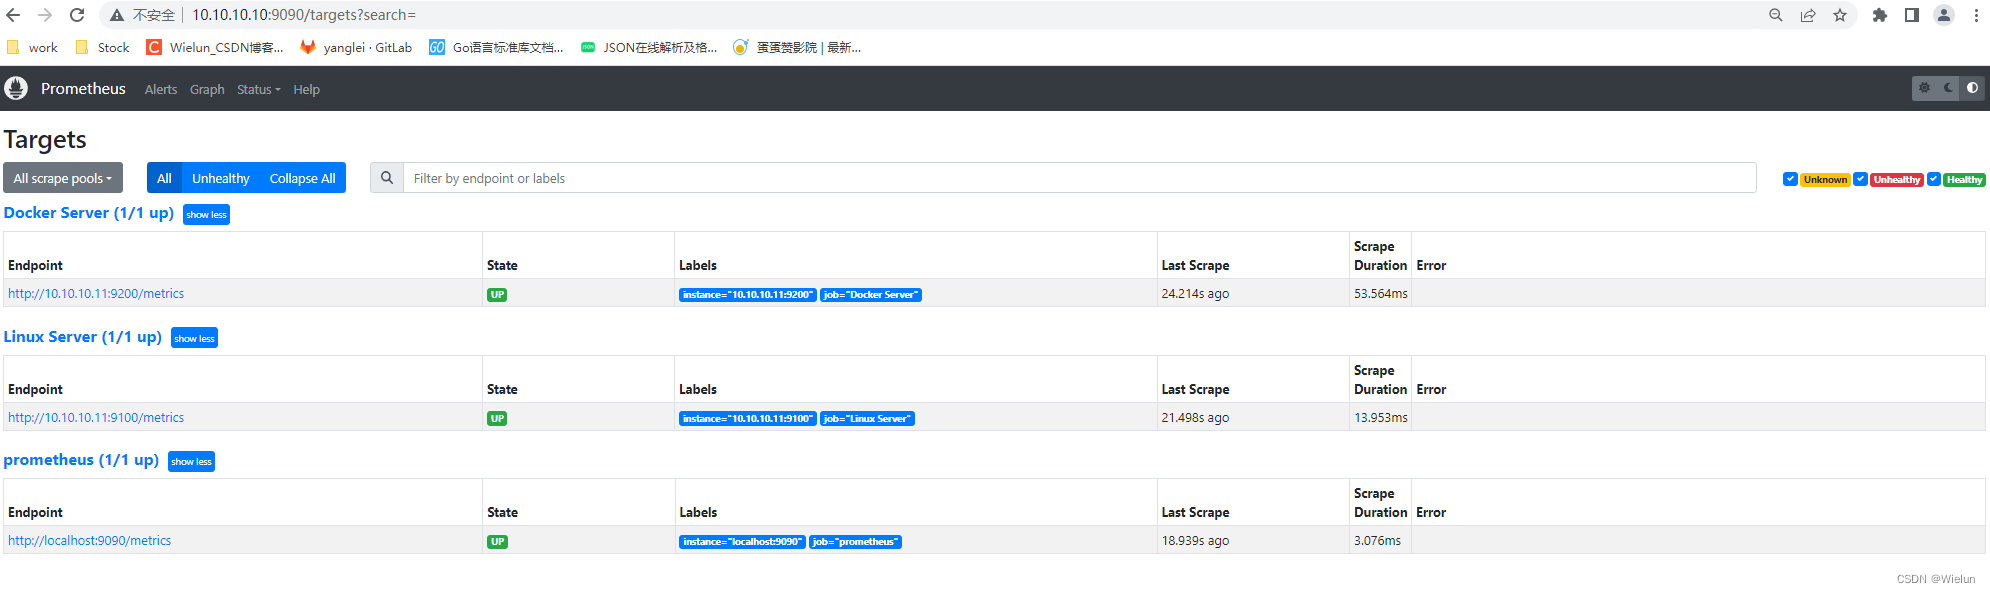
3、Prometheus测试
查看节点是否添加成功
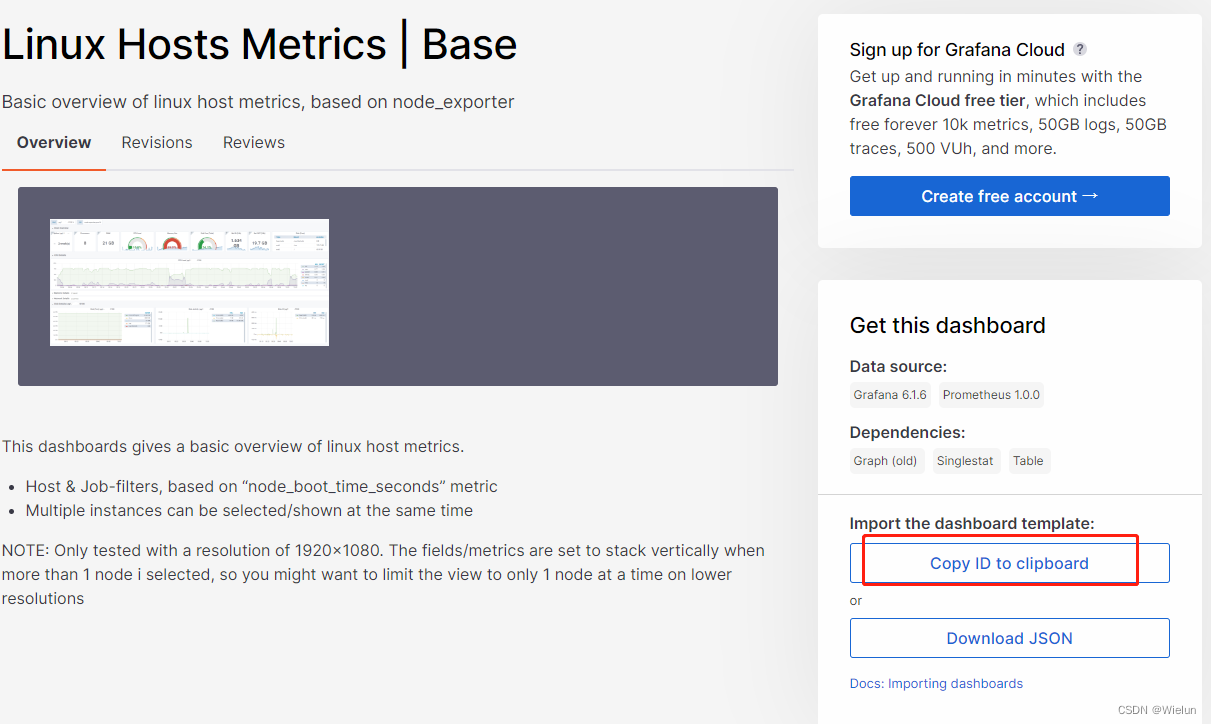
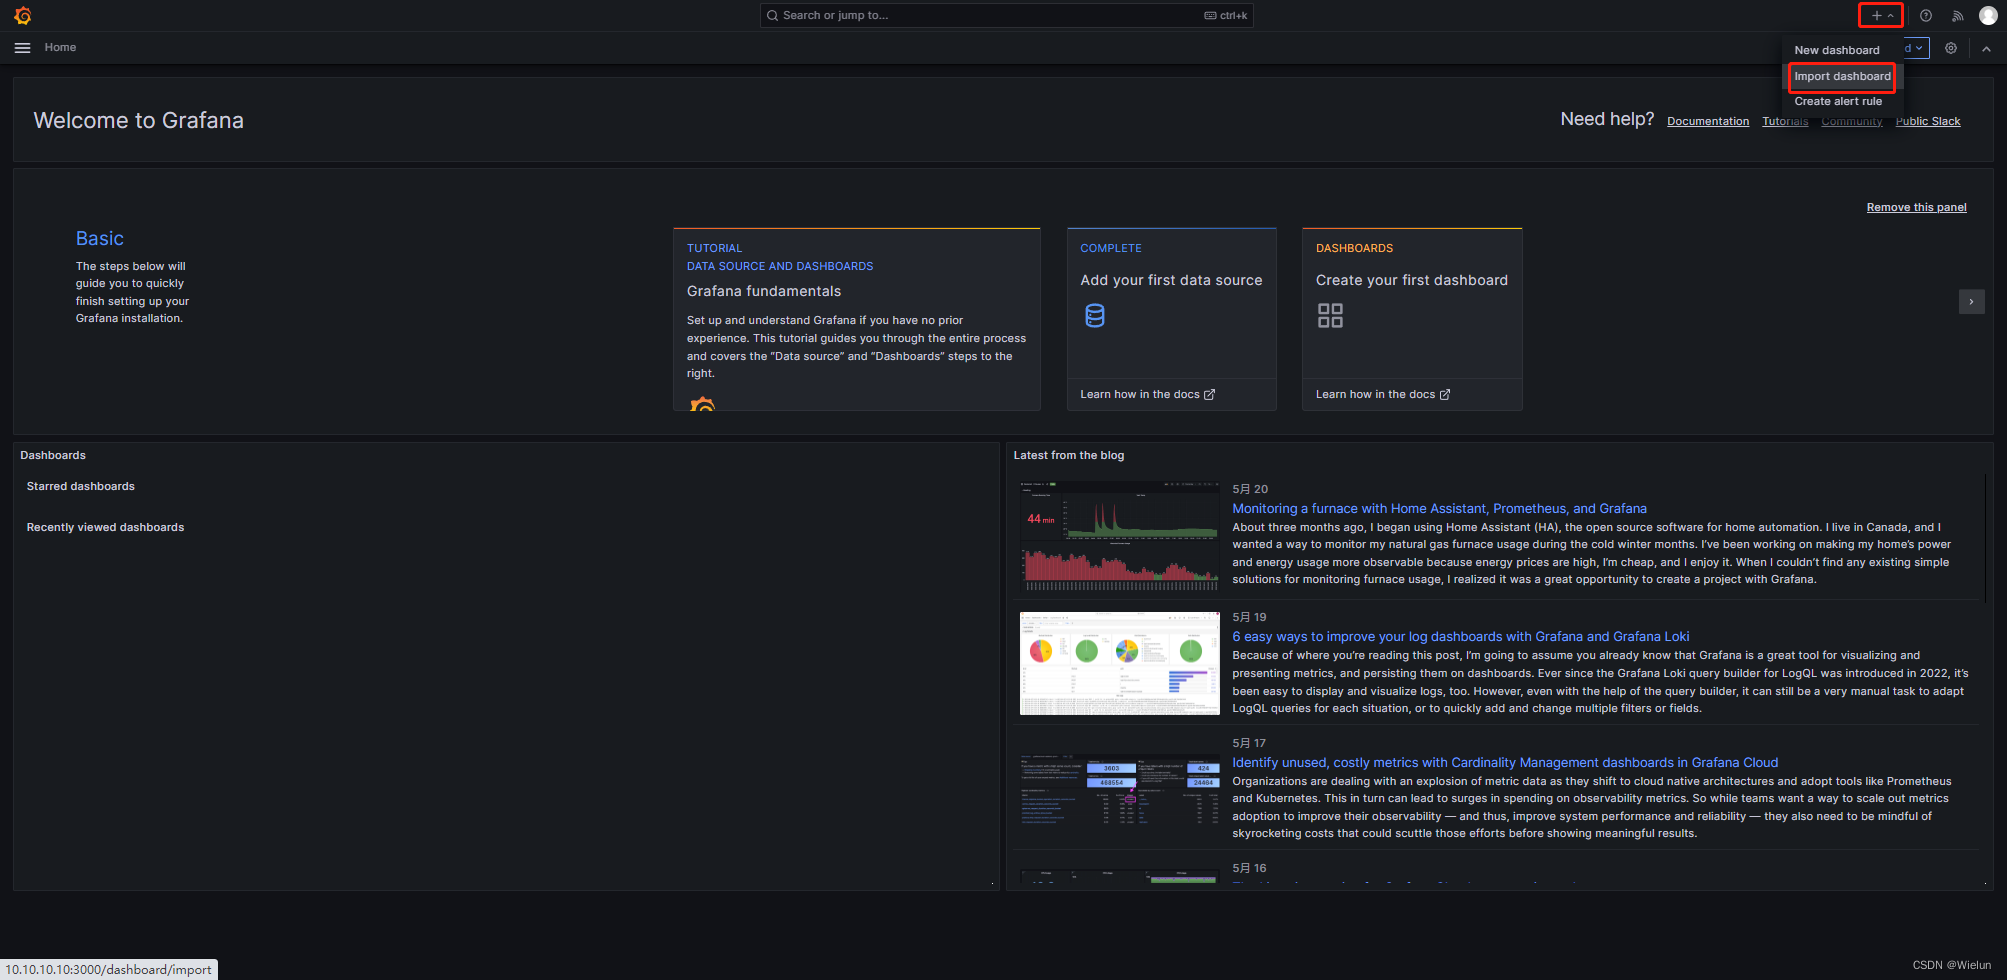
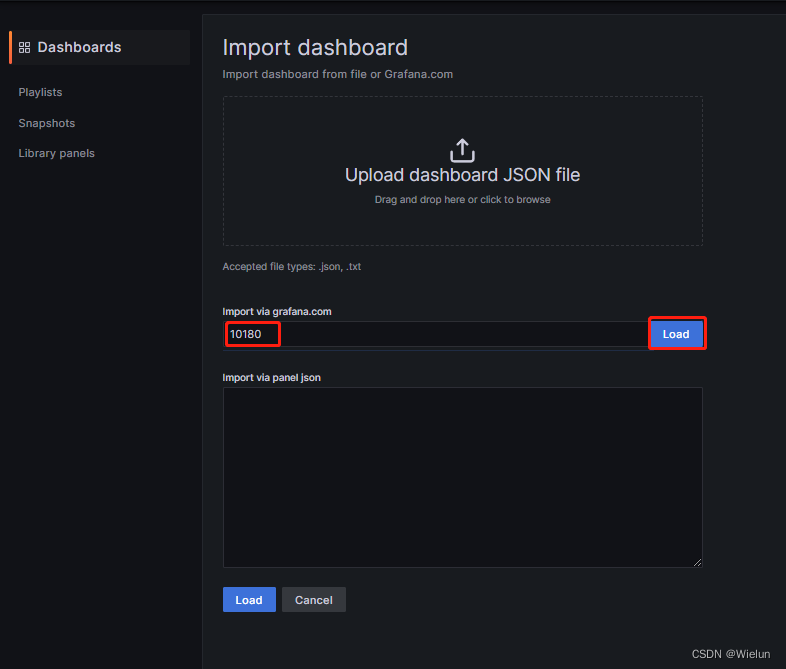
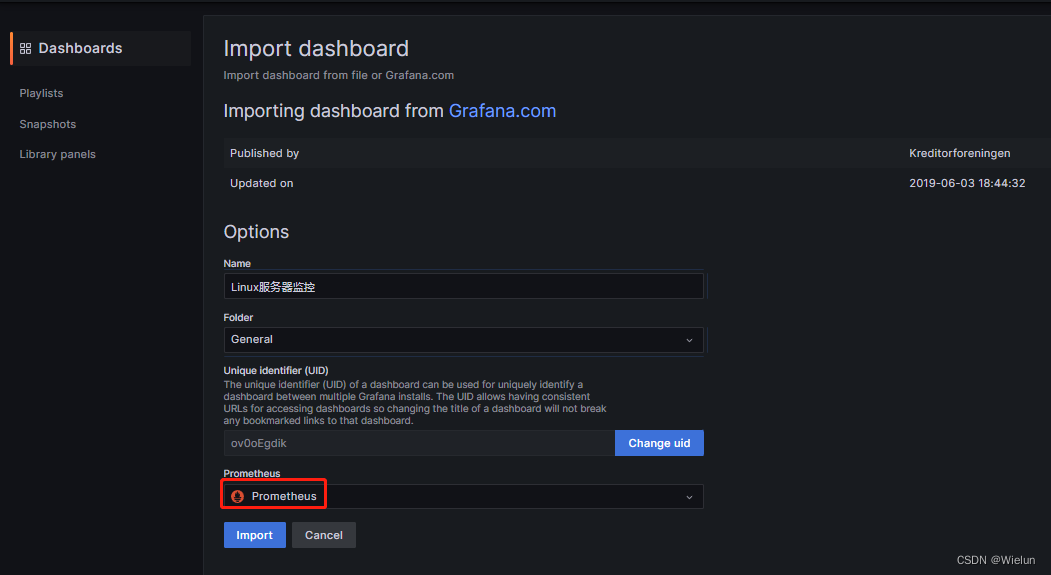
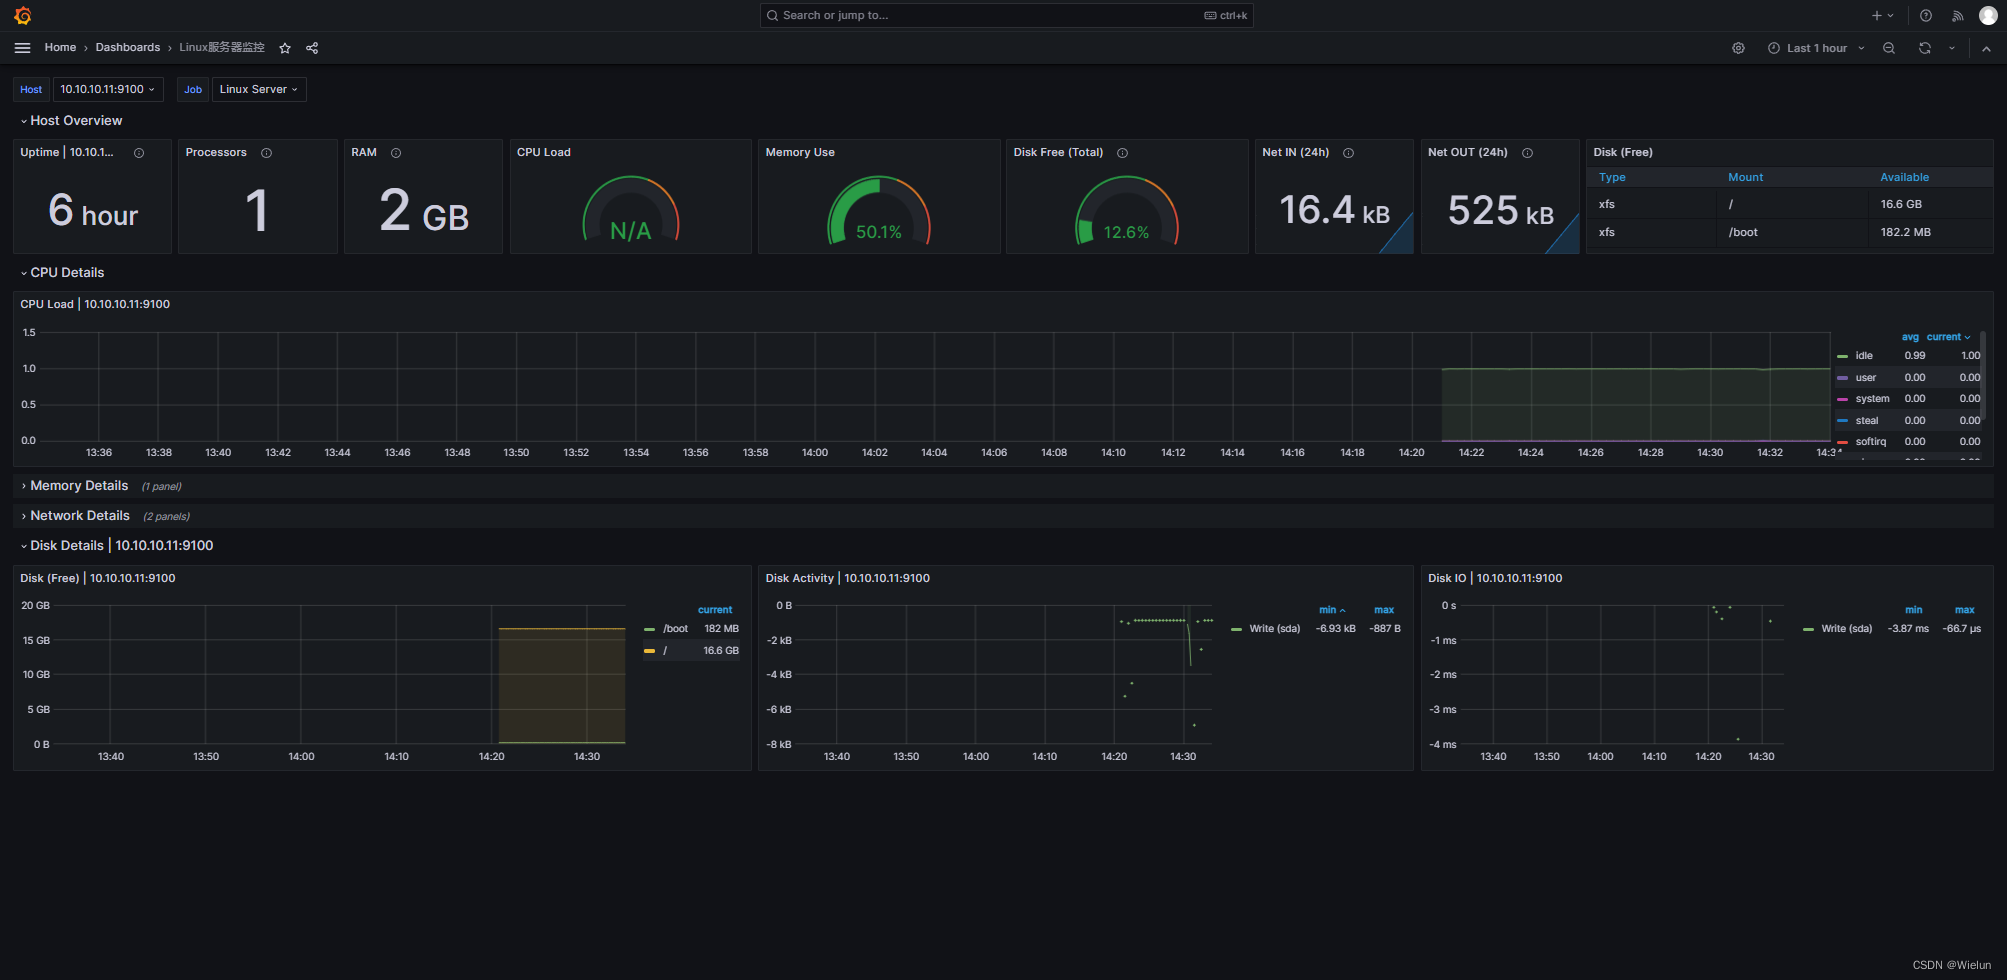
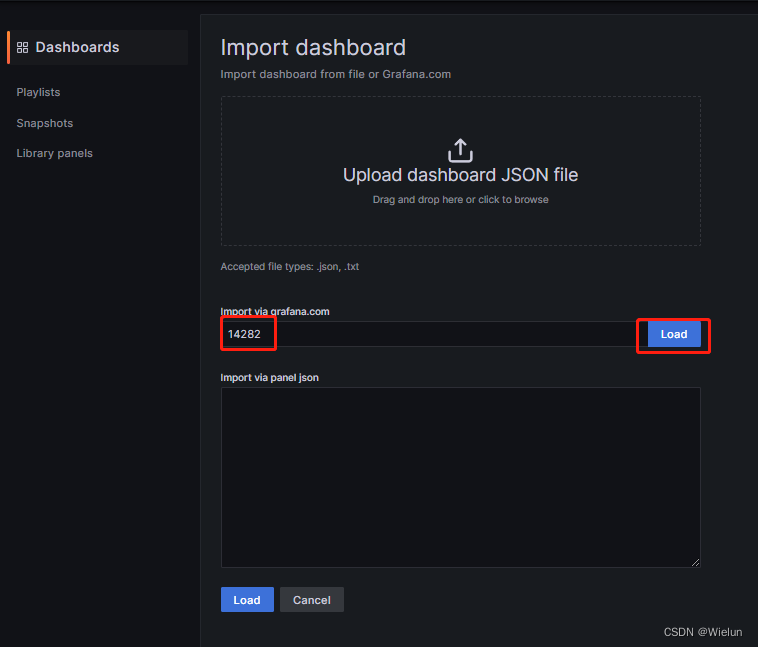
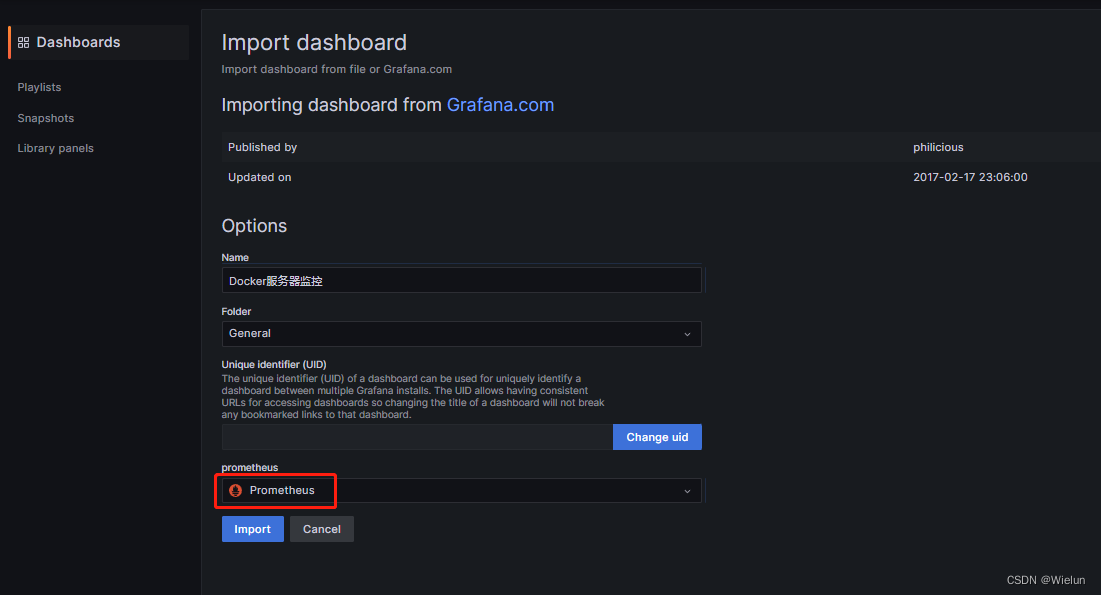
4、Grafana导入dashboard
dashboard模板地址: https://grafana.com/grafana/dashboards/
选择这个模板:https://grafana.com/grafana/dashboards/10180-kds-linux-hosts/
添加:
六、监控Docker服务器
1、安装cAdvisor
cAdvisor(Container Advisor):用于收集正在运行的容器资源使用和性能信息。
项目代码:https://github.com/google/cadvisor
docker run -d \
-v /:/rootfs:ro \
-v /var/run:/var/run:ro \
-v /sys:/sys:ro \
-v /var/lib/docker/:/var/lib/docker:ro \
-v /dev/disk/:/dev/disk:ro \
-p 9200:8080 \
--name=cadvisor \
google/cadvisor:latest[root@server1 ~]# docker ps -a
CONTAINER ID        IMAGE                    COMMAND                  CREATED             STATUS              PORTS                    NAMES
94926b13c0ba        google/cadvisor:latest   "/usr/bin/cadvisor -…"   10 seconds ago      Up 9 seconds        0.0.0.0:9200->8080/tcp   cadvisor
2、配置prometheus.yml
[root@jenkins ~]# cat Prometheus/prometheus.yml
# my global config
global:scrape_interval: 15s # Set the scrape interval to every 15 seconds. Default is every 1 minute.evaluation_interval: 15s # Evaluate rules every 15 seconds. The default is every 1 minute.# scrape_timeout is set to the global default (10s).# Alertmanager configuration
alerting:alertmanagers:- static_configs:- targets:# - alertmanager:9093# Load rules once and periodically evaluate them according to the global 'evaluation_interval'.
rule_files:# - "first_rules.yml"# - "second_rules.yml"# A scrape configuration containing exactly one endpoint to scrape:
# Here it's Prometheus itself.
scrape_configs:# The job name is added as a label `job=<job_name>` to any timeseries scraped from this config.- job_name: "prometheus"# metrics_path defaults to '/metrics'# scheme defaults to 'http'.static_configs:- targets: ["localhost:9090"]- job_name: "Linux Server"static_configs:- targets: ["10.10.10.11:9100"]- job_name: "Docker Server"static_configs:- targets: ["10.10.10.11:9200"][root@jenkins ~]# docker restart prometheus
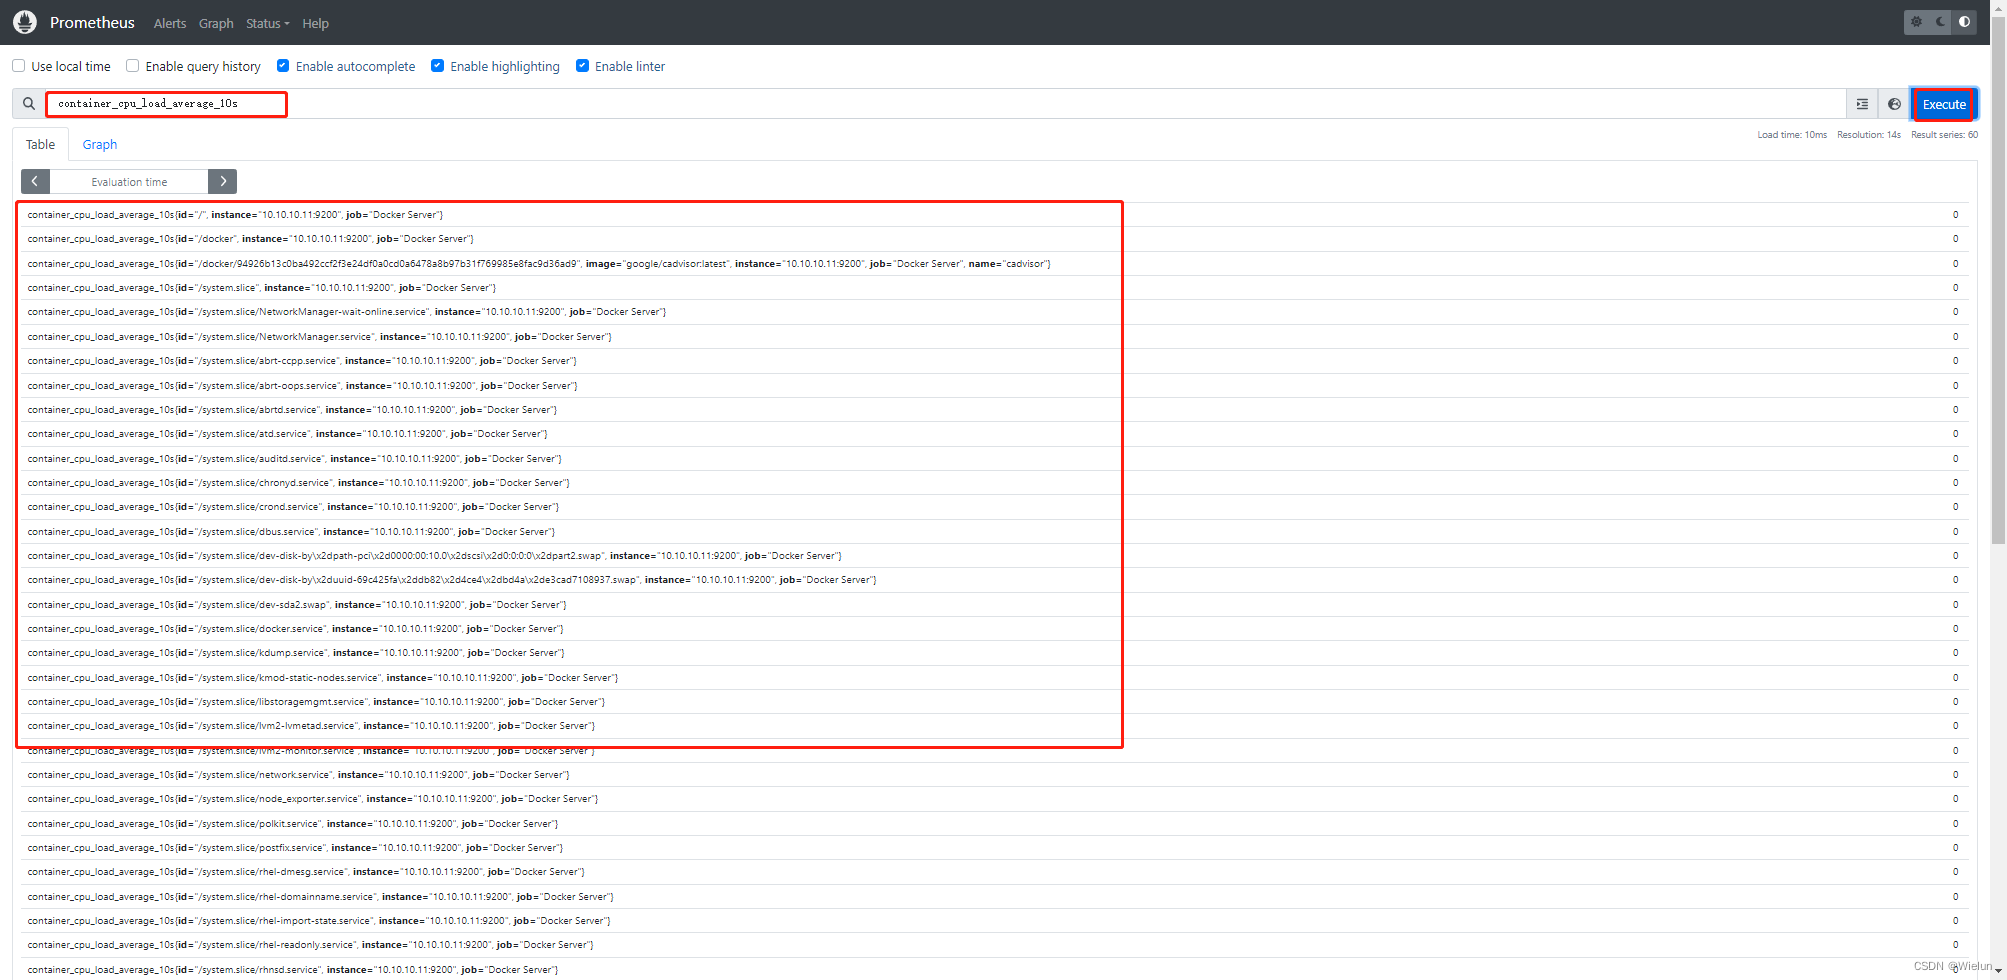
3、Prometheus测试
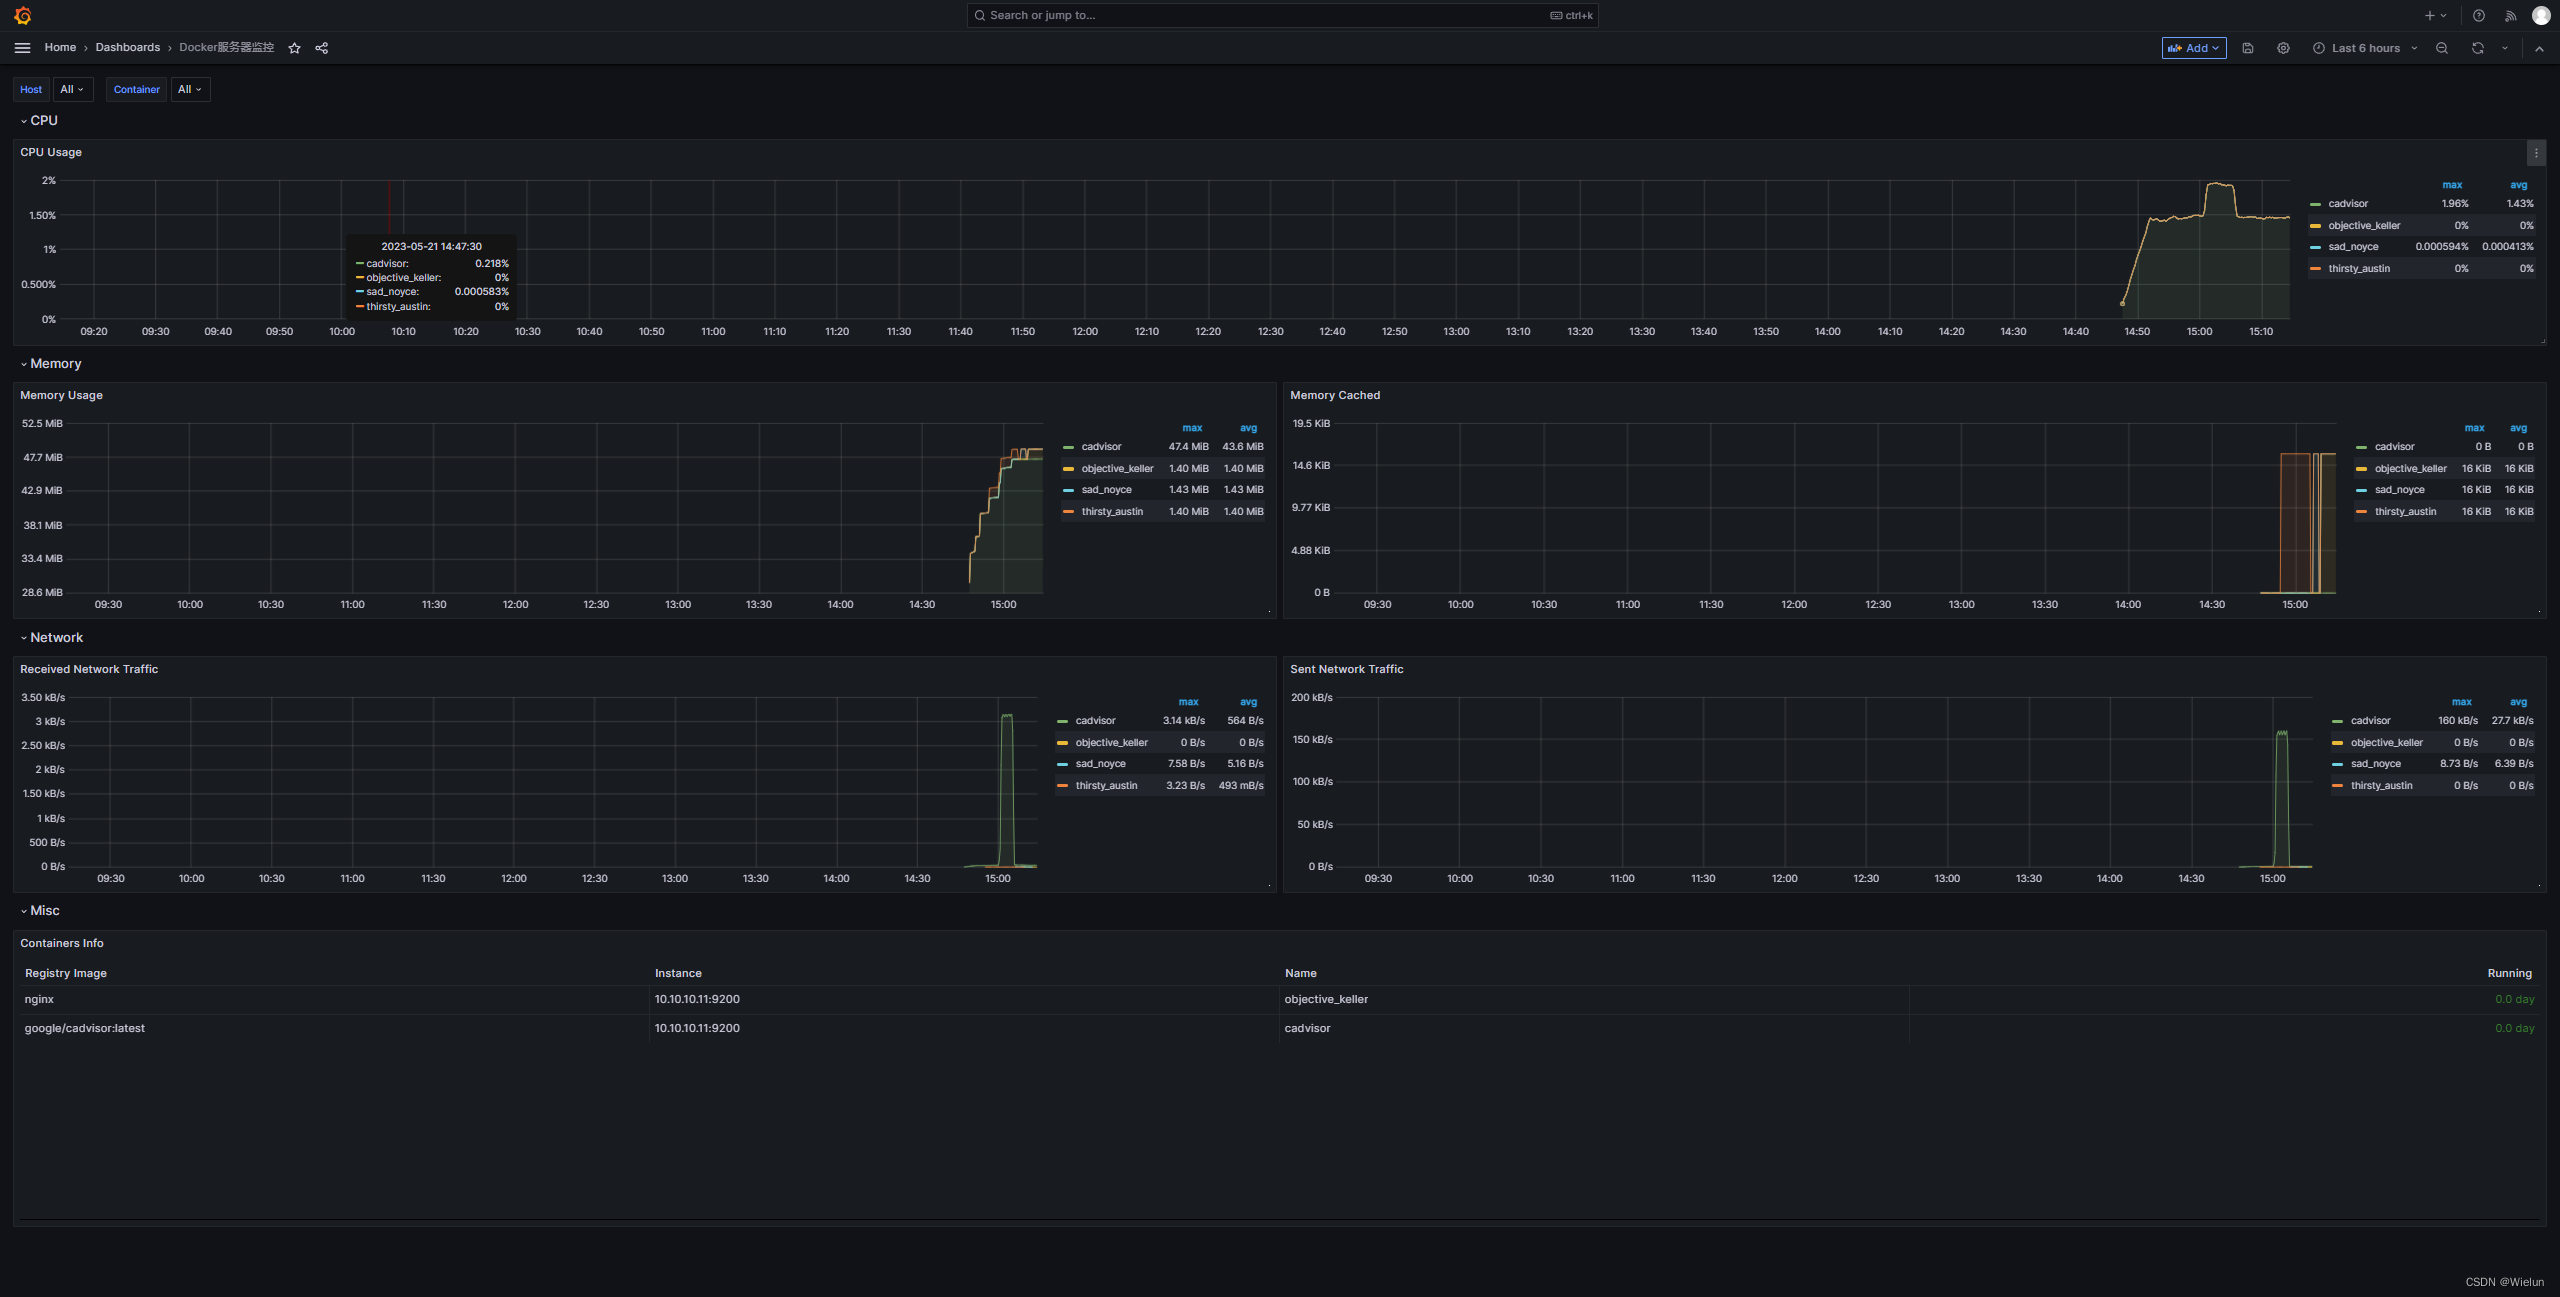
4、Grafana导入dashboard
5、docker nginx测试
[root@server1 ~]# docker run -d nginx
相关文章:
Prometheus+Grafana监控系统
一、简介 1、Prometheus简介 官网:https://prometheus.io 项目代码:https://github.com/prometheus Prometheus(普罗米修斯)是一个最初在SoundCloud上构建的监控系统。自2012年成为社区开源项目,拥有非常活跃的开发人员…...

基于脉冲神经网络的物体检测
访问【WRITE-BUG数字空间】_[内附完整源码和文档] 研究的意义在于探索脉冲神经网络在目标检测上的应用,目前主流的脉冲神经网络训练算法有直接BP训练、STDP无监督训练和训练好的ANN的转化,虽然训练算法众多,但是SNN仍然没有一套成熟的训练算…...

Rust每日一练(Leetday0010) 子串下标、两数相除、串联子串
目录 28. 找出字符串中第一个匹配项的下标 Find-the-index-of-the-first-occurrence-in-a-string 🌟🌟 29. 两数相除 Divide Two Integers 🌟🌟 30. 串联所有单词的子串 Substring-with-concatenation-of-all-words &#x…...

As ccess 数据库与表的操作
1. Access 数据库设计的一般步骤 . 2. 基本概念:Access 数据库、表、记录、字段 . 3. 使用表设计器创建表 (1)字段名命名规则 不能空格开头、不能用.!()[]、最长 64 个字符 (2)字段类型:文本、数字、日期/时…...

自动化的测试工具
1, 自动化功能测试工具:QTP、selenium 2, 自动化性能测试功能:LoadRunner、jmeter 3, 自动化接口测试工具:Charles、soapUI、LoadRunner、jmeter、postman、 测试工具 4, 测试管理工…...

Host头攻击
转载与:https://blog.csdn.net/weixin_47723270/article/details/129472716 01 HOST头部攻击漏洞知识 Host首部字段是HTTP/1.1新增的,旨在告诉服务器,客户端请求的主机名和端口号,主要用来实现虚拟主机技术。 运用虚拟主机技术&a…...

Android 12.0默认开启无障碍服务权限和打开默认apk无障碍服务
1.概述 在12.0的系统rom定制化开发中,在第三方app开发中,需要开启无障碍服务功能,就不需要在代码中开启无障碍服务了, 为了简便就需要在系统中开启无障碍服务,来实现开启无障碍服务功能 2. 默认开启无障碍服务权限和打开默认apk无障碍服务核心代码 frameworks/base/core…...

怎么成为优秀的软件工程师,而不是优秀的码农?
作为软件行业的从业者,每个人都希望最终成为优秀的软件工程师,而不仅仅是码农。一个码农只关注于编写代码和解决问题,而一个软件工程师则涉及到更广泛的职责和技能。 以下是一些要点,可以帮助你脱颖而出,成为一个优秀…...
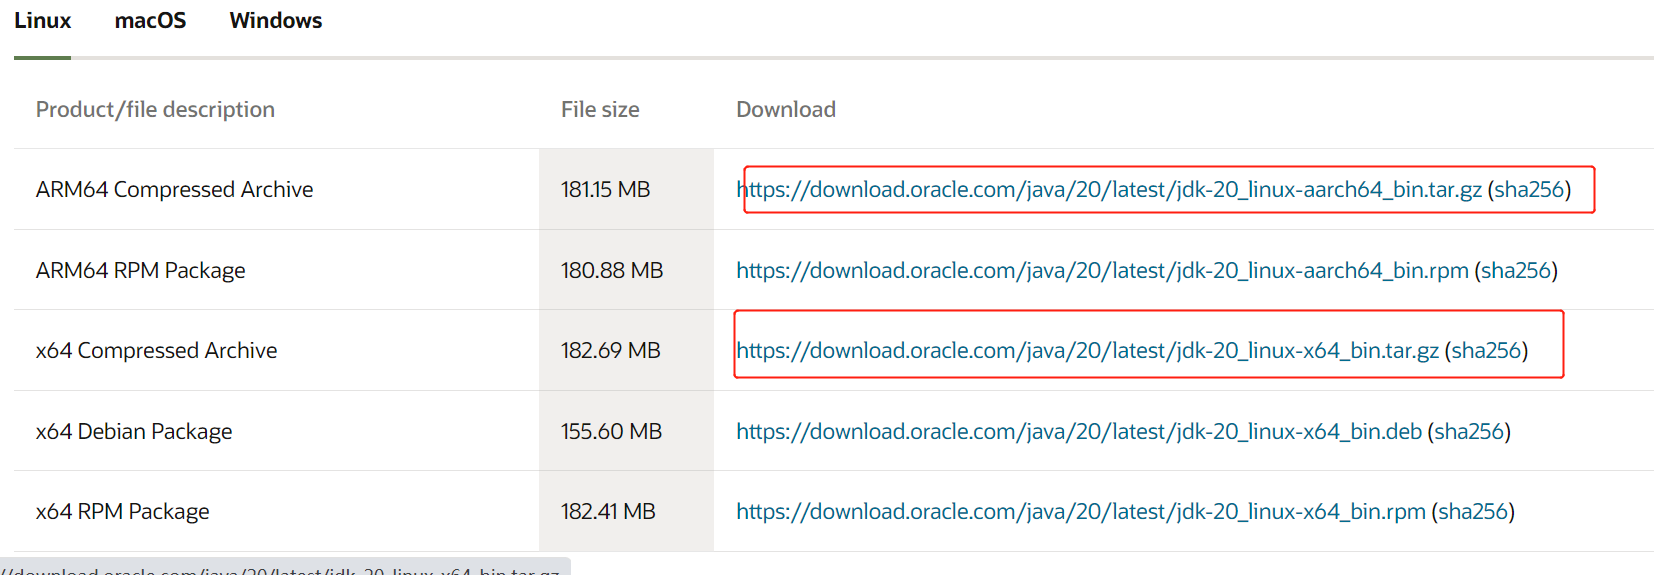
安装ElasticSearch之前的准备工作jdk的安装
一.windows 下载jdk的软件 (1).进入jdk1.8官网 (2).根据电脑是32位还是64位按需下载 (3).点击下载之后就会跳转到Oracle账号登录界面 没有 Oracle账号的注册一下就可以了 下载好的jdk如下: 双击下一步下一步安装jdk 默认安装就可以了 配置环境变量 (1).电脑左下方设置选项 (2).…...
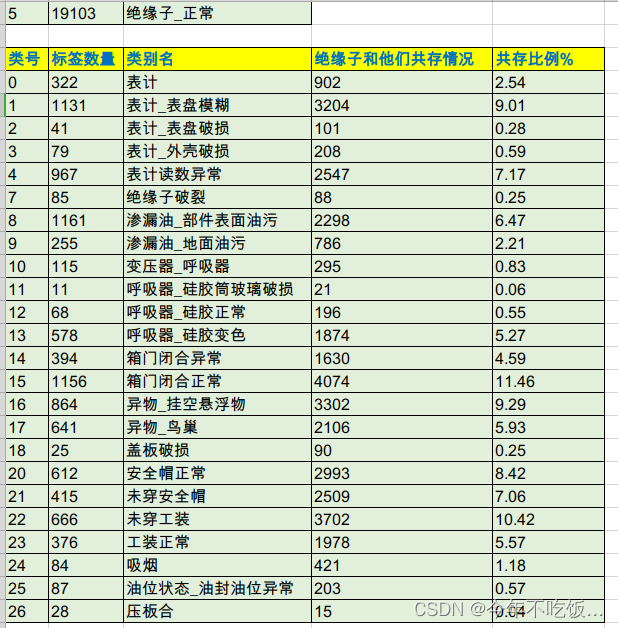
复杂数据集,召回、精度等突破方法记录【以电科院过检识别模型为参考】
目录 一、数据分析与数据集构建 二、所有相关的脚本 三、模型效果 一、数据分析与数据集构建 由于电科院数据集有17w-18w张,标签错误的非常多,且漏标非常多,但是所有有效时间只有半个月左右,显卡是M60,训练速度特别…...

那些你不得不会的提高工作效率的软件神器
那些你不得不会的提高工作效率的软件神器 文本编辑器 vscode 跨平台,插件丰富。 code-server vscode服务器版本,可以在浏览器中开发调试代码,尤其适用于windows端开发linux服务器程序。 vim linux/unix/mac终端最强大的文本编辑器。 note…...

【VMware】Ubunt 20.04时间设置
文章目录 设置本地时间 UTC8设置24小时制同步网络时间参考 Talk is cheap, show me the code. 设置本地时间 UTC8 查看当前时区状态 rootnode1:~/k8s# timedatectlLocal time: Sun 2023-05-21 15:24:02 CSTUniversal time: Sun 2023-05-21 07:24:02 UTCRTC time: Sun 2023-05-2…...
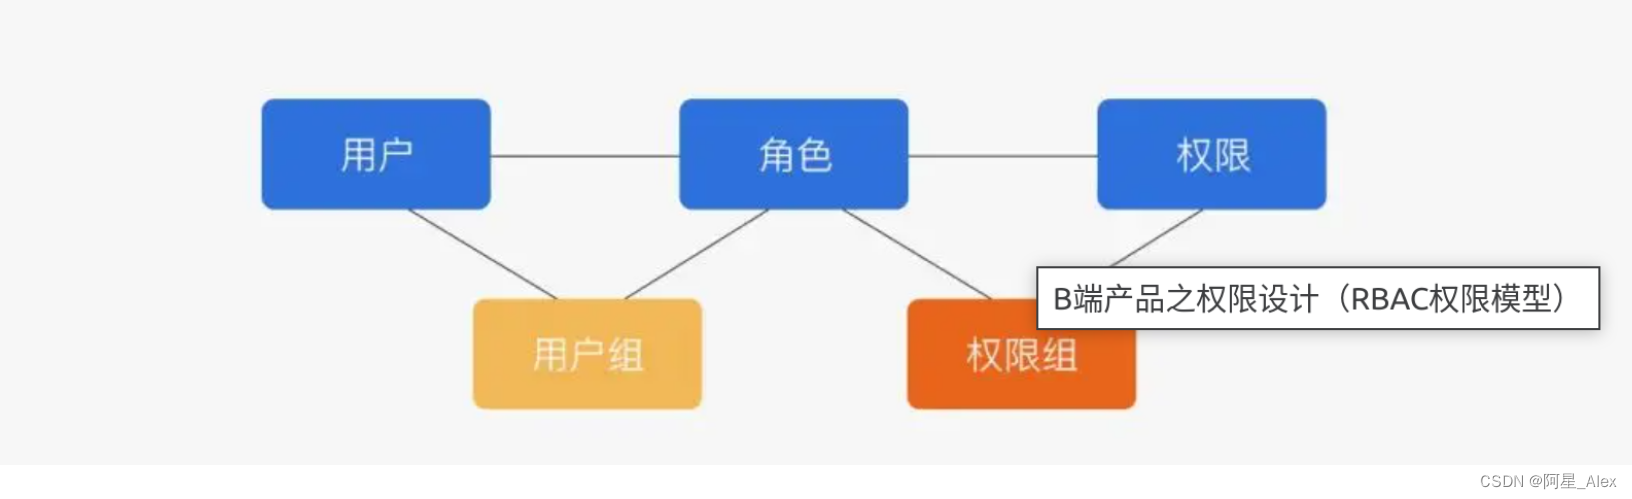
单点登录三:添加RBAC权限校验模型功能理解及实现demo
1、RBAC权限模型 RBAC(Role-Based Access Control)是一种基于角色的访问控制模型,用于管理系统中用户的权限和访问控制。它将用户、角色和权限之间的关系进行了明确的定义,以实现灵活的权限管理和控制。 1.1、RBAC模型主要包括以…...
)
基于用户认证数据构建评估模型预测认证行为风险系统(附源码)
文件说明 datasets // 数据集(训练集、测试集) feature engineering // 特征工程 models // 评估模型 测试环境 Python3.8 任务描述 项目来自系统认证风险预测https://www.datafountain.cn/competitions/537 项目完整源码下载:https://download.csdn.net/download/liu…...

本地训练中文LLaMA模型实战教程,民间羊驼模型,24G显存盘它!
羊驼实战系列索引 博文1:本地部署中文LLaMA模型实战教程,民间羊驼模型 博文2:本地训练中文LLaMA模型实战教程,民间羊驼模型(本博客) 博文3:精调训练中文LLaMA模型实战教程,民间羊驼模型(马上发布) 简介 在学习完上篇【1本地部署中文LLaMA模型实战教程,民间羊驼模…...

快速学Go依赖注入工具wire
Go相对java和C是较新的语言,但也有诸多优秀特性及生态库。本文介绍大多数软件工程中常用的功能:依赖注入。首先介绍什么是依赖注入,go实现库wire与其他语言的差异。然后通过简单示例实现依赖注入,简化代码、提升可读性。 依赖注入…...
流程控制语句)
python入门(4)流程控制语句
1. 条件判断语句 条件控制语句用于根据条件来决定程序的执行路径。在Python中,常见的条件控制语句有以下几种: (1)if语句:用于执行满足条件的代码块。示例代码: age 20 if age > 18:print("成年…...

【进阶】C 语言表驱动法编程原理与实践
数据压倒一切。如果选择了正确的数据结构并把一切组织的井井有条,正确的算法就不言自明。编程的核心是数据结构,而不是算法。——Rob Pike 目录 说明 概念提出 查表方式 直接查找 索引查找 分段查找 实战示例 字符统计 月天校验 名称构造 值名…...

java+springboot留学生新闻资讯网的设计与实现
Spring框架是Java平台的一个开放源代码的Full-stack(全栈)应用程序框架,和控制翻转容器的实现。Spring框架的一些核心功能理论,可以用于所有Java应用,Spring还为Java EE构建的Web应用提供大量的扩展支持。Spring框架没有实现任何的编程模型&a…...

分布式事务与分布式锁区别及概念学习
一、 分布式事务 1.1 背景 传统事务ACID是基于单数据库的本地事务,仅支持单机事务,并不支持跨库事务。但随着微服务架构的普及,业务的分库分表导致一个大型业务系统往往由若干个子系统构成,这些子系统又拥有各自独立的数据库。往往一个业务流程需要由多个子系统共同完成,…...

DeepSeek免费额度到底能跑几个大模型?揭秘2024最新配额规则与5个隐藏续费技巧
更多请点击: https://codechina.net 第一章:DeepSeek免费额度到底能跑几个大模型? DeepSeek 官方为新注册用户提供 100 万 Token 的免费调用额度(截至 2024 年底政策),但不同模型的 Token 消耗差异显著——…...

忘记压缩包密码不用慌:3步自动化找回加密文件的终极方案
忘记压缩包密码不用慌:3步自动化找回加密文件的终极方案 【免费下载链接】ArchivePasswordTestTool 利用7zip测试压缩包的功能 对加密压缩包进行自动化测试密码 项目地址: https://gitcode.com/gh_mirrors/ar/ArchivePasswordTestTool 你是否曾经面对一个加密…...
)
ssm仓库管理信息系统(10091)
有需要的同学,源代码和配套文档领取,加文章最下方的名片哦 一、项目演示 项目演示视频 二、资料介绍 完整源代码(前后端源代码SQL脚本)配套文档(LWPPT开题报告/任务书)远程调试控屏包运行一键启动项目&…...

yuzu模拟器完全指南:解决PC上畅玩Switch游戏的5大难题
yuzu模拟器完全指南:解决PC上畅玩Switch游戏的5大难题 【免费下载链接】yuzu 任天堂 Switch 模拟器 项目地址: https://gitcode.com/GitHub_Trending/yu/yuzu yuzu是目前最受欢迎的开源任天堂Switch模拟器,让你能够在Windows、Linux和Android设备…...

【DeepSeek缓存策略设计权威指南】:20年架构师亲授5大核心原则与3类典型场景落地实践
更多请点击: https://intelliparadigm.com 第一章:DeepSeek缓存策略设计的演进脉络与核心挑战 DeepSeek系列模型在推理服务中对缓存机制提出了严苛要求:既要应对长上下文带来的KV缓存爆炸式增长,又要兼顾多用户并发、动态批处理与…...

独立开发者如何利用 Taotoken 的 Token Plan 降低项目长期成本
🚀 告别海外账号与网络限制!稳定直连全球优质大模型,限时半价接入中。 👉 点击领取海量免费额度 独立开发者如何利用 Taotoken 的 Token Plan 降低项目长期成本 对于独立开发者而言,项目的长期维护成本是必须精打细算…...

TestDisk PhotoRec:免费开源数据恢复工具的终极完整指南
TestDisk & PhotoRec:免费开源数据恢复工具的终极完整指南 【免费下载链接】testdisk TestDisk & PhotoRec 项目地址: https://gitcode.com/gh_mirrors/te/testdisk 当您不小心删除了重要文件,或者硬盘分区突然消失时,那种恐慌…...

Postman便携版技术解决方案:Windows平台免安装API开发实践指南
Postman便携版技术解决方案:Windows平台免安装API开发实践指南 【免费下载链接】postman-portable 🚀 Postman portable for Windows 项目地址: https://gitcode.com/gh_mirrors/po/postman-portable Postman便携版是基于Portapps框架构建的专业级…...

为什么92%的DeepSeek团队仍在手动调配额?揭秘v3.2+配额API自动化编排的4个关键接口与避坑清单
更多请点击: https://kaifayun.com 第一章:DeepSeek配额管理的现状困局与演进动因 当前,DeepSeek模型服务在多租户场景下面临日益突出的配额治理挑战。开发者普遍反馈配额分配僵化、实时性差、缺乏细粒度控制能力,导致高优先级任…...

机器学习中的不确定性原理:模型优化与误差评估的根本权衡
1. 项目概述:当机器学习遇见“测不准”在机器学习的日常实践中,我们常常面临一个看似矛盾的目标:既要让模型学得“好”(预测准),又要能说得清它“错”得怎么样(误差评估准)。我们习惯…...