MySQL优化篇-MySQL压力测试
备注:测试数据库版本为MySQL 8.0
MySQL压力测试概述
为什么压力测试很重要?因为压力测试是唯一方便有效的、可以学习系统在给定的工作负载下会发生什么的方法。压力测试可以观察系统在不同压力下的行为,评估系统的容量,掌握哪些是重要的变化,或者观察系统如何处理不同的数据。基准测试可以在系统实际负载之外创造一些虚构场景进行测试。
那么,我们测试一般测试哪些指标呢?
吞吐量
吞吐量指的是单位时间内的事务处理数,常用的测试单位是每秒事务数(TPS)。
响应时间或者延迟
这个指标用于测试任务所需的整体时间。
并发性
并发性是一个非常重要又经常被误解和误用的指标。
一个Web站点“同时有50000个用户”访问,却可能只有10~15个并发请求到MySQL数据库,因为每个用户并不是时时刻刻的都在发送请求到数据库。
可扩展性
在系统的业务压力可能发生变化的情况下,测试可扩展性就非常必要了。
压力测试的工具
测试工具-fio
FIO是测试IOPS的非常好的工具,用来对硬件进行压力测试和验证,支持13种不同的I/O 引擎,包括:sync,mmap, libaio, posixaio, SG v3, splice, null, network, syslet, guasi, solarisaio 等等。
fio 官网地址:http://freecode.com/projects/fio
FIO安装
wget http://brick.kernel.dk/snaps/fio-3.18.tar.gz
yum install libaio-devel
tar -zxvf fio-3.18.tar.gz
cd fio-3.18
make
make install
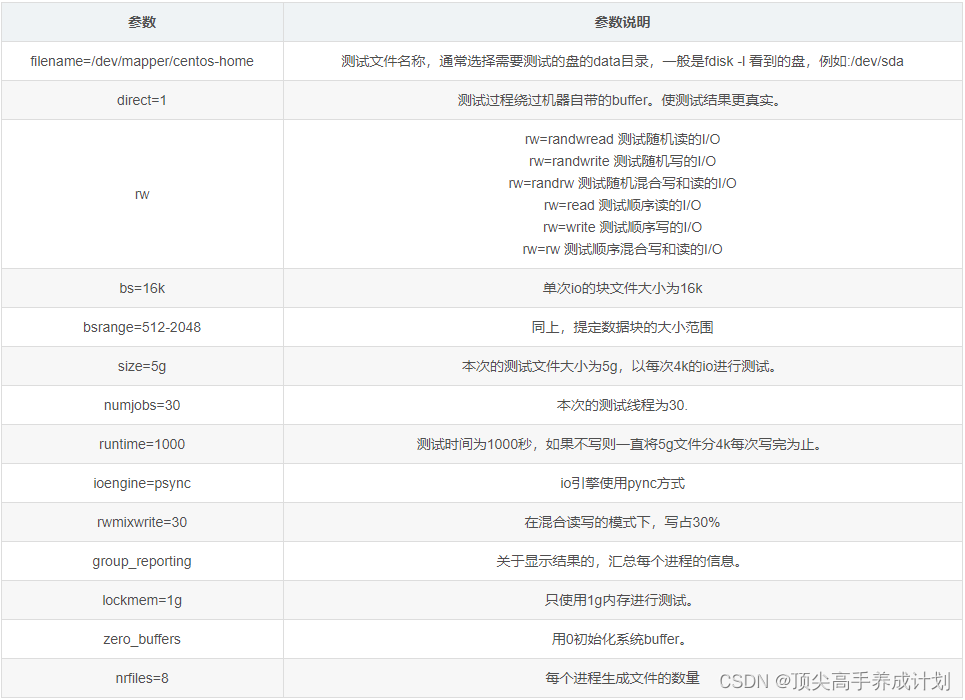
fio参数说明
测试用例
我们来测试一个随机读
代码:
fio -filename=/dev/mapper/centos-home -direct=1 -iodepth 1 -thread -rw=randread -ioengine=psync -bs=16k -size=10G -numjobs=10 -runtime=1000 -group_reporting -name=mytest
测试记录:
[root@10-31-1-119 software]# fio -filename=/dev/mapper/centos-home -direct=1 -iodepth 1 -thread -rw=randread -ioengine=psync -bs=16k -size=10G -numjobs=10 -runtime=1000 -group_reporting -name=mytest
mytest: (g=0): rw=randread, bs=(R) 16.0KiB-16.0KiB, (W) 16.0KiB-16.0KiB, (T) 16.0KiB-16.0KiB, ioengine=psync, iodepth=1
...
fio-3.18
Starting 10 threads
Jobs: 1 (f=1): [_(9),r(1)][100.0%][r=637MiB/s][r=40.8k IOPS][eta 00m:00s]
mytest: (groupid=0, jobs=10): err= 0: pid=5178: Wed May 12 11:01:45 2021read: IOPS=67.4k, BW=1053MiB/s (1104MB/s)(100GiB/97218msec)clat (usec): min=16, max=12159, avg=144.90, stdev=161.22lat (usec): min=17, max=12159, avg=145.05, stdev=161.23clat percentiles (usec):|  1.00th=[   38],  5.00th=[   52], 10.00th=[   62], 20.00th=[   76],| 30.00th=[   84], 40.00th=[   90], 50.00th=[   96], 60.00th=[  103],| 70.00th=[  112], 80.00th=[  124], 90.00th=[  400], 95.00th=[  545],| 99.00th=[  742], 99.50th=[  857], 99.90th=[ 1237], 99.95th=[ 1352],| 99.99th=[ 2147]bw (  MiB/s): min=  746, max= 1398, per=100.00%, avg=1067.44, stdev= 9.28, samples=1908iops        : min=47780, max=89506, avg=68316.38, stdev=594.14, samples=1908lat (usec)   : 20=0.01%, 50=4.46%, 100=51.66%, 250=32.91%, 500=4.35%lat (usec)   : 750=5.67%, 1000=0.64%lat (msec)   : 2=0.29%, 4=0.01%, 10=0.01%, 20=0.01%cpu          : usr=2.07%, sys=14.06%, ctx=6539035, majf=0, minf=57IO depths    : 1=100.0%, 2=0.0%, 4=0.0%, 8=0.0%, 16=0.0%, 32=0.0%, >=64=0.0%submit    : 0=0.0%, 4=100.0%, 8=0.0%, 16=0.0%, 32=0.0%, 64=0.0%, >=64=0.0%complete  : 0=0.0%, 4=100.0%, 8=0.0%, 16=0.0%, 32=0.0%, 64=0.0%, >=64=0.0%issued rwts: total=6553600,0,0,0 short=0,0,0,0 dropped=0,0,0,0latency   : target=0, window=0, percentile=100.00%, depth=1Run status group 0 (all jobs):READ: bw=1053MiB/s (1104MB/s), 1053MiB/s-1053MiB/s (1104MB/s-1104MB/s), io=100GiB (107GB), run=97218-97218msec
[root@10-31-1-119 software]#
TPCC测试
TPC(Tracsaction Processing Performance Council) 事务处理性能协会是一个评价大型数据库系统软硬件性能的非盈利的组织,TPC-C是TPC协会制定的,用来测试典型的复杂OLTP系统的性能。Tpcc-mysql是percona基于tpcc衍生出来的产品,专用于mysql基准测试.
环境安装
下载源码:
-- 如果失败,多试几次即可
git clone https://github.com/Percona-Lab/tpcc-mysql.git
下载记录:
[root@10-31-1-120 software]# git clone https://github.com/Percona-Lab/tpcc-mysql.git
正克隆到 'tpcc-mysql'...
remote: Enumerating objects: 392, done.
remote: Total 392 (delta 0), reused 0 (delta 0), pack-reused 392
接收对象中: 100% (392/392), 202.81 KiB | 9.00 KiB/s, done.
处理 delta 中: 100% (216/216), done.
[root@10-31-1-120 software]#
编译:
yum -y install mysql-devel
cd tpcc-mysql/src
make
加载数据:
mysqladmin -u root -p create tpcc1000mysql -uroot -p
use tpcc1000;
source create_table.sql
source add_fkey_idx.sql-- 20分钟
./tpcc_load -h127.0.0.1 -d tpcc1000 -u root -p passwd -w 100
bug修复
运行tpcc_start的时候会报错:
2002, HY000. Can’t connect to local MySQL server through socket Vvar. run/mysqld/mysqld.sock’
tpcc-mysql存在2个bug,需要手动修改:
文件1: main.c
char db_socket[DB_STRING_MAX] = " ";
-- snip -- if(is_local==1){/ exec sql connect :connect_string; /resp = mysql_real_connect(ctx[t_num], "localhost", db_user, db_password, db_string_full, port, db_socket, 0);}else{/ exec sql connect :connect_string USING :db_string; /resp = mysql_real_connect(ctx[t_num], connect_string, db_user, db_password, db_string_full, port, db_socket, 0);}
修改为:
char db_socket[DB_STRING_MAX] = "/var/lib/mysql/mysql.sock";--snip--if(is_local==1){/ exec sql connect :connect_string; /mysql_thread_init();resp = mysql_real_connect(ctx[t_num], "localhost", db_user, db_password, db_string_full, port, db_socket, 0);}else{/ exec sql connect :connect_string USING :db_string; /mysql_thread_init();resp = mysql_real_connect(ctx[t_num], connect_string, db_user, db_password, db_string_full, port, db_socket, 0);}
文件二:load.c
源文件:
if(is_local==1){/* exec sql connect :connect_string; */resp = mysql_real_connect(mysql, "localhost", db_user, db_password, db_string, port, NULL, 0);}else{/* exec sql connect :connect_string USING :db_string; */resp = mysql_real_connect(mysql, connect_string, db_user, db_password, db_string, port, NULL, 0);
修改为:
if(is_local==1){/* exec sql connect :connect_string; */mysql_thread_init();resp = mysql_real_connect(mysql, "localhost", db_user, db_password, db_string, port, "/var/lib/mysql/mysql.sock", 0);}else{mysql_thread_init();/* exec sql connect :connect_string USING :db_string; */resp = mysql_real_connect(mysql, connect_string, db_user, db_password, db_string, port, "/var/lib/mysql/mysql.sock", 0);}
开始测试
参数含义
-h server_host: 服务器名
-P port : 端口号,默认为3306
-d database_name: 数据库名
-u mysql_user : 用户名
-p mysql_password : 密码
-w warehouses: 仓库的数量
-c connections : 线程数,默认为1
-r warmup_time : 热身时间,单位:s,默认为10s ,热身是为了将数据加载到内存。
-l running_time: 测试时间,单位:s,默认为20s
-i report_interval: 指定生成报告间隔时长
-f report_file: 测试结果输出文件
代码:
./tpcc_start -h 10.31.1.120 -d tpcc1000 -u root -p "abc123" -w 10 -c 5 -r 120 -l 600 -i 10 -f tpcc_mysql_20210524.log
报告解读:
[root@10-31-1-120 tpcc-mysql]# ./tpcc_start -h 10.31.1.120 -d tpcc1000 -u root -p "abc123"  -w 10 -c 5 -r 120 -l 600 -i 10  -f tpcc_mysql_20210524.log
***************************************
*** ###easy### TPC-C Load Generator ***
***************************************
option h with value '10.31.1.120'
option d with value 'tpcc1000'
option u with value 'root'
option p with value 'abc123'
option w with value '10'
option c with value '5'
option r with value '120'
option l with value '600'
option i with value '10'
option f with value 'tpcc_mysql_20210524.log'
<Parameters>[server]: 10.31.1.120                              -- 主机[port]: 3306                                       -- 端口[DBname]: tpcc1000                                 -- 数据库[user]: root                                     -- 账号[pass]: abc123                                   -- 密码[warehouse]: 10                                       -- 仓库数[connection]: 5                                        -- 并发线程数 [rampup]: 120 (sec.)                               -- 数据预热时长 [measure]: 600 (sec.)                               -- 压测时长RAMP-UP TIME.(120 sec.)                     --预热结束MEASURING START.                            --开始压测10, trx: 1585, 95%: 40.465, 99%: 68.161, max_rt: 154.953, 1585|108.418, 158|68.316, 158|180.866, 159|290.45620, trx: 1631, 95%: 42.020, 99%: 66.290, max_rt: 134.796, 1635|90.688, 164|19.419, 163|166.759, 163|103.19730, trx: 1685, 95%: 42.539, 99%: 63.760, max_rt: 95.661, 1682|66.667, 168|23.617, 170|124.743, 169|78.78440, trx: 1717, 95%: 41.334, 99%: 61.676, max_rt: 101.083, 1718|75.835, 172|17.605, 170|153.279, 171|110.64550, trx: 1697, 95%: 40.332, 99%: 65.344, max_rt: 113.429, 1695|107.809, 170|18.856, 170|191.108, 169|117.72860, trx: 1334, 95%: 52.189, 99%: 93.558, max_rt: 1590.916, 1337|1414.192, 132|13.973, 134|1496.522, 134|113.48170, trx: 1568, 95%: 44.187, 99%: 64.200, max_rt: 105.029, 1567|89.779, 157|19.481, 157|197.804, 157|129.00380, trx: 1592, 95%: 44.200, 99%: 77.131, max_rt: 133.690, 1594|88.494, 159|15.762, 159|155.874, 160|117.51590, trx: 1662, 95%: 41.038, 99%: 69.584, max_rt: 113.852, 1656|88.420, 167|11.431, 166|152.061, 165|117.842100, trx: 1667, 95%: 41.907, 99%: 64.028, max_rt: 136.287, 1672|91.327, 167|11.070, 167|173.430, 167|116.591110, trx: 1681, 95%: 41.284, 99%: 69.542, max_rt: 132.606, 1683|68.603, 168|55.347, 168|162.181, 168|116.353120, trx: 1549, 95%: 45.625, 99%: 73.700, max_rt: 135.726, 1542|85.992, 155|15.106, 154|219.304, 155|83.339130, trx: 1574, 95%: 45.177, 99%: 66.968, max_rt: 158.751, 1578|54.682, 157|13.111, 159|170.681, 157|78.849140, trx: 1546, 95%: 44.854, 99%: 83.724, max_rt: 145.061, 1544|77.227, 155|22.305, 154|181.884, 155|139.306150, trx: 1635, 95%: 44.639, 99%: 74.343, max_rt: 165.761, 1637|82.254, 163|43.885, 163|186.883, 163|116.960160, trx: 1642, 95%: 42.488, 99%: 65.344, max_rt: 108.625, 1644|100.719, 165|12.851, 165|180.322, 165|148.575170, trx: 1643, 95%: 44.572, 99%: 69.688, max_rt: 118.454, 1636|82.954, 163|16.305, 164|151.805, 164|79.632180, trx: 1544, 95%: 46.871, 99%: 83.549, max_rt: 143.344, 1551|71.973, 155|19.426, 154|166.200, 155|114.349190, trx: 1529, 95%: 51.122, 99%: 76.327, max_rt: 119.329, 1528|90.759, 153|37.335, 153|202.649, 153|119.973200, trx: 1516, 95%: 45.913, 99%: 76.190, max_rt: 129.581, 1518|103.034, 152|15.985, 152|186.119, 151|110.922210, trx: 1629, 95%: 43.414, 99%: 62.907, max_rt: 116.559, 1622|91.839, 162|21.515, 163|204.726, 163|132.465220, trx: 1661, 95%: 43.284, 99%: 66.409, max_rt: 117.584, 1659|125.108, 166|22.964, 166|190.968, 166|101.227230, trx: 1639, 95%: 41.186, 99%: 68.039, max_rt: 139.412, 1642|81.764, 165|19.266, 164|201.031, 164|124.726240, trx: 1529, 95%: 47.110, 99%: 74.254, max_rt: 127.122, 1528|89.788, 152|16.630, 153|185.137, 153|130.613250, trx: 1525, 95%: 51.122, 99%: 81.109, max_rt: 116.085, 1527|78.839, 153|20.238, 152|224.054, 152|104.700260, trx: 1541, 95%: 50.817, 99%: 83.724, max_rt: 130.356, 1535|87.927, 153|24.012, 154|201.159, 154|84.816270, trx: 1383, 95%: 41.657, 99%: 80.528, max_rt: 1485.578, 1388|1473.847, 139|19.837, 138|1589.119, 138|122.915280, trx: 1630, 95%: 44.333, 99%: 69.376, max_rt: 97.787, 1630|80.551, 163|12.524, 163|177.245, 164|118.633290, trx: 1682, 95%: 40.915, 99%: 65.776, max_rt: 119.428, 1681|78.685, 168|23.446, 168|160.553, 169|115.521300, trx: 1509, 95%: 48.600, 99%: 77.664, max_rt: 104.815, 1513|89.817, 152|23.437, 152|160.403, 150|120.316310, trx: 1448, 95%: 51.091, 99%: 81.890, max_rt: 133.332, 1448|95.003, 144|23.381, 145|184.240, 145|111.933320, trx: 1551, 95%: 44.453, 99%: 75.013, max_rt: 177.458, 1552|83.327, 155|71.883, 154|176.311, 155|103.884330, trx: 1595, 95%: 46.424, 99%: 74.767, max_rt: 101.033, 1590|100.878, 160|19.500, 160|161.520, 160|116.336340, trx: 1620, 95%: 44.519, 99%: 69.293, max_rt: 117.582, 1622|82.830, 161|25.185, 162|145.765, 161|147.591350, trx: 1631, 95%: 40.610, 99%: 72.671, max_rt: 110.570, 1631|99.961, 164|13.384, 163|182.350, 164|91.907360, trx: 1512, 95%: 47.124, 99%: 74.032, max_rt: 112.626, 1512|77.888, 151|18.268, 151|193.651, 151|122.528370, trx: 1495, 95%: 48.556, 99%: 69.730, max_rt: 97.009, 1494|92.760, 150|23.593, 149|170.044, 149|83.201380, trx: 1529, 95%: 46.675, 99%: 71.356, max_rt: 101.201, 1532|67.657, 152|15.640, 154|172.814, 154|87.031390, trx: 1635, 95%: 41.223, 99%: 72.107, max_rt: 151.944, 1629|87.851, 164|35.737, 163|169.300, 162|132.981400, trx: 1632, 95%: 44.055, 99%: 70.317, max_rt: 92.558, 1637|95.022, 163|43.889, 164|210.165, 164|110.684410, trx: 1652, 95%: 43.492, 99%: 70.338, max_rt: 126.571, 1650|94.306, 165|16.432, 164|163.375, 165|122.867420, trx: 1560, 95%: 46.913, 99%: 81.133, max_rt: 142.466, 1560|105.641, 156|17.668, 157|199.629, 156|135.119430, trx: 1536, 95%: 47.749, 99%: 83.699, max_rt: 136.907, 1537|81.965, 154|28.370, 153|179.660, 154|143.256440, trx: 1563, 95%: 46.244, 99%: 75.509, max_rt: 126.649, 1564|109.099, 156|15.467, 157|171.503, 155|142.518450, trx: 1600, 95%: 45.913, 99%: 71.978, max_rt: 100.656, 1599|73.022, 160|36.008, 160|191.457, 161|82.701460, trx: 1635, 95%: 44.399, 99%: 82.283, max_rt: 117.744, 1633|79.148, 163|19.903, 162|188.135, 163|102.372470, trx: 1676, 95%: 44.174, 99%: 68.962, max_rt: 108.584, 1675|69.334, 168|18.741, 168|159.369, 167|74.830480, trx: 1552, 95%: 45.339, 99%: 69.501, max_rt: 114.857, 1557|90.775, 156|38.205, 156|236.356, 156|85.198490, trx: 1519, 95%: 48.252, 99%: 82.628, max_rt: 204.636, 1515|139.115, 151|22.979, 151|194.910, 151|101.544500, trx: 1553, 95%: 49.083, 99%: 69.148, max_rt: 134.515, 1556|87.782, 156|28.435, 156|189.380, 156|132.119510, trx: 1634, 95%: 42.412, 99%: 68.735, max_rt: 115.450, 1635|74.971, 163|12.749, 163|187.160, 164|123.722520, trx: 1631, 95%: 43.323, 99%: 73.414, max_rt: 108.546, 1627|90.988, 163|17.812, 164|168.162, 163|124.428530, trx: 1600, 95%: 44.693, 99%: 71.164, max_rt: 105.214, 1601|74.805, 160|21.664, 159|161.137, 159|133.575540, trx: 1458, 95%: 49.644, 99%: 78.177, max_rt: 124.618, 1460|96.897, 147|30.464, 147|180.685, 147|121.754550, trx: 1511, 95%: 46.065, 99%: 72.518, max_rt: 130.639, 1507|82.385, 150|19.416, 150|241.390, 151|106.991560, trx: 1561, 95%: 44.679, 99%: 74.143, max_rt: 116.987, 1564|85.479, 156|14.463, 157|239.011, 156|74.772570, trx: 1593, 95%: 42.603, 99%: 68.714, max_rt: 121.134, 1592|127.673, 159|21.745, 158|182.691, 159|96.393580, trx: 1591, 95%: 44.719, 99%: 79.285, max_rt: 117.820, 1591|85.518, 159|75.231, 160|186.695, 159|98.639590, trx: 1588, 95%: 44.827, 99%: 71.356, max_rt: 123.872, 1586|115.386, 159|15.790, 158|177.794, 159|112.341600, trx: 1232, 95%: 48.644, 99%: 79.952, max_rt: 1518.349, 1234|115.769, 124|16.189, 123|209.123, 123|122.170STOPPING THREADS.....<Raw Results>[0] sc:2957 lt:91661  rt:0  fl:0 avg_rt: 19.5 (5)[1] sc:62192 lt:32425  rt:0  fl:0 avg_rt: 7.6 (5)[2] sc:8800 lt:662  rt:0  fl:0 avg_rt: 2.2 (5)[3] sc:7371 lt:2090  rt:0  fl:0 avg_rt: 67.0 (80)[4] sc:1797 lt:7665  rt:0  fl:0 avg_rt: 40.3 (20)in 600 sec.<Raw Results2(sum ver.)>[0] sc:2957  lt:91661  rt:0  fl:0 [1] sc:62194  lt:32425  rt:0  fl:0 [2] sc:8800  lt:662  rt:0  fl:0 [3] sc:7371  lt:2090  rt:0  fl:0 [4] sc:1797  lt:7665  rt:0  fl:0 <Constraint Check> (all must be [OK])[transaction percentage]Payment: 43.48% (>=43.0%) [OK]Order-Status: 4.35% (>= 4.0%) [OK]Delivery: 4.35% (>= 4.0%) [OK]Stock-Level: 4.35% (>= 4.0%) [OK][response time (at least 90% passed)]New-Order: 3.13%  [NG] *Payment: 65.73%  [NG] *Order-Status: 93.00%  [OK]Delivery: 77.91%  [NG] *Stock-Level: 18.99%  [NG] *<TpmC>9461.800 TpmC
10, trx: 1585, 95%: 40.465, 99%: 68.161, max_rt: 154.953, 1585|108.418, 158|68.316, 158|180.866, 159|290.456
逗号进行分割。
10 表示从测试开始到现在的时间为10秒。
trx: 1585 表示这个时间间隔完成的新订单事物数量,实际上就是吞吐量,越大越好。
95%: 40.465 表示这个时间间隔内95%的新订单事物响应时间为40.465秒。
99%: 68.161 表示这个时间间隔内99%的新订单事物响应时间为68.161秒。
max_rt: 154.953 表示这个时间间隔内新订单事物最大响应时间为154.953秒。
1585|108.418, 158|68.316, 158|180.866, 159|290.456 这几个表示其他种类事物的吞吐量和响应时间,可以忽略。
[0] sc:2957 lt:91661 rt:0 fl:0 avg_rt: 19.5 (5) //表示新订单业务成功(success,简写sc)次数,延迟(late,简写lt)次数,重试(retry,简写rt)次数,失败(failure,简写fl)次数。
[1] sc:62192 lt:32425 rt:0 fl:0 avg_rt: 7.6 (5) //表示支付业务成功(success,简写sc)次数,延迟(late,简写lt)次数,重试(retry,简写rt)次数,失败(failure,简写fl)次数。
[2] sc:8800 lt:662 rt:0 fl:0 avg_rt: 2.2 (5) //表示订单状态业务成功(success,简写sc)次数,延迟(late,简写lt)次数,重试(retry,简写rt)次数,失败(failure,简写fl)次数。
[3] sc:7371 lt:2090 rt:0 fl:0 avg_rt: 67.0 (80) //表示发货业务成功(success,简写sc)次数,延迟(late,简写lt)次数,重试(retry,简写rt)次数,失败(failure,简写fl)次数。
[4] sc:1797 lt:7665 rt:0 fl:0 avg_rt: 40.3 (20) //表示库存业务成功(success,简写sc)次数,延迟(late,简写lt)次数,重试(retry,简写rt)次数,失败(failure,简写fl)次数。
(all must be [OK]) //下面所有的结果必须为OK
[transaction percentage]
Payment: 43.48% (>=43.0%) [OK] //支付模块占总业务的43.48%
Order-Status: 4.35% (>= 4.0%) [OK] //订单状态模块占总业务的4.35%
Delivery: 4.35% (>= 4.0%) [OK] //发货模块占总业务的4.35%
Stock-Level: 4.35% (>= 4.0%) [OK] //库存模块占总业务的4.35%
[response time (at least 90% passed)] //响应时间是否满足
New-Order: 3.13% [NG] *
Payment: 65.73% [NG] *
Order-Status: 93.00% [OK]
Delivery: 77.91% [NG] *
Stock-Level: 18.99% [NG] *
指标如下:
New-Order 5ms
Payment 5ms
Order-Status 5ms
Delivery 80ms
Stock-Level 20ms
9461.800 TpmC //每分钟能够处理的新订单数量。
Sysbench
sysbench可以执行多种类型的基准测试,它不仅设计用来测试数据库的性能,也可以测试运行数据库的服务器的性能。
Sysbench安装
一般推荐使用yum进行安装
yum -y install sysbench
Sysbench参数
直接查看帮助即可看到sysbench支持的参数及含义
[root@10-31-1-120 ~]# sysbench --help
Usage:sysbench [options]... [testname] [command]Commands implemented by most tests: prepare run cleanup helpGeneral options:--threads=N                     number of threads to use [1]--events=N                      limit for total number of events [0]--time=N                        limit for total execution time in seconds [10]--forced-shutdown=STRING        number of seconds to wait after the --time limit before forcing shutdown, or 'off' to disable [off]--thread-stack-size=SIZE        size of stack per thread [64K]--rate=N                        average transactions rate. 0 for unlimited rate [0]--report-interval=N             periodically report intermediate statistics with a specified interval in seconds. 0 disables intermediate reports [0]--report-checkpoints=[LIST,...] dump full statistics and reset all counters at specified points in time. The argument is a list of comma-separated values representing the amount of time in seconds elapsed from start of test when report checkpoint(s) must be performed. Report checkpoints are off by default. []--debug[=on|off]                print more debugging info [off]--validate[=on|off]             perform validation checks where possible [off]--help[=on|off]                 print help and exit [off]--version[=on|off]              print version and exit [off]--config-file=FILENAME          File containing command line options--tx-rate=N                     deprecated alias for --rate [0]--max-requests=N                deprecated alias for --events [0]--max-time=N                    deprecated alias for --time [0]--num-threads=N                 deprecated alias for --threads [1]Pseudo-Random Numbers Generator options:--rand-type=STRING random numbers distribution {uniform,gaussian,special,pareto} [special]--rand-spec-iter=N number of iterations used for numbers generation [12]--rand-spec-pct=N  percentage of values to be treated as 'special' (for special distribution) [1]--rand-spec-res=N  percentage of 'special' values to use (for special distribution) [75]--rand-seed=N      seed for random number generator. When 0, the current time is used as a RNG seed. [0]--rand-pareto-h=N  parameter h for pareto distribution [0.2]Log options:--verbosity=N verbosity level {5 - debug, 0 - only critical messages} [3]--percentile=N       percentile to calculate in latency statistics (1-100). Use the special value of 0 to disable percentile calculations [95]--histogram[=on|off] print latency histogram in report [off]General database options:--db-driver=STRING  specifies database driver to use ('help' to get list of available drivers) [mysql]--db-ps-mode=STRING prepared statements usage mode {auto, disable} [auto]--db-debug[=on|off] print database-specific debug information [off]Compiled-in database drivers:mysql - MySQL driverpgsql - PostgreSQL drivermysql options:--mysql-host=[LIST,...]          MySQL server host [localhost]--mysql-port=[LIST,...]          MySQL server port [3306]--mysql-socket=[LIST,...]        MySQL socket--mysql-user=STRING              MySQL user [sbtest]--mysql-password=STRING          MySQL password []--mysql-db=STRING                MySQL database name [sbtest]--mysql-ssl[=on|off]             use SSL connections, if available in the client library [off]--mysql-ssl-cipher=STRING        use specific cipher for SSL connections []--mysql-compression[=on|off]     use compression, if available in the client library [off]--mysql-debug[=on|off]           trace all client library calls [off]--mysql-ignore-errors=[LIST,...] list of errors to ignore, or "all" [1213,1020,1205]--mysql-dry-run[=on|off]         Dry run, pretend that all MySQL client API calls are successful without executing them [off]pgsql options:--pgsql-host=STRING     PostgreSQL server host [localhost]--pgsql-port=N          PostgreSQL server port [5432]--pgsql-user=STRING     PostgreSQL user [sbtest]--pgsql-password=STRING PostgreSQL password []--pgsql-db=STRING       PostgreSQL database name [sbtest]Compiled-in tests:fileio - File I/O testcpu - CPU performance testmemory - Memory functions speed testthreads - Threads subsystem performance testmutex - Mutex performance testSee 'sysbench <testname> help' for a list of options for each test.[root@10-31-1-120 ~]#
测试CPU
命令:
sysbench --test=cpu --cpu-max-prime=20000 run
测试记录:
[root@10-31-1-120 ~]# sysbench --test=cpu --cpu-max-prime=20000 run
WARNING: the --test option is deprecated. You can pass a script name or path on the command line without any options.
sysbench 1.0.20 (using bundled LuaJIT 2.1.0-beta2)Running the test with following options:
Number of threads: 1
Initializing random number generator from current timePrime numbers limit: 20000Initializing worker threads...Threads started!CPU speed:events per second:   398.45General statistics:total time:                          10.0011stotal number of events:              3987Latency (ms):min:                                    2.37avg:                                    2.51max:                                    7.7095th percentile:                        2.66sum:                                 9999.05Threads fairness:events (avg/stddev):           3987.0000/0.00execution time (avg/stddev):   9.9990/0.00
测试IO
文件I/O(fileio)基准测试可以测试系统在不同I/O负载下的性能。这对于比较不同的硬盘驱动器、不同的RAID卡、不同的RAID模式,都很有帮助。可以根据测试结果来调整I/O子系统。文件I/O基准测试模拟了很多InnoDB的I/O特性。
seqwr – 顺序写入
seqrewr – 顺序重写
seqrd – 顺序读取
rndrd – 随机读取
rndwr – 随机写入
rdnrw – 混合随机读/写
命令:
sysbench --test=fileio --file-num=16 --file-total-size=2G prepare
测试记录:
[root@10-31-1-120 software]# sysbench --test=fileio --file-num=16 --file-total-size=2G prepare
WARNING: the --test option is deprecated. You can pass a script name or path on the command line without any options.
sysbench 1.0.20 (using bundled LuaJIT 2.1.0-beta2)16 files, 131072Kb each, 2048Mb total
Creating files for the test...
Extra file open flags: (none)
Creating file test_file.0
Creating file test_file.1
Creating file test_file.2
Creating file test_file.3
Creating file test_file.4
Creating file test_file.5
Creating file test_file.6
Creating file test_file.7
Creating file test_file.8
Creating file test_file.9
Creating file test_file.10
Creating file test_file.11
Creating file test_file.12
Creating file test_file.13
Creating file test_file.14
Creating file test_file.15
2147483648 bytes written in 6.96 seconds (294.30 MiB/sec).
[root@10-31-1-120 software]#
对mysql事务型OLTP的测试
对于mysql的OLTP测试,和file一样,同样需要经历prepare,run,cleanup三个阶段。prepare阶段会在数据库中产生一张指定行数的表,默认表在sbtest架构下,表名为sbtest(sysbench默认生成表的存储引擎为innodb),如创建一张8000万条记录的表:
命令:
CREATE DATABASE `sbtest` DEFAULT CHARACTER SET utf8;sysbench --oltp-tables-count=5 --oltp_table_size=10000 --mysql-host=localhost --mysql-user=root --mysql-password=abc123 /usr/share/sysbench/tests/include/oltp_legacy/insert.lua prepare
测试记录:
[root@10-31-1-120 ~]# sysbench --oltp-tables-count=5 --oltp_table_size=10000 --mysql-host=localhost --mysql-user=root --mysql-password=abc123 /usr/share/sysbench/tests/include/oltp_legacy/insert.lua prepare
sysbench 1.0.20 (using bundled LuaJIT 2.1.0-beta2)Creating table 'sbtest1'...
Inserting 10000 records into 'sbtest1'
Creating secondary indexes on 'sbtest1'...
Creating table 'sbtest2'...
Inserting 10000 records into 'sbtest2'
Creating secondary indexes on 'sbtest2'...
Creating table 'sbtest3'...
Inserting 10000 records into 'sbtest3'
Creating secondary indexes on 'sbtest3'...
Creating table 'sbtest4'...
Inserting 10000 records into 'sbtest4'
Creating secondary indexes on 'sbtest4'...
Creating table 'sbtest5'...
Inserting 10000 records into 'sbtest5'
Creating secondary indexes on 'sbtest5'...
[root@10-31-1-120 ~]# mysql> select count(*) from sbtest1;
+----------+
| count(*) |
+----------+
|    10000 |
+----------+
1 row in set (0.00 sec)mysql> desc sbtest1;
+-------+------------------+------+-----+---------+----------------+
| Field | Type             | Null | Key | Default | Extra          |
+-------+------------------+------+-----+---------+----------------+
| id    | int(10) unsigned | NO   | PRI | NULL    | auto_increment |
| k     | int(10) unsigned | NO   | MUL | 0       |                |
| c     | char(120)        | NO   |     |         |                |
| pad   | char(60)         | NO   |     |         |                |
+-------+------------------+------+-----+---------+----------------+
4 rows in set (0.00 sec)mysql>
mysql> select * from sbtest1 limit 10;
+----+------+-------------------------------------------------------------------------------------------------------------------------+-------------------------------------------------------------+
| id | k    | c                                                                                                                       | pad                                                         |
+----+------+-------------------------------------------------------------------------------------------------------------------------+-------------------------------------------------------------+
|  1 | 4993 | 83868641912-28773972837-60736120486-75162659906-27563526494-20381887404-41576422241-93426793964-56405065102-33518432330 | 67847967377-48000963322-62604785301-91415491898-96926520291 |
|  2 | 5020 | 38014276128-25250245652-62722561801-27818678124-24890218270-18312424692-92565570600-36243745486-21199862476-38576014630 | 23183251411-36241541236-31706421314-92007079971-60663066966 |
|  3 | 5044 | 33973744704-80540844748-72700647445-87330233173-87249600839-07301471459-22846777364-58808996678-64607045326-48799346817 | 38615512647-91458489257-90681424432-95014675832-60408598704 |
|  4 | 5021 | 37002370280-58842166667-00026392672-77506866252-09658311935-56926959306-83464667271-94685475868-28264244556-14550208498 | 63947013338-98809887124-59806726763-79831528812-45582457048 |
|  5 | 4999 | 44257470806-17967007152-32809666989-26174672567-29883439075-95767161284-94957565003-35708767253-53935174705-16168070783 | 34551750492-67990399350-81179284955-79299808058-21257255869 |
|  6 | 5006 | 37216201353-39109531021-11197415756-87798784755-02463049870-83329763120-57551308766-61100580113-80090253566-30971527105 | 05161542529-00085727016-35134775864-52531204064-98744439797 |
|  7 | 5014 | 33071042495-29920376648-91343430102-79082003121-73317691963-02846712788-88069761578-14885283975-44409837760-90760298045 | 91798303270-64988107984-08161247972-12116454627-22996445111 |
|  8 | 5000 | 73754818686-04889373966-18668178968-56957589012-31352882173-91882653509-59577900152-88962682169-52981807259-62646890059 | 76460662325-41613089656-42706083314-81833284991-17063140920 |
|  9 | 5273 | 26482547570-00155460224-12388481921-23289186371-78242522654-77998886134-73270876420-50821093220-31442690639-11588920653 | 30508501104-50823269125-88107014550-70202920684-95842308929 |
| 10 | 5035 | 05677017559-47107518969-97509137401-28934334557-14497052050-61906823704-44077628507-24840441785-05187301456-27797851637 | 29489382504-13697582598-09964978366-26554639515-36136545002 |
+----+------+-------------------------------------------------------------------------------------------------------------------------+-------------------------------------------------------------+
10 rows in set (0.00 sec)mysql>
参考
MySQL优化系列4-MySQL压力测试_只是甲的博客-CSDN博客
相关文章:
MySQL优化篇-MySQL压力测试
备注:测试数据库版本为MySQL 8.0 MySQL压力测试概述 为什么压力测试很重要?因为压力测试是唯一方便有效的、可以学习系统在给定的工作负载下会发生什么的方法。压力测试可以观察系统在不同压力下的行为,评估系统的容量,掌握哪些是重要的变化…...

CF43A Football 题解
CF43A Football 题解题目链接字面描述题面翻译题面描述题目描述输入格式输出格式样例 #1样例输入 #1样例输出 #1样例 #2样例输入 #2样例输出 #2代码实现题目 链接 https://www.luogu.com.cn/problem/CF43A 字面描述 题面翻译 题面描述 两只足球队比赛,现给你进…...

Nginx常用命令及具体应用(Linux系统)
目录 一、常用命令 1、查看Nginx版本命令,在sbin目录下 2、检查配置文件的正确性 3、启动和停止Nginx 4、查看日志,在logs目录下输入指令: 5、重新加载配置文件 二、Nginx配置文件结构 三、Nginx具体应用 1、部署静态资源 2、反向代…...

从零实现Web服务器(三):日志优化,压力测试,实战接收HTTP请求,实战响应HTTP请求
文章目录一、日志系统的运行流程1.1 异步日志和同步日志的不同点1.2 缓冲区的实现二、基于Webbench的压力测试三、HTTP请求报文解析http报文处理流程epoll相关代码服务器接收http请求四、HTTP请求报文响应一、日志系统的运行流程 步骤: 单例模式(局部静态变量懒汉…...
MFC入门
1.什么是MFC?全称是Microsoft Foundation Class Library,我们称微软基础类库。它封装了windows应用程序的各种API以及相关机制的C类库MFC是一个大的类库MFC是一个应用程序框架MFC类库常用的头文件afx.h-----将各种MFC头文件包含在内afxwin.h-------包含了各种MFC窗…...

1、H5+CSS面试题
1, HTML5中新增了哪些内容?广义上的html5指的是最新一代前端开发技术的总称,包括html5,CSS3,新增的webAPI。Html中新增了header,footer,main,nav等语义化标签,新增了video,audio媒体标签,新增了canvas画布。…...

亚马逊云科技重磅发布《亚马逊云科技汽车行业解决方案》
当今,随着万物智联、云计算等领域的高速发展,创新智能网联汽车和车路协同技术正在成为车企加速发展的关键途径,推动着汽车产品从出行代步工具向着“超级智能移动终端”快速转变。挑战无处不在,如何抢先预判?随着近年来…...
Springboot扩展点之FactoryBean
前言FactoryBean是一个有意思,且非常重要的扩展点,之所以说是有意思,是因为它老是被拿来与另一个名字比较类似的BeanFactory来比较,特别是在面试当中,动不动就问你:你了解Beanfactory和FactoryBean的区别吗…...
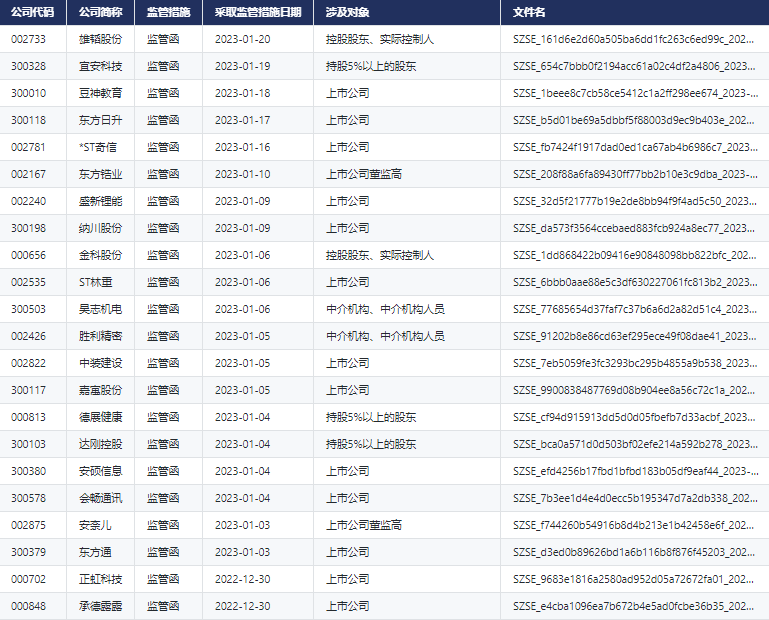
新库上线 | CnOpenDataA股上市公司交易所监管措施数据
A股上市公司交易所监管措施数据 一、数据简介 证券市场监管是指证券管理机关运用法律的、经济的以及必要的行政手段,对证券的募集、发行、交易等行为以及证券投资中介机构的行为进行监督与管理。 我国《证券交易所管理办法》第十二条规定,证券交易所应当…...
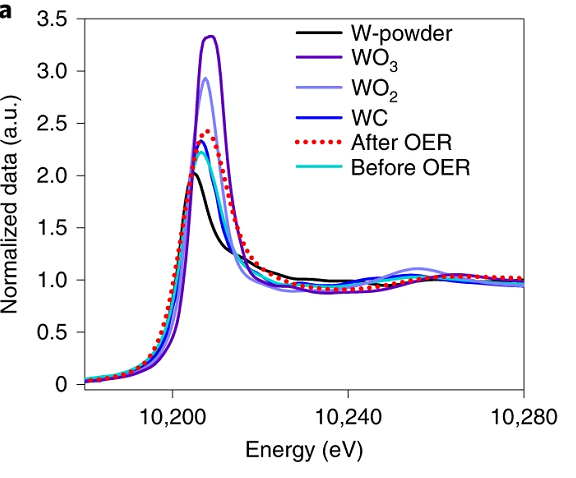
同步辐射XAFS表征方法的应用场景分析
X射线吸收精细结构XAFS表征方法是一种用于研究物质结构和化学环境的分析技术。XAFS 使用 X 射线照射到物质表面,并观察由此产生的 X 光吸收谱。 XAFS 技术通常应用于研究高分子物质、生物分子、纳米结构和其他类型的物质。例如,XAFS 可以用来研究高分子…...

06 antdesign react Anchor 不同页面之间实现锚点
react Anchor 不同页面之间实现锚点一、定义二、使用步骤三、开发流程(一)、组件(二)、页面布局(三)、点击事件(四)、总结说明一、react单页面应用,当前页面的锚点二、react单页面应用,不同页面的锚点思路:锚点只能在当前页面使用,…...
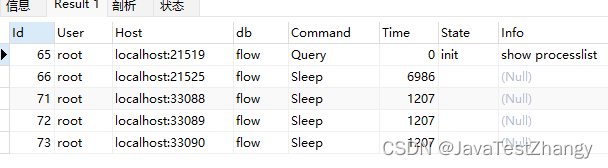
mysql调优-内存缓冲池
因本地查询和服务器查询相比服务器慢了很多,同样的数据,同样的sql查询,考虑了是不是链接太多了,自行查询了下,我使用的c3p0的链接池,配置一个小时超时,正常情况下是20多个链接,而mys…...
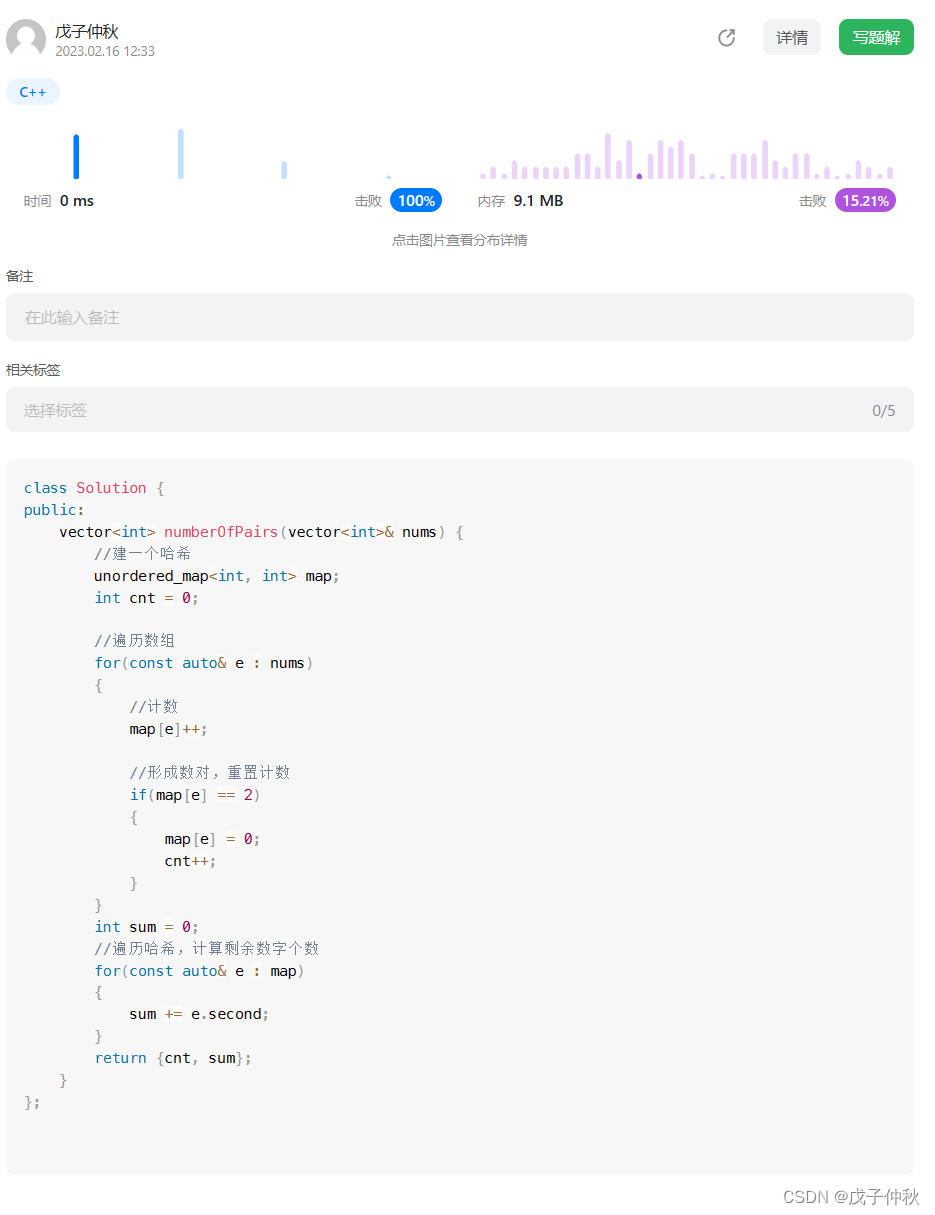
【LeetCode】每日一题(5)
目录 题目:2341. 数组能形成多少数对 - 力扣(Leetcode) 题目的接口: 解题思路: 代码: 过啦!!! 写在最后: 题目:2341. 数组能形成多少数对 -…...
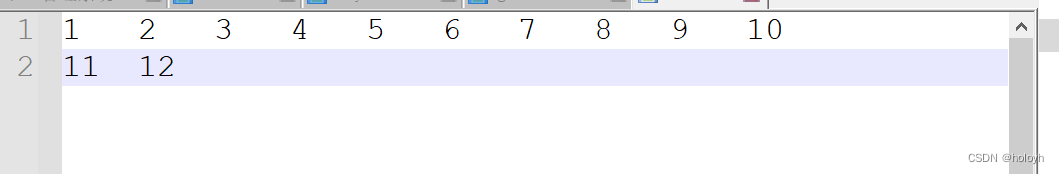
输入任意多个整数, 把这些数据保存到文件data.txt中.(按ctrl + z)
#pragma once #include <iostream> #include <fstream> using namespace std; /* 输入任意多个整数, 把这些数据保存到文件data.txt中. 如果在输入的过程中, 输入错误, 则提示用户重新输入. 指导用户输入结束(按ctrl z) [每行最多保存10个整数] */ int main() { …...

Mysql数据库的时间(3)一如何用函数插入时间
暂时用下面四个日期函数插入时间 如:insert into Stu(time) values (now()); Mysql的时间函数描述对应的Mysql的时间类型now()/sysdate()NOW()函数以YYYY-MM-DD HH:MM:SS返回当前的日期时间date/time/dateTime/timeStamp/yearcurDate()/current_date()返回当前的日期YYYY-M…...
)
关于eval函数(将JSON格式的字符串转换成JSON格式对象)
<!DOCTYPE html> <html> <head> <meta charset"utf-8"> <title>关于eval函数</title> </head> <body> <!--JSON是一种行业内的数据交换格式标准。在JS当中以对象的形式存在…...

2023最强软件测试面试题,精选100 道,内附答案版,冲刺金3银4
精挑细选,整理了100道软件测试面试题,都是非常常见的面试题,篇幅较长,所以只放出了题目,答案在评论区! 测试技术面试题 1、什么是兼容性测试?兼容性测试侧重哪些方面? 2、我现在有…...

一文搞懂Docker容器里进程的 pid 是如何申请出来的?
如果大家有过在容器中执行 ps 命令的经验,都会知道在容器中的进程的 pid 一般是比较小的。例如下面我的这个例子。 # ps -ef PID USER TIME COMMAND1 root 0:00 ./demo-ie13 root 0:00 /bin/bash21 root 0:00 ps -ef 不知道大家是否和我一样…...
若依框架如何新增自定义主题风格
若依框架新增主题风格1.实现结果2.实现步骤2.1Settings目录下2.2 variables.scss2.3 sidebar.scss2.4 Logo.vue2.5 Siderbar目录下的index.vue1.实现结果 2.实现步骤 需要改动的文件目录: 2.1Settings目录下 <div class"setting-drawer-block-checbox-it…...
C语言格式化输入和输出; Format格式化
Format格式化 %1s或者%2s,%3s:取字符串的前1,2或者3位。%*c:屏蔽一个字符。%[A-Z]:取一个A到Z的值。 %[^a-z]:不取a到z的值。 %[^\n]:取非换行之前的值。printf("%5d", a):左边补 格式化:有正则在其中。 int main() {printf("%5d\n&quo…...

别再死磕动态规划了!用Python模拟退火算法搞定背包问题,附完整代码
用Python模拟退火算法优雅解决背包问题:从理论到实战 在算法学习的过程中,背包问题就像一座难以逾越的高山,让无数初学者望而生畏。传统的动态规划解法虽然精确,但代码实现复杂、状态转移方程难以理解,对于实际应用场景…...

FanControl完整指南:免费开源的风扇控制软件让Windows散热管理如此简单
FanControl完整指南:免费开源的风扇控制软件让Windows散热管理如此简单 【免费下载链接】FanControl.Releases This is the release repository for Fan Control, a highly customizable fan controlling software for Windows. 项目地址: https://gitcode.com/Gi…...

12种加密音乐格式一键解密:Unlock Music开源工具完全指南
12种加密音乐格式一键解密:Unlock Music开源工具完全指南 【免费下载链接】unlock-music 在浏览器中解锁加密的音乐文件。原仓库: 1. https://github.com/unlock-music/unlock-music ;2. https://git.unlock-music.dev/um/web 项目地址: ht…...

如何三步免费下载百度文库文档:简单实用的完整指南
如何三步免费下载百度文库文档:简单实用的完整指南 【免费下载链接】baidu-wenku fetch the document for free 项目地址: https://gitcode.com/gh_mirrors/ba/baidu-wenku 百度文库助手是一个让你免费获取文库文档的开源工具,通过智能清理页面元…...

ExplorerPatcher终极指南:快速打造你的专属Windows工作界面
ExplorerPatcher终极指南:快速打造你的专属Windows工作界面 【免费下载链接】ExplorerPatcher This project aims to enhance the working environment on Windows 项目地址: https://gitcode.com/GitHub_Trending/ex/ExplorerPatcher 厌倦了Windows 11强制性…...

League Akari终极指南:英雄联盟玩家的智能游戏助手完整教程
League Akari终极指南:英雄联盟玩家的智能游戏助手完整教程 【免费下载链接】League-Toolkit An all-in-one toolkit for LeagueClient. Gathering power 🚀. 项目地址: https://gitcode.com/gh_mirrors/le/League-Toolkit 还在为英雄联盟的繁琐操…...

为AI编程助手设置安全规则:从原理到实践的工程指南
1. 项目概述:为你的AI编程伙伴戴上“紧箍咒”如果你和我一样,深度使用Cursor这类AI编程助手,那你一定体验过那种“冰火两重天”的感觉。一方面,它能以惊人的速度生成代码、重构函数、甚至解释复杂逻辑,极大地提升了开发…...

VideoDownloadHelper深度解析:破解主流视频平台下载限制的技术实战
VideoDownloadHelper深度解析:破解主流视频平台下载限制的技术实战 【免费下载链接】VideoDownloadHelper Chrome Extension to Help Download Video for Some Video Sites. 项目地址: https://gitcode.com/gh_mirrors/vi/VideoDownloadHelper 还在为无法保存…...

SQL线索
插入insert into 表 (列) value (),(),...;从另一个表插入数据:insert into 表 (列) select 列 from 另一个表 where 限制;删除delete from 表 where 限制;子查询删:delete from 表 where 列 in (select 列 from 另一个表 where 限制);改update 表 set 列…...

IP第一次作业
...