实战:Prometheus+Grafana监控Linux服务器及Springboot项目
文章目录
- 前言
- 知识积累
- 什么是Prometheus
- 什么是Grafana
- 怎样完成数据采集和监控
- 环境搭建
- docker与docker-compose安装
- docker-compose编写
- 监控配置
- grafana配置prometheus数据源
- grafana配置dashboard
- Linux Host Metrics监控
- Spring Boot 监控
- 写在最后
前言
相信大家都知道一个项目交付生产并不意味着结束,更多的是对线上服务的运维监控。运维监控主要涉及到部署服务器的资源情况,各个子服务的资源情况以及垃圾收集和吞吐量等等,还有故障告警等等功能。当然,作为一个搬砖人也是需要了解全链路的运维监控组件Prometheus。
知识积累
什么是Prometheus
Prometheus 是一个开源的服务监控系统和时间序列数据库。
特性:
高维度数据模型
自定义查询语言
可视化数据展示
高效的存储策略
易于运维
提供各种客户端开发库
警告和报警
数据导出
什么是Grafana
Grafana是一个跨平台的开源的度量分析和可视化工具,主要用于查询并可视化展示采集的数据。
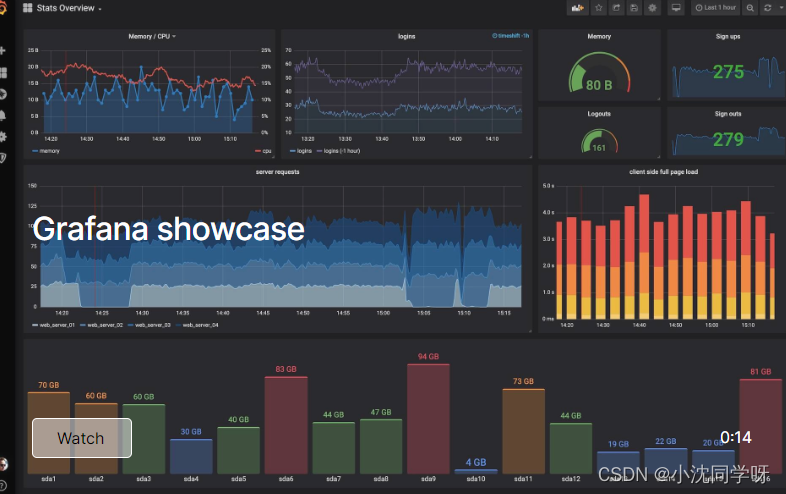
Grafana提供了丰富的可视化展示方式,包括快速灵活的客户端图表,拥有不同方式的可视化指标和日志的面板插件以及丰富的仪表盘插件,包括热图、折线图、图表等。
Grafana能够帮助用户快速的查看和编辑dashboard的前端。支持同时连接多种数据源,能够将时序时空数据库(TSDB)数据转换为漂亮的图表。
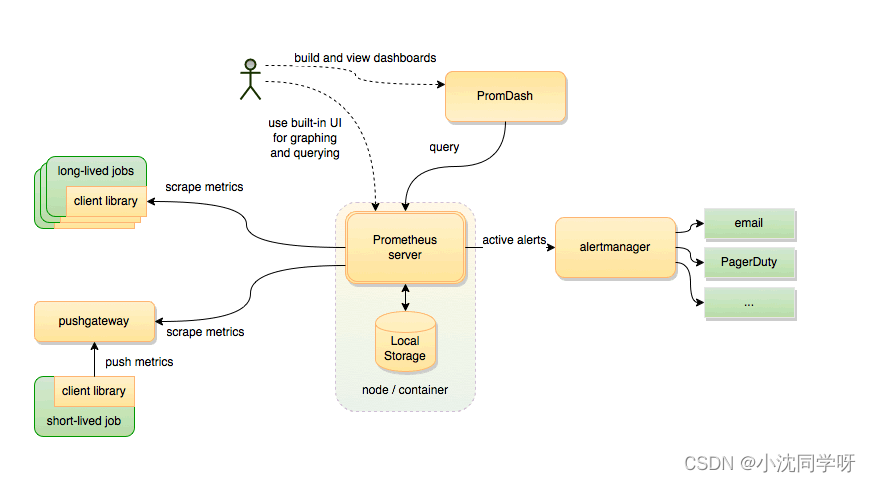
怎样完成数据采集和监控
通过node-exporter采集linux主要参数信息,Springboot微服务项目提供actuator监控配置。Prometheus server 主动拉取exporter采集的服务器数据提供主要内存、cpu参数展示,主动调用actuator接口拉取各种运行参数进行展示。
为了满足运维人员的各种可视化图表要求,我们再接入Grafana度量平台和可视化分析工具,其各种丰富的插件和仪表盘模板可以尽最大限度的提升监控运维质量。
环境搭建
对于Prometheus+Grafana环境的搭建,我们采用docker容器化进行部署管理。
考虑到我们可以随意更换告警、被监控项目等配置,我们将Grafana、Prometheus主要配置挂载在容器外部。
文件树:
[root@localhost app]# tree
.
├── docker-compose-prometheus.yaml
├── grafana
│ ├── data
│ │ └── grafana
│ └── grafana.ini
└── prometheus
├── app.json
└── prometheus.yml
docker与docker-compose安装
#安装docker社区版
yum install docker-ce
#版本查看
docker version
#docker-compose插件安装
curl -L https://github.com/docker/compose/releases/download/1.21.2/docker-compose-`uname -s`-`uname -m` -o /usr/local/bin/docker-compose
#可执行权限
chmod +x /usr/local/bin/docker-compose
#版本查看
docker-compose version
docker-compose编写
[root@localhost app]# pwd
/app
[root@localhost app]#
1、创建Prometheus配置文件
可参考 httpspro://metheus.io/docs/prometheus/latest/getting_started
[root@localhost app]# mkdir prometheus
[root@localhost app]# vim prometheus/app.json
[{"targets": ["10.10.18.16:8888"],"labels": {"instance": "demo","service": "demo-service"}}
]
[root@localhost app]# vim prometheus/prometheus.yml
global:scrape_interval: 10sscrape_timeout: 10sevaluation_interval: 10mscrape_configs:- job_name: spring-boot # springboot项目scrape_interval: 5sscrape_timeout: 5smetrics_path: /actuator/prometheusscheme: httpfile_sd_configs:- files:- ./*.jsonrefresh_interval: 1m- job_name: prometheus # prometheusstatic_configs:- targets: ['prometheus:9090']labels:instance: prometheus- job_name: linux # 采集node exporter监控数据,即linuxstatic_configs:- targets: ['node-exporter:9100']labels:instance: localhost2、创建Grafana配置文件
[root@localhost app]# mkdir -p ./grafana/data/grafana
[root@localhost app]# chmod -R 777 ./grafana/
grafana配置文件下载:
https://github.com/grafana/grafana/blob/main/conf/sample.ini
将下载的配置文件重命名为grafana.ini放在新建的文件夹下面。
修改数据库配置:
[root@localhost app]# vim grafana.ini
#################################### Database ############################
[database]
# You can configure the database connection by specifying type, host, name, user and password
# as separate properties or as on string using the url property.# Either "mysql", "postgres" or "sqlite3", it's your choice
type = mysql
host = 10.10.10.202:6456
name = grafana
user = root
# If the password contains # or ; you have to wrap it with triple quotes. Ex """#password;"""
passw0ord =MyNewPass2021
# Use either URL or the previous fields to configure the database
# Example: mysql://user:secret@host:port/database
url =mysql://root:MyNewPass2021@10.10.10.202:6456/grafana# Max idle conn setting default is 2
max_idle_conn = 2# Max conn setting default is 0 (mean not set)
max_open_conn =100# Connection Max Lifetime default is 14400 (means 14400 seconds or 4 hours)
conn_max_lifetime = 14400
# Set to true to log the sql calls and execution times.
log_queries =# For "postgres", use either "disable", "require" or "verify-full"
# For "mysql", use either "true", "false", or "skip-verify".
ssl_mode = disable# Database drivers may support different transaction isolation levels.
# Currently, only "mysql" driver supports isolation levels.
# If the value is empty - driver's default isolation level is applied.
# For "mysql" use "READ-UNCOMMITTED", "READ-COMMITTED", "REPEATABLE-READ" or "SERIALIZABLE".
isolation_level =ca_cert_path =
client_key_path =
client_cert_path =
server_cert_name =# For "sqlite3" only, path relative to data_path setting
path = grafana.db# For "sqlite3" only. cache mode setting used for connecting to the database
cache_mode = private# For "sqlite3" only. Enable/disable Write-Ahead Logging, https://sqlite.org/wal.html. Default is false.
wal = false# For "mysql" only if migrationLocking feature toggle is set. How many seconds to wait before failing to lock the database for the migrations, default is 0.
locking_attempt_timeout_sec = 0# For "sqlite" only. How many times to retry query in case of database is locked failures. Default is 0 (disabled).
query_retries = 0# For "sqlite" only. How many times to retry transaction in case of database is locked failures. Default is 5.
transaction_retries = 5# Set to true to add metrics and tracing for database queries.
instrument_queries = false
#################################### SMTP / Emailing #####################
[smtp]
enabled = false
host = localhost:25
user =
# If the password contains # or ; you have to wrap it with triple quotes. Ex """#password;"""
password =
cert_file =
key_file =
skip_verify = false
from_address = admin@grafana.localhost
from_name = Grafana
ehlo_identity =
startTLS_policy =[emails]
welcome_email_on_sign_up = false
templates_pattern = emails/*.html
content_types = text/html
3、docker-compose
[root@localhost app]# vim docker-compose-prometheus.yaml
version: "3"
networks: # 网桥prometheus:ipam:driver: defaultconfig:- subnet: "172.22.0.0/24"services:prometheus: # prometheusimage: registry.cn-hangzhou.aliyuncs.com/senfel/prometheus:v2.34.0container_name: prometheusrestart: unless-stoppedvolumes:- ./prometheus/app.json:/etc/prometheus/app.json- ./prometheus/prometheus.yml:/etc/prometheus/prometheus.ymlcommand: "--config.file=/etc/prometheus/prometheus.yml --storage.tsdb.path=/prometheus"ports:- "9090:9090"depends_on:- node-exporternetworks:prometheus:ipv4_address: 172.22.0.11node-exporter:  # 采集服务器层面的运行指标image: registry.cn-hangzhou.aliyuncs.com/senfel/node-exporter:v1.3.1container_name: prometheus-node-exporterrestart: unless-stoppedvolumes:- /proc:/host/proc"- /sys:/host/sys"ports:- "9100:9100"networks:prometheus:ipv4_address: 172.22.0.22grafana:  # 用于UI展示image: registry.cn-hangzhou.aliyuncs.com/senfel/grafana:8.0.0container_name: prometheus-grafanarestart: unless-stoppedports:- "3000:3000"volumes:- ./grafana/data/grafana:/var/lib/grafana- /etc/localtime:/etc/localtime- ./grafana/plugins:/var/lib/grafana/plugins- ./grafana/grafana.ini:/etc/grafana/grafana.inienvironment:GF_EXPLORE_ENABLED: "true"GF_SECURITY_ADMIN_PASSWORD: "admin"GF_INSTALL_PLUGINS: "grafana-clock-panel,grafana-simple-json-datasource,alexanderzobnin-zabbix-app"depends_on:- prometheusnetworks:prometheus:ipv4_address: 172.22.0.33
4、部署Prometheus+Grafana+Exporter容器
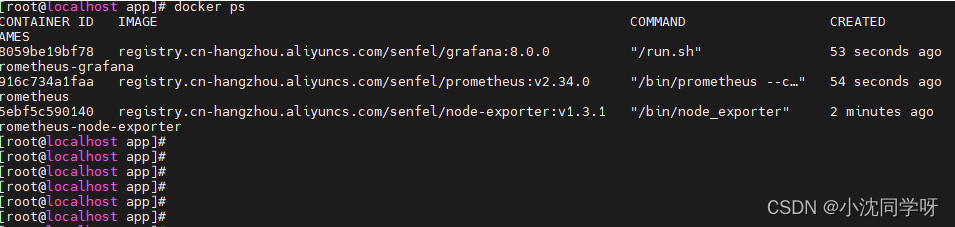
[root@localhost app]# docker-compose -f docker-compose-prometheus.yaml up -d
prometheus-node-exporter is up-to-date
Recreating prometheus … done
Recreating prometheus-grafana … done
[root@localhost app]# docker ps
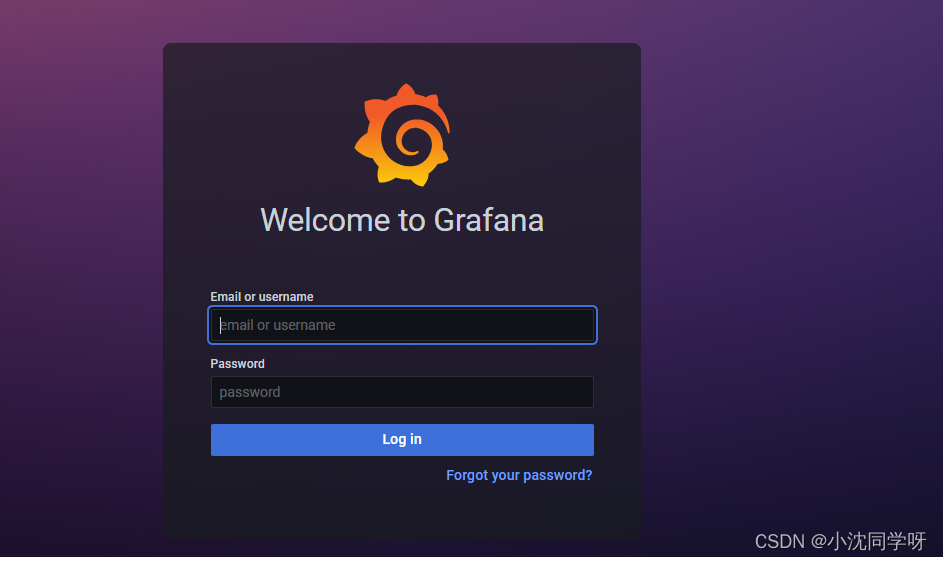
浏览器访问 http://10.10.22.91:3000/login
监控配置
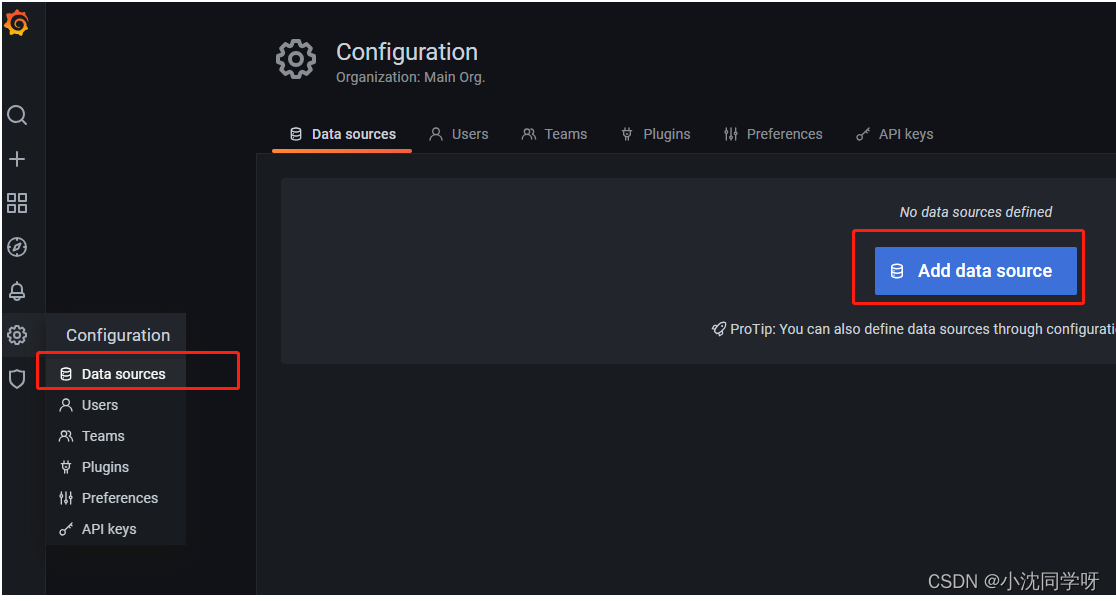
grafana配置prometheus数据源
1、点击 设置-data source 增加一个数据源
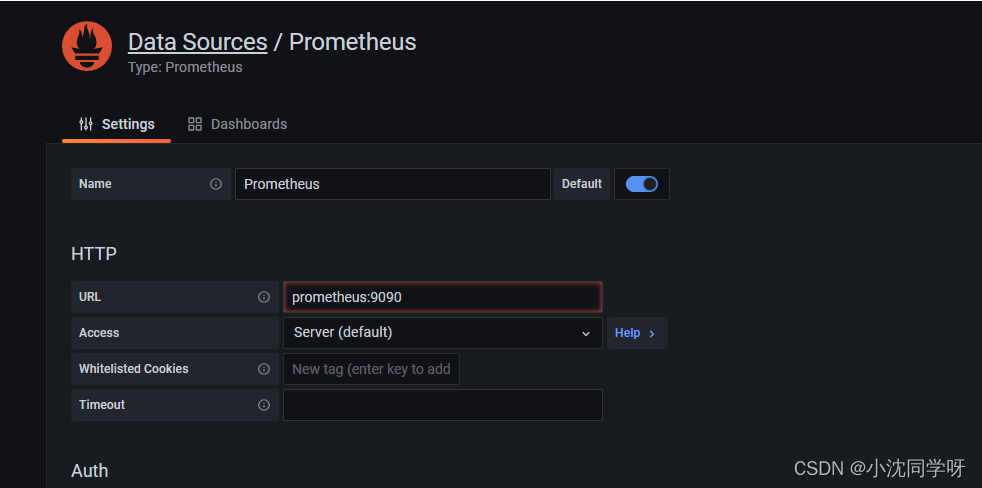
2、选择 prometheus 并配置路径
grafana配置dashboard
Spring Boot 2.1 Statistics:https://grafana.com/grafana/dashboards/10280
JVM (Micrometer):https://grafana.com/grafana/dashboards/4701
Linux Hosts Metrics: https://grafana.com/grafana/dashboards/10180-kds-linux-hosts/
Linux Host Metrics监控
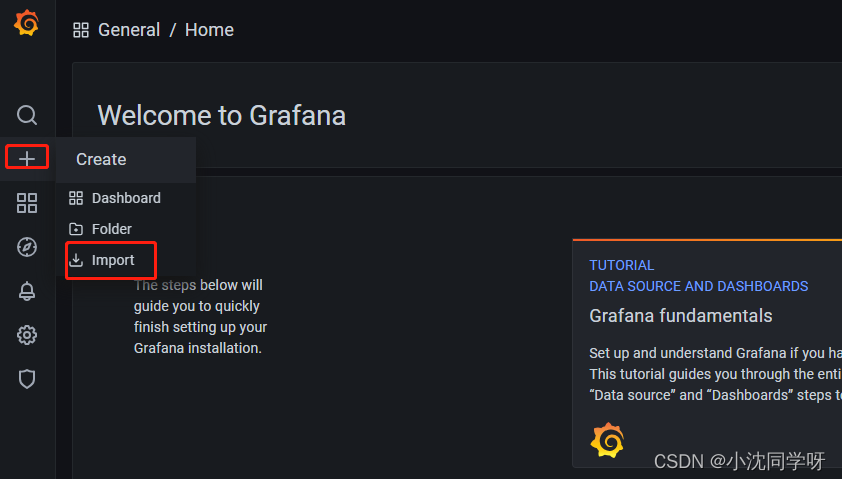
1、点击侧边栏 增加 import
2、输入模板ID 10180
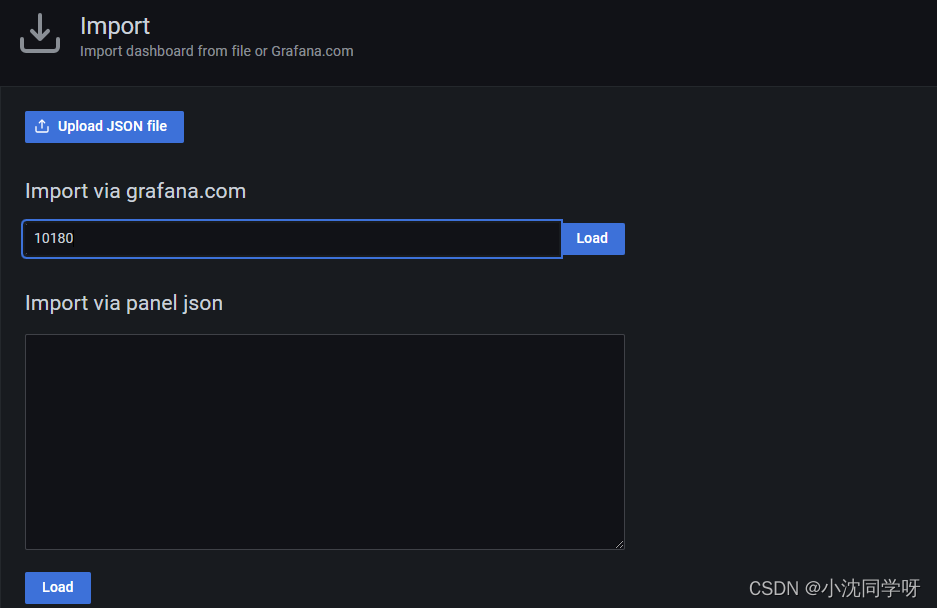
3、点击load加载
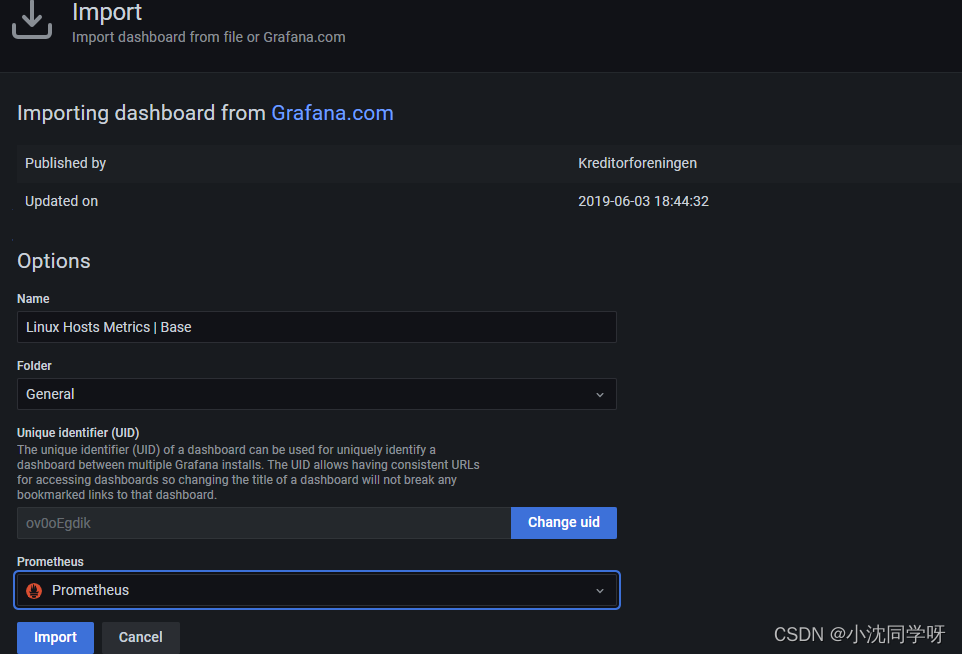
4、点击import导入
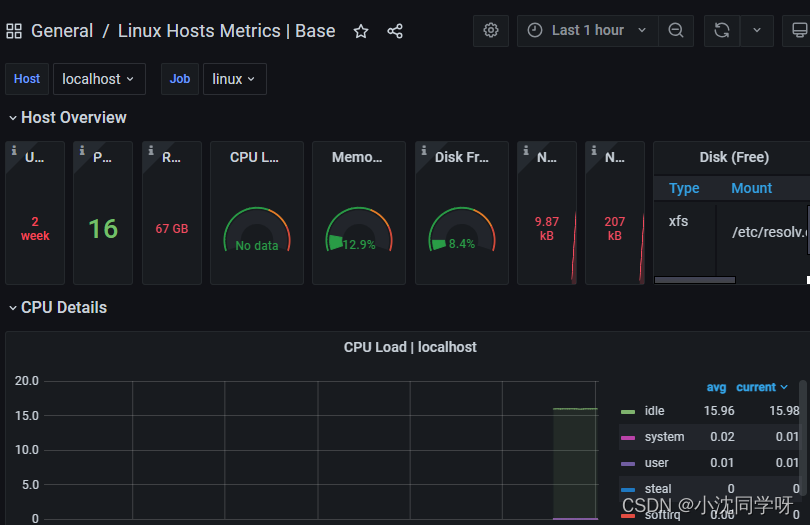
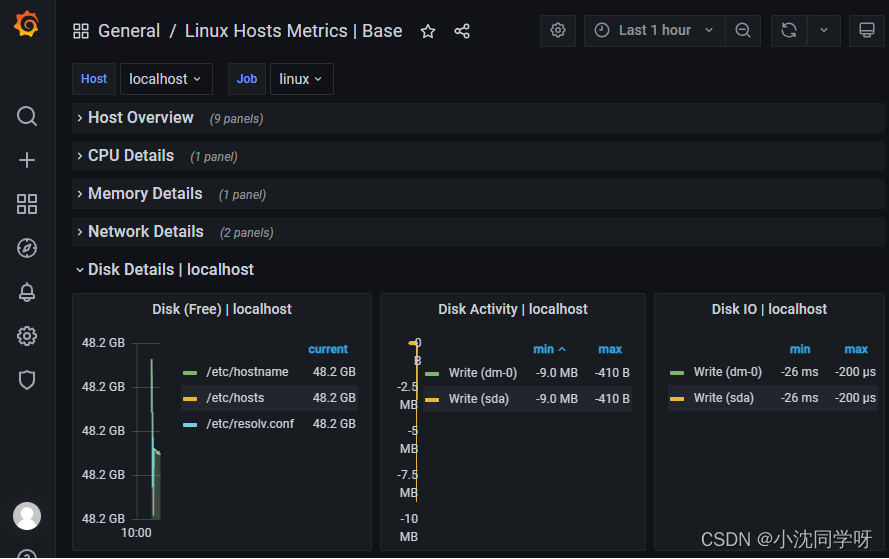
如图所示基本涵盖服务器主要参数监控信息。
Spring Boot 监控
由于prometheus主动拉群我们项目指标,故需要暴露监控端口,且需要对项目进行改造。
Spring Boot增加监控配置
1、引入pom依赖
org.springframework.boot
spring-boot-starter-actuator
io.micrometer
micrometer-registry-prometheus
2、增加application配置
management:endpoints:web:exposure:include: health,prometheus
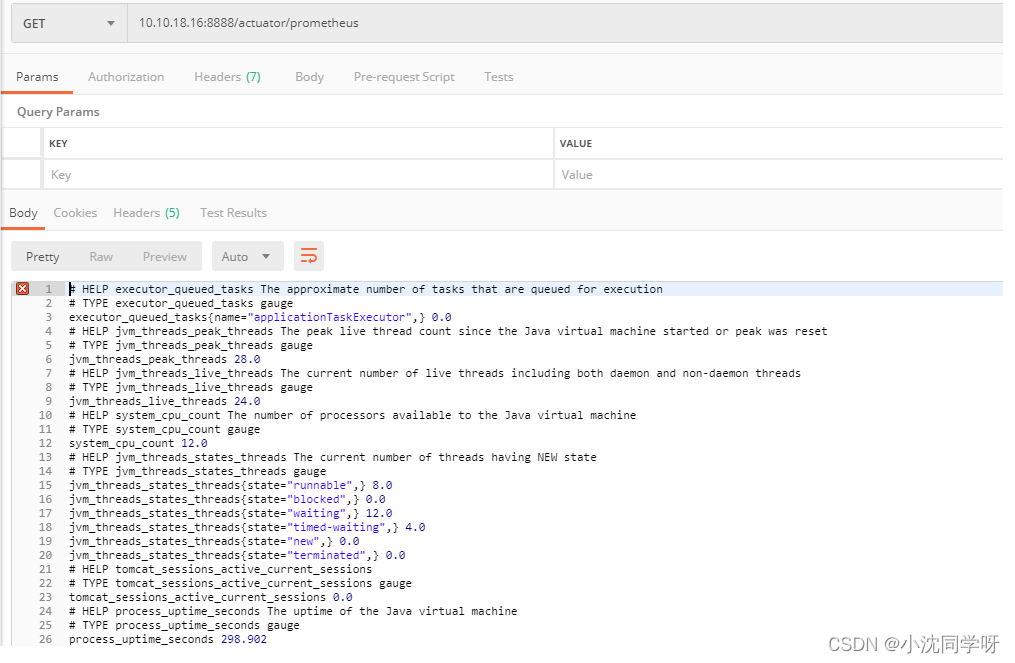
3、测试监控信息
启动项目
postman请求 10.10.18.16:8888/actuator/prometheus
导入Spring Boot 2.1 Statistics
1、点击侧边栏导入按钮-输入模板ID 10280
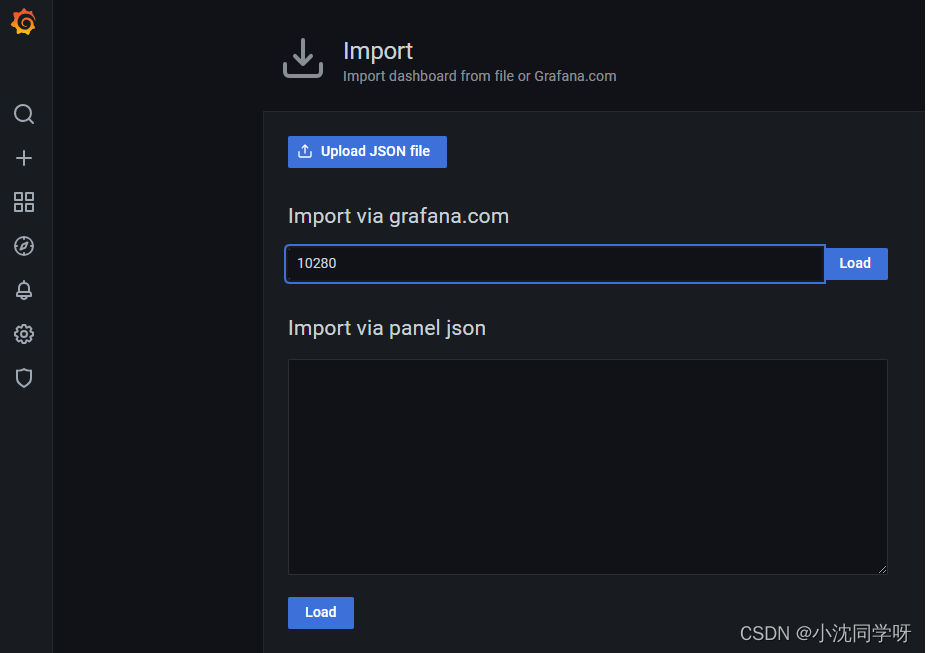
2、点击load加载仪表盘模板
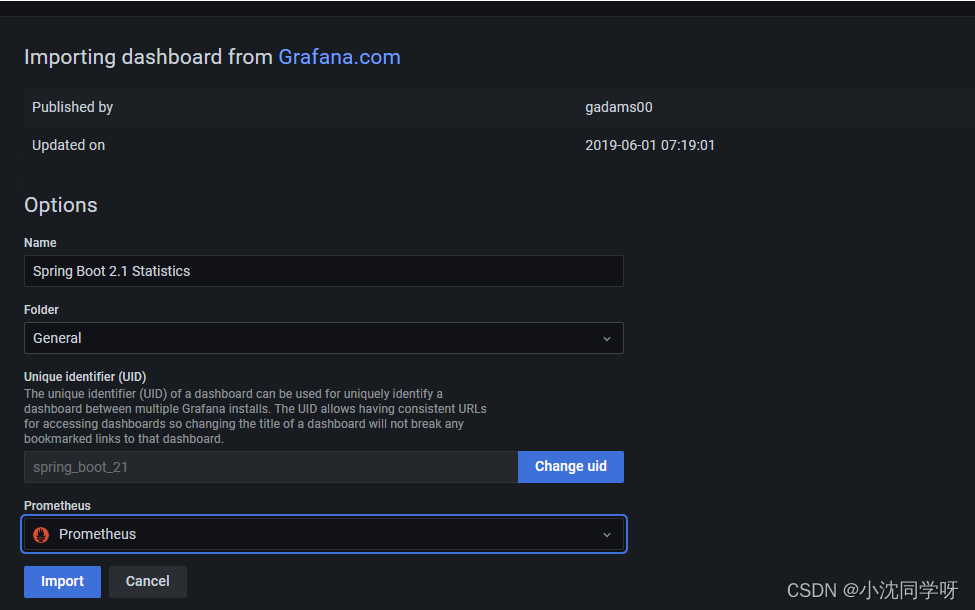
3、点击import导入即可
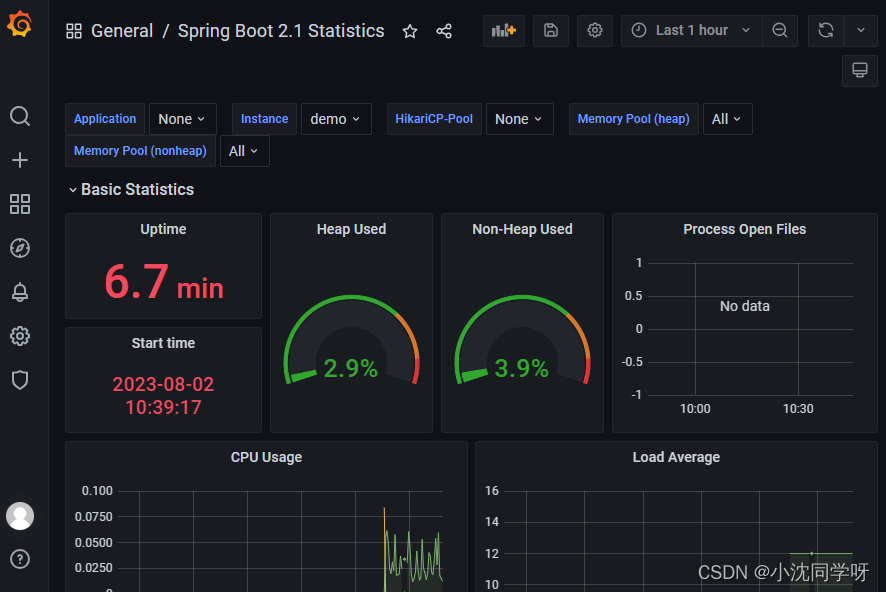
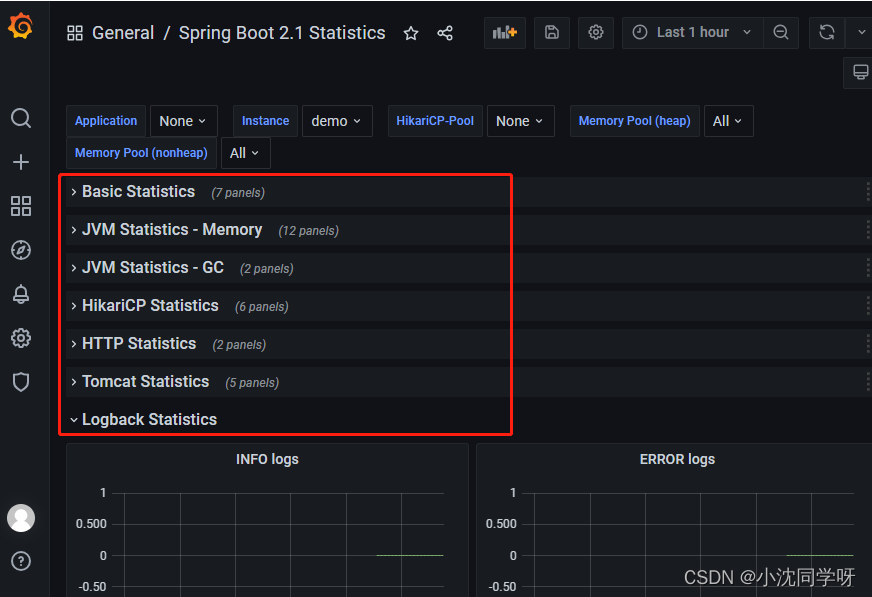
如图所示:基本涵盖所有的项目监控信息。
写在最后
本篇实战博文主要讲解了用docker-compose编排Prometheus、node-exporter、Grafana实现监控环境搭建,并叙述了Linux系统服务器指标监控,Springboot项目暴露指标接口进行全链路指标数据监控。当然,采用Grafana提供的Linux、Springboot监控仪表盘模板完全可以直接投入生产。
相关文章:
实战:Prometheus+Grafana监控Linux服务器及Springboot项目
文章目录 前言知识积累什么是Prometheus什么是Grafana怎样完成数据采集和监控 环境搭建docker与docker-compose安装docker-compose编写 监控配置grafana配置prometheus数据源grafana配置dashboardLinux Host Metrics监控Spring Boot 监控 写在最后 前言 相信大家都知道一个项目…...
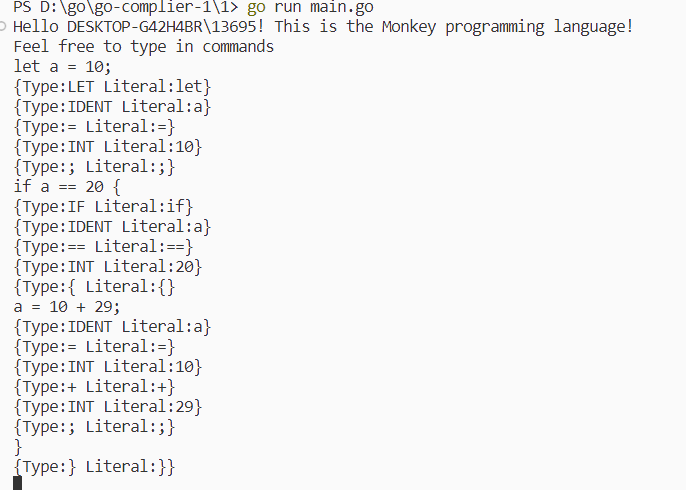
[用go实现解释器]笔记1-词法分析
本文是《用go实现解释器》的读书笔记 https://malred-blogmalred.github.io/2023/06/03/ji-suan-ji-li-lun-ji-shu-ji/shi-ti/go-compile/yong-go-yu-yan-shi-xian-jie-shi-qi/go-compiler-1/#toc-heading-6http://个人博客该笔记地址 github.com/malred/malanghttp:/…...

在 spark-sql / spark-shell / hive / beeline 中粘贴 sql、程序脚本时的常见错误
一个很小的问题,简单记录一下。有时候我们会粘贴一段已经成功运行过的SQL或程序脚本,但是在spark-sql / spark-shell / hive / beeline 中执行时可能会报这样的错误: hive> CREATE EXTERNAL TABLE IF NOT EXISTS ORDERS(> Display all…...
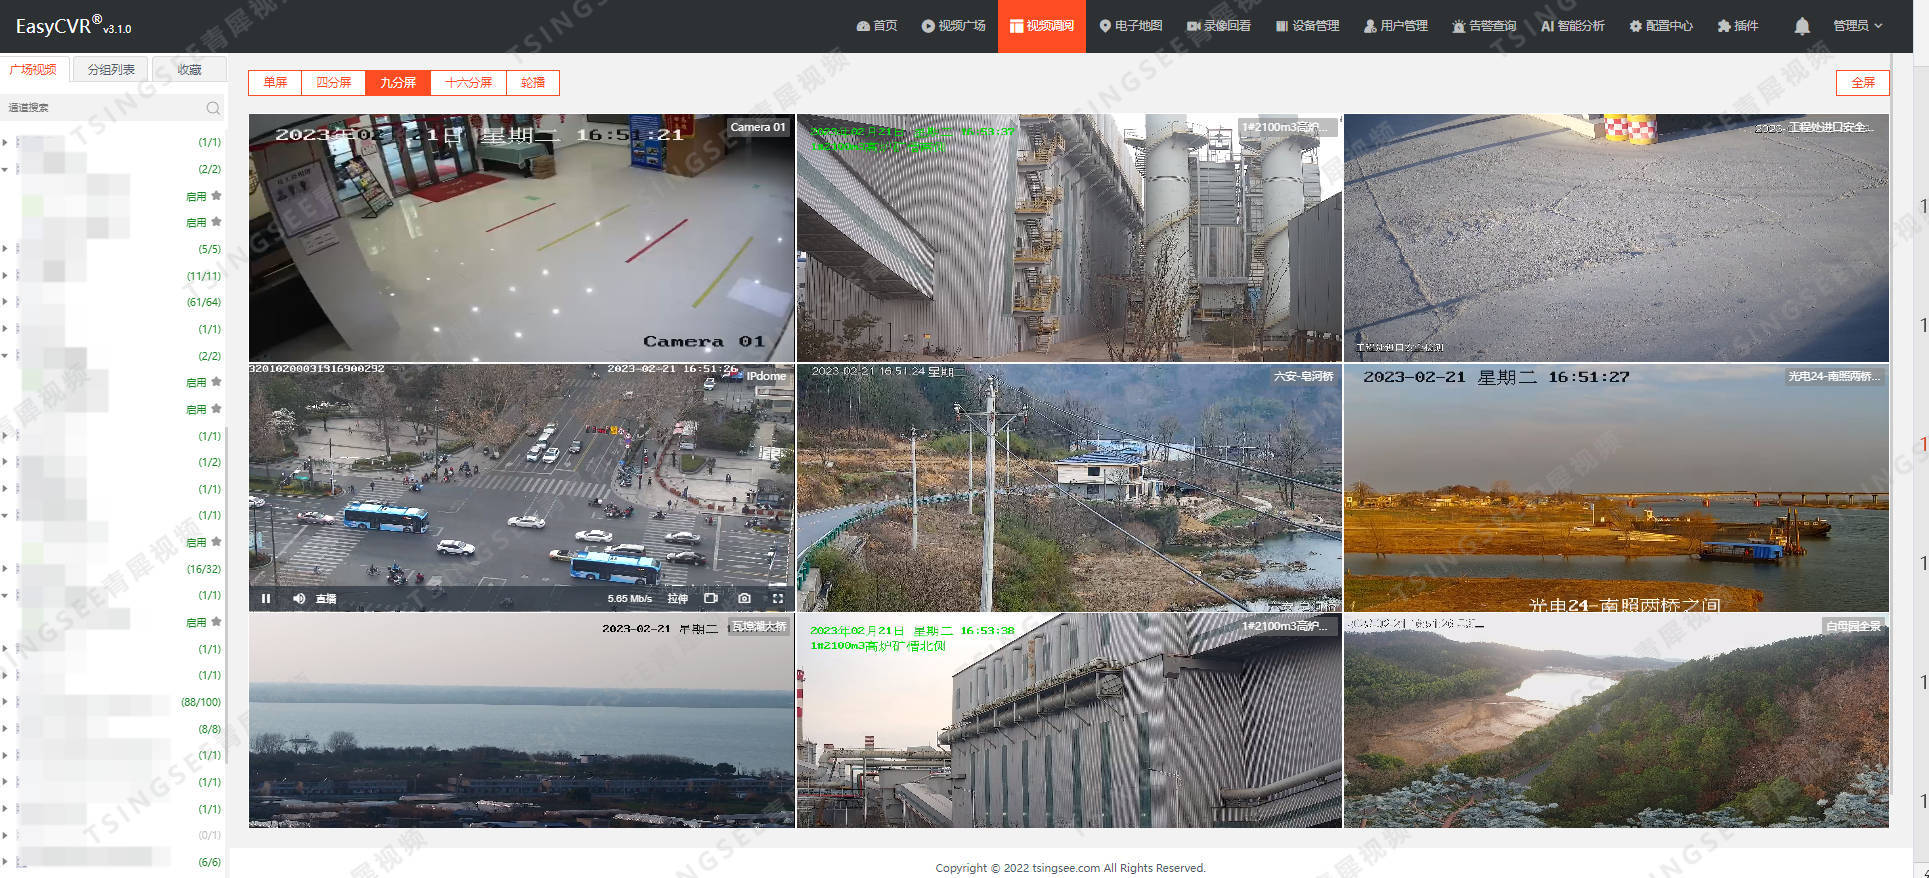
关于视频汇聚融合EasyCVR平台多视频播放协议的概述
视频监控综合管理平台EasyCVR具备视频融合能力,平台基于云边端一体化架构,具有强大的数据接入、处理及分发能力,平台既具备传统安防视频监控的能力与服务,也支持AI智能检测技术的接入,可应用在多行业领域的智能化监管场…...

三星书画联展:三位艺术家开启国风艺术之旅
7月22日,由广州白云区文联、白云区工商联主办的“三星书画联展”,在源美术馆正式开展。本次书画展展出的艺术种类丰富,油画、国画、彩墨画、书法等作品异彩纷呈。广东省政协原副主席、农工党省委书画院名誉院长马光瑜,意大利艺术研…...
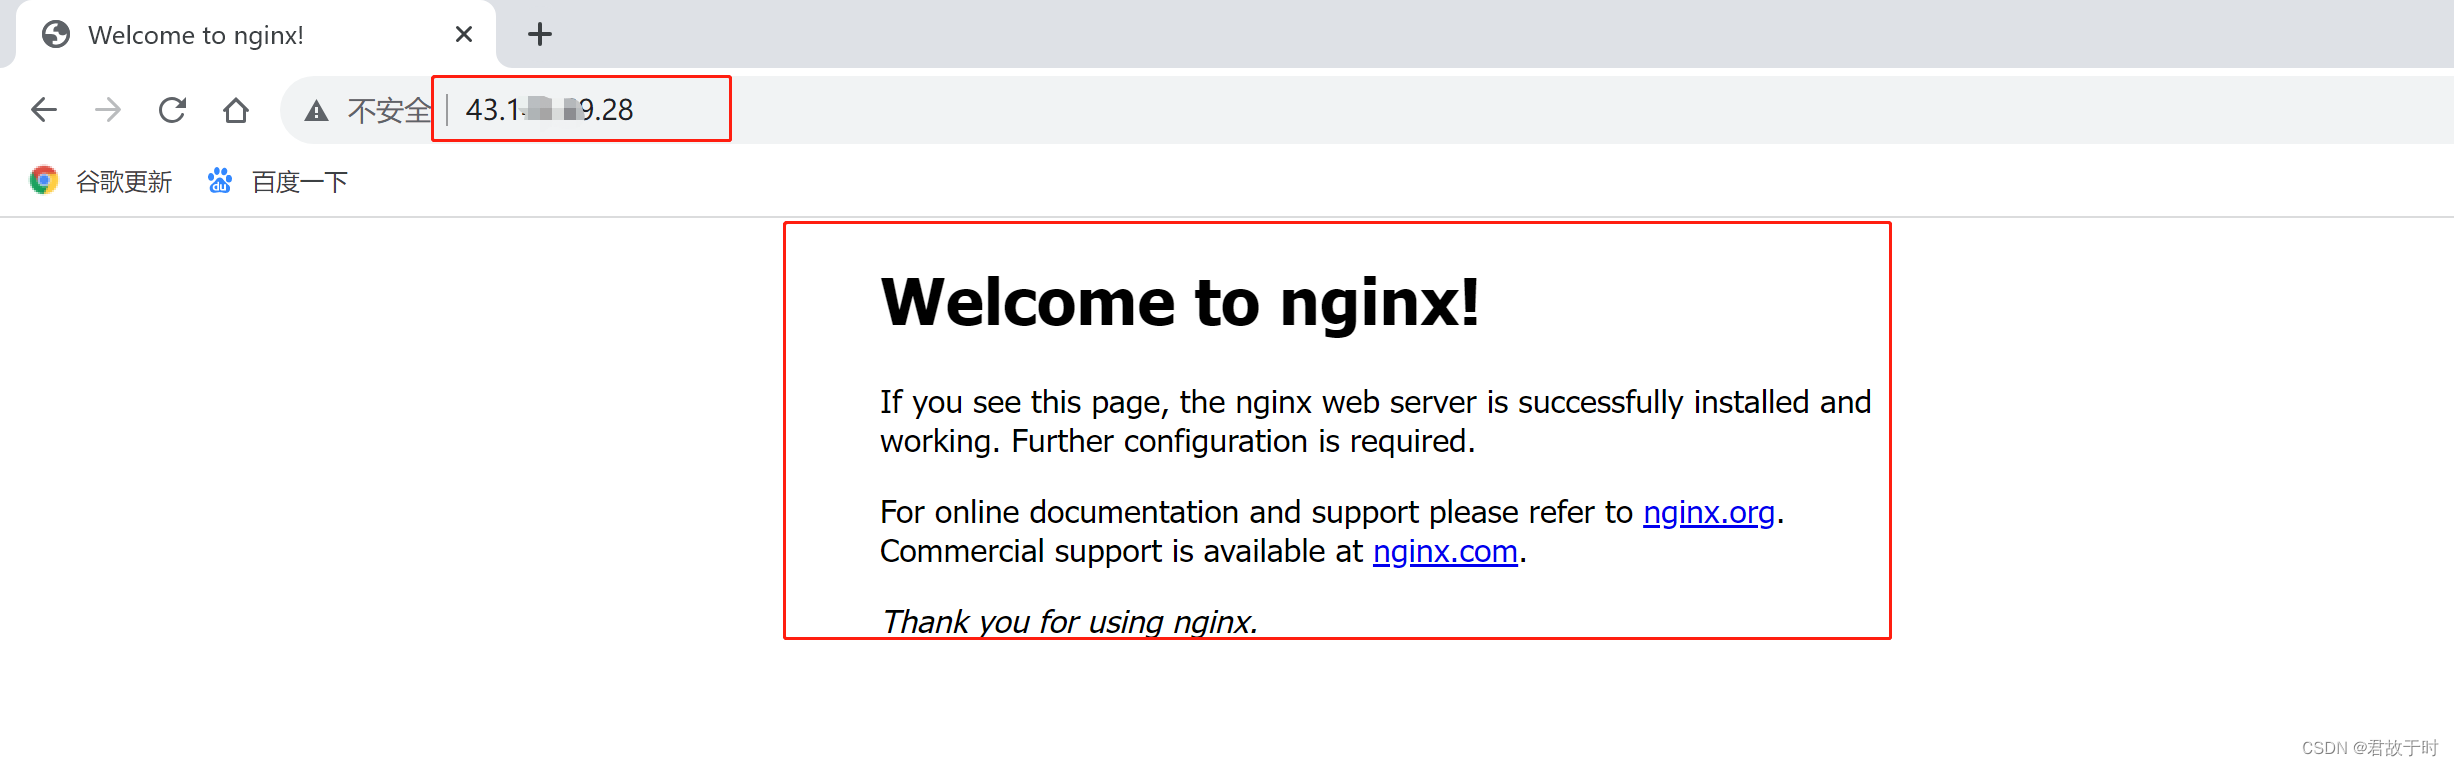
在腾讯云服务器OpenCLoudOS系统中安装nginx(有图详解)
1. 创建安装目录 2. 下载、安装、编译 进入安装目录: cd /app/soft/nginx/ 下载: wget https://nginx.org/download/nginx-1.21.6.tar.gz 解压: tar -zxvf nginx-1.21.6.tar.gz 安装插件: yum -y install pcre-devel 安装…...

大数据课程E5——Flume的Selector
文章作者邮箱:yugongshiye@sina.cn 地址:广东惠州 ▲ 本章节目的 ⚪ 了解Selector的概念和配置属性; ⚪ 掌握Selector的使用方法; 一、简介 1. 概述 1. Selector本身是Source的子组件,决定了将数据分发给哪个Channel。 2. Selector中提供了两种模式: …...

在线查看浏览器
随着网络的兴起,电影和电视剧已经成为我们生活中必不可少的乐趣。然而,像爱奇艺、优酷、腾讯、芒果等等这些平台,我们想要看好视频,需要开通VIP,虽然价格不是很高,但是我们能省则省啊,今天我就给…...
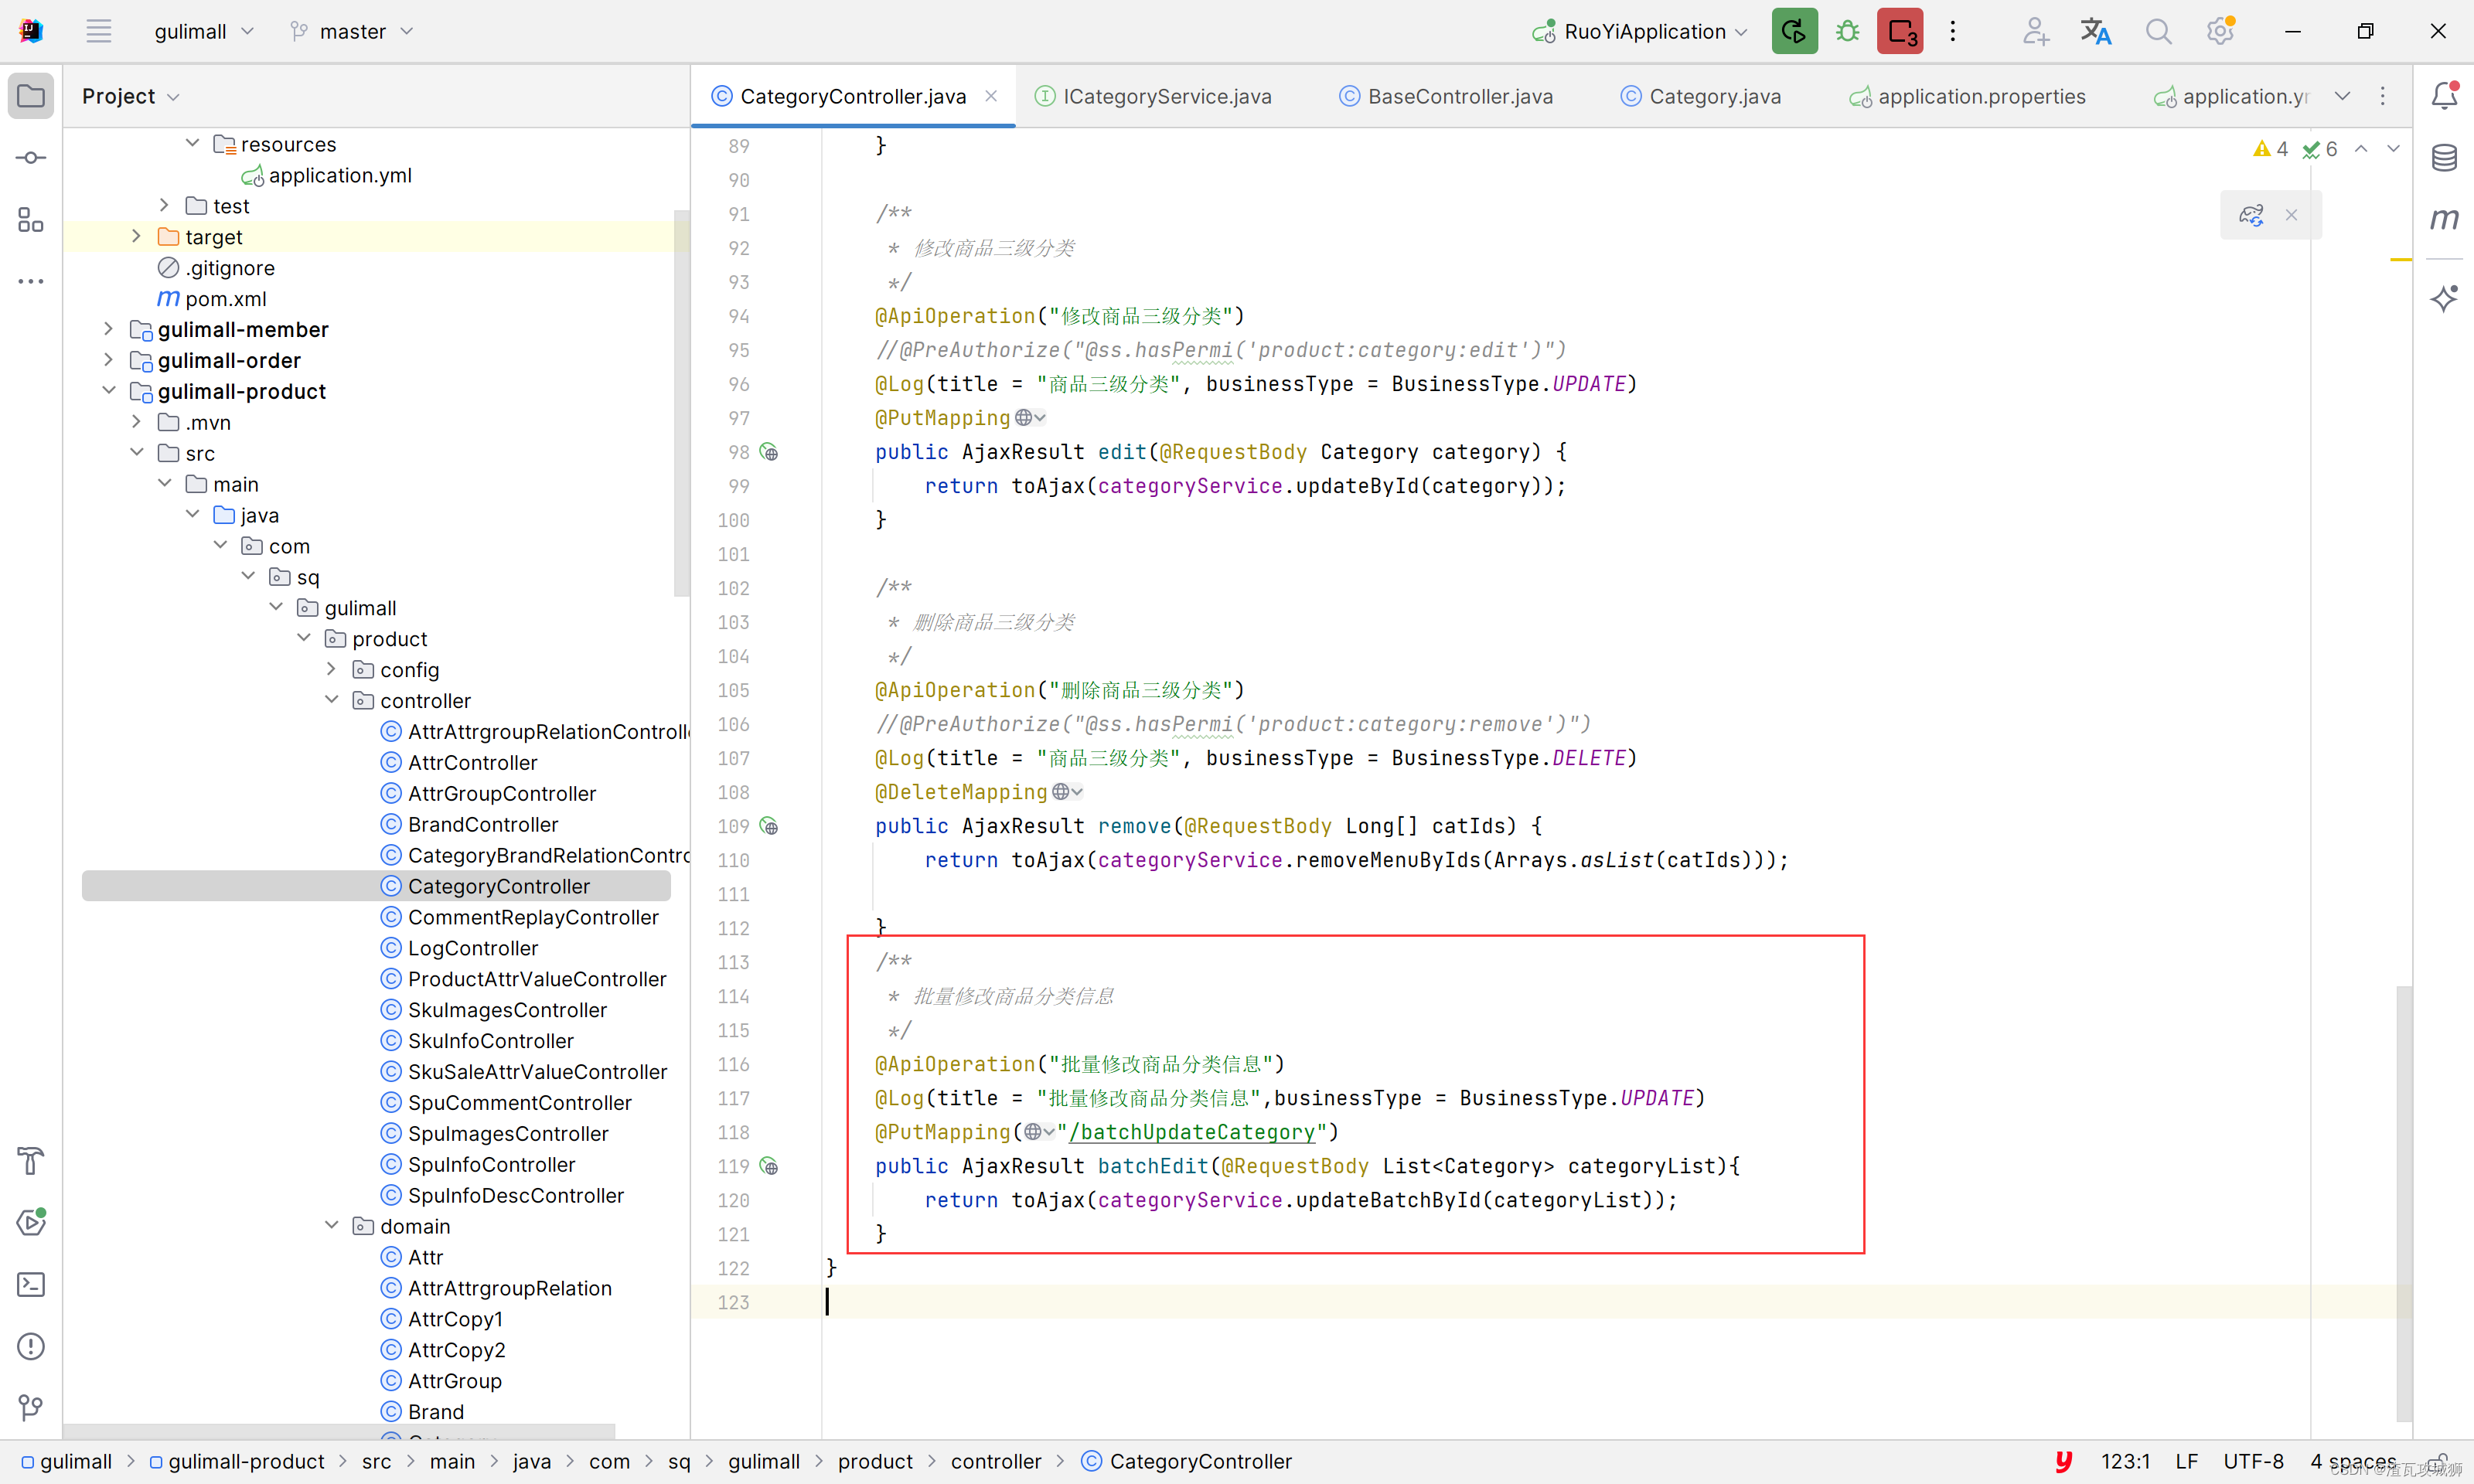
谷粒商城第七天-商品服务之分类管理下的分类的拖拽功能的实现
目录 一、总述 1.1 前端思路 1.2 后端思路 二、前端实现 2.1 判断是否能进行拖拽 2.2 收集受影响的节点,提交给服务器 三、后端实现 四、总结 一、总述 这个拖拽功能对于这种树形的列表,整体的搬迁是很方便的。但是其实现却并不是那么的简单。 …...
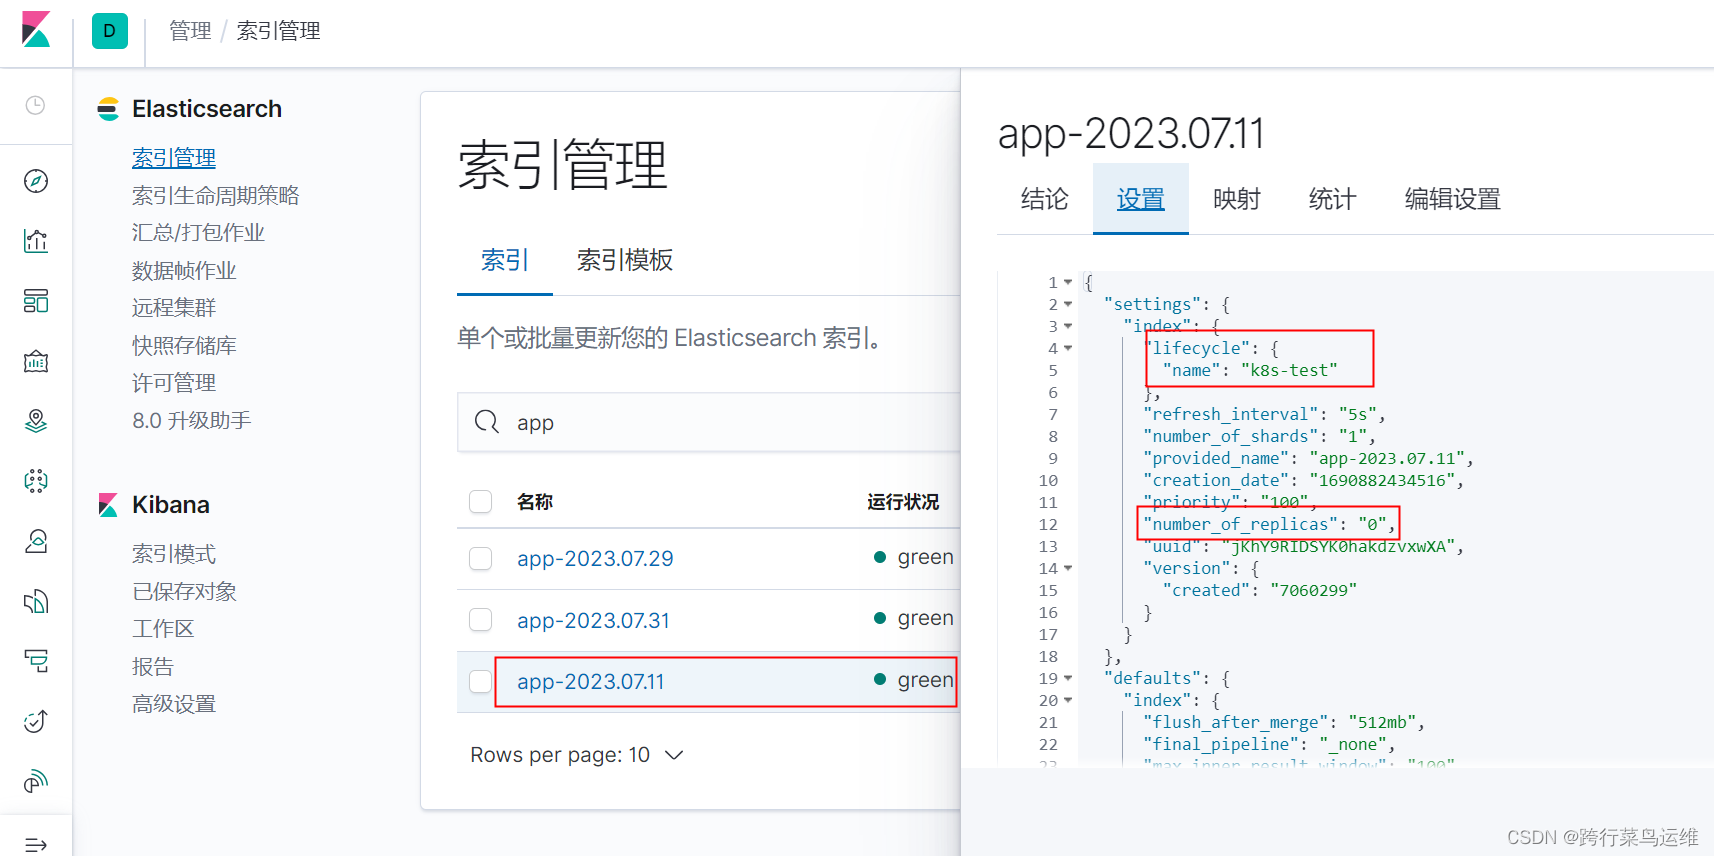
解决单节点es索引yellow
现象 单节点的es,自动创建索引后,默认副本个数为1,索引状态为yellow 临时解决 修改副本个数为0 永久解决 方法1、修改elasticsearch.yml文件,添加配置并重启es number_of_replicas:副本分片数,默认…...

Java虚拟机在类加载阶段都做了些什么,才使得我们可以运行Java程序
前言: 今天和大家探讨一道Java中经典的面试题,这道面试题经常出现在各个公司的面试中,结合周志明,老师的《深入理解Java虚拟机》书籍,本篇文章主要讲解Java类加载机制的知识。该专栏比较适合刚入坑Java的小白以及准备秋…...

华为认证 | 学HCIE,想培训需要注意啥?
HCIE(华为认证网络专家)是华为技术认证体系中的最高级别认证,对于网络工程师来说考试难度也比较高,一般来说,需要进行培训。 那么HCIE考试培训需要注意啥? 01 充分了解认证要求 在开始准备HCIE认证之前&a…...

这所211考数一英二,学硕降分33分,十分罕见!
一、学校及专业介绍 合肥工业大学(Hefei University of Technology),简称“合工大”,校本部位于安徽省合肥市,是中华人民共和国教育部直属的全国重点大学,是国家“双一流”建设高校, 国家“211工…...

关于BQ27427的配置问题
EVM是TI家做的BQ27427的开发板,这款芯片还挺新的。 大概是这样,一块开发板要一千多块钱,使用的时候还出现了一些奇怪的问题。 配置使用的是买的盗版的EV2400,就是黑色的那个东西,使用的通信方式IIC。 TI手册上写的软件…...

试卷还原成空白卷怎么做?分享个简单的方法
在进行考试时,可能会填错答案或想要重新测试,此时需要正确擦除填写的试卷答案。下面介绍一些需要注意的事项以及正确的擦除方法。 使用橡皮擦或橡皮 正确的擦除方法是使用橡皮擦或橡皮对填写的答案进行擦除。首先,将橡皮擦或橡皮放置在试卷上…...

查看学校名称中含北京的用户
查看学校名称中含北京的用户_牛客题霸_牛客网 1.like select device_id,age,university from user_profile where university like %北京%; 注意虽然按实际需求,北京一般是排在最前面,即北京%,但是严格意义上来说,搜索含有北京…...
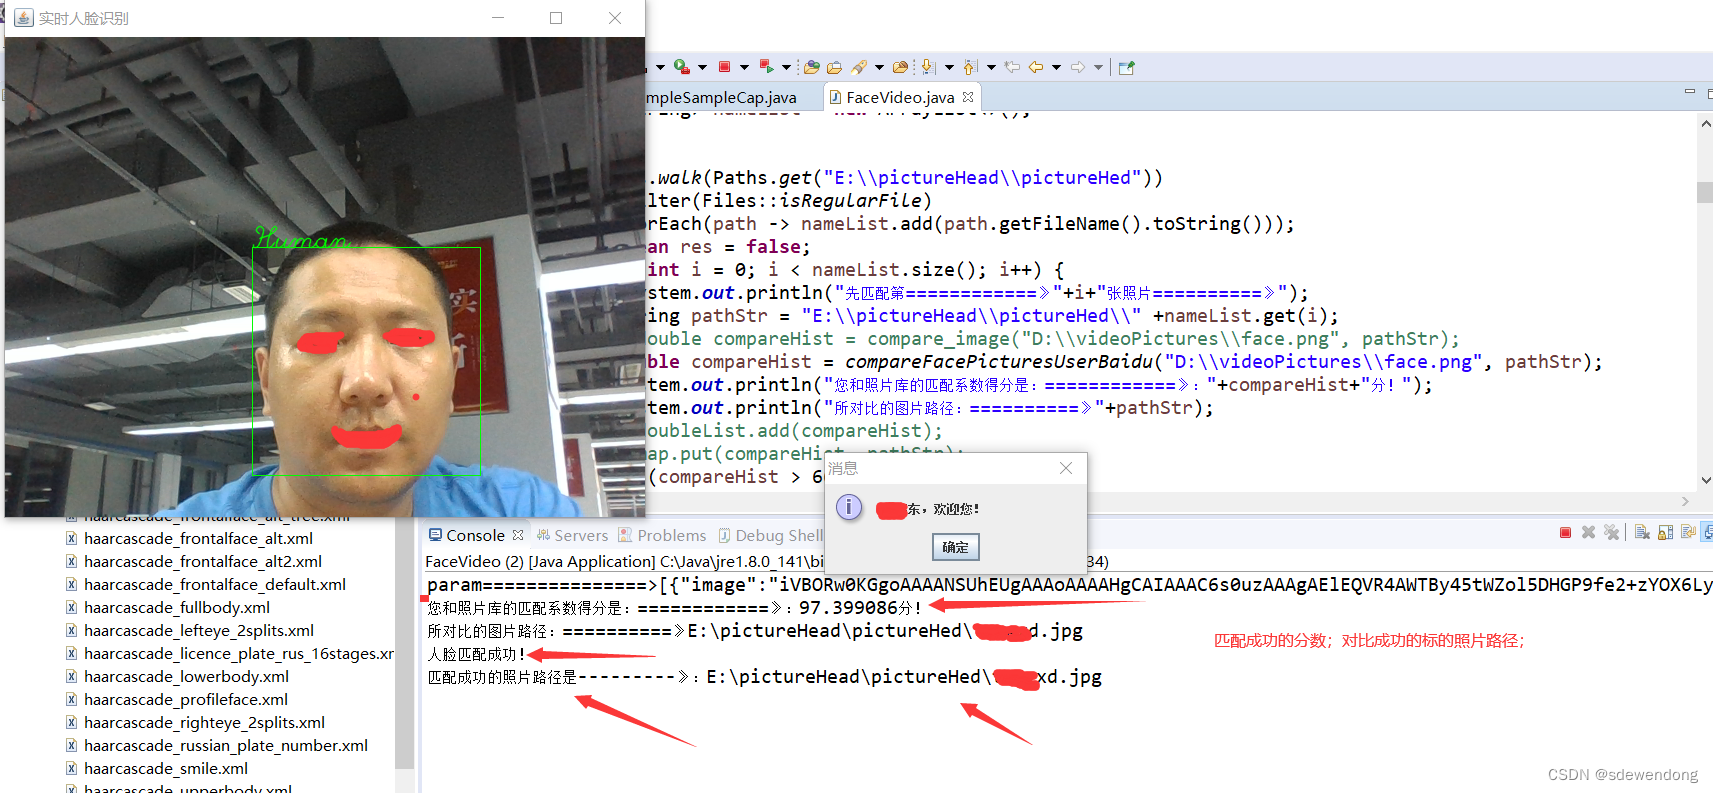
快速开发人脸识别系统Java版本
简介: 先说下什么是人脸识别系统:举个例子,公司门口有个人脸识别系统,员工站到门口,看着摄像头,大屏幕上会抓拍到你的人脸,然后和公司的员工照片库里的照片比对,比对成功就提示&…...

Reinforcement Learning with Code 【Code 1. Tabular Q-learning】
Reinforcement Learning with Code 【Code 1. Tabular Q-learning】 This note records how the author begin to learn RL. Both theoretical understanding and code practice are presented. Many material are referenced such as ZhaoShiyu’s Mathematical Foundation o…...
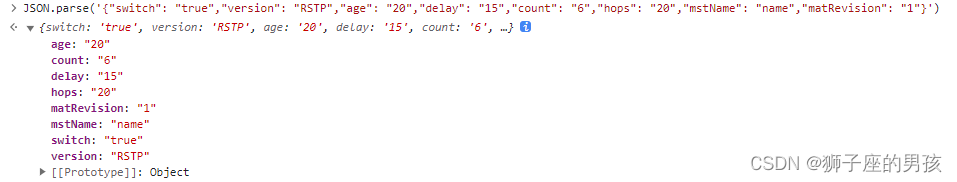
解决:Uncaught (in promise) SyntaxError: “[object Object]“ is not valid JSON 问题的过程
1、问题描述: 其一、报错为: Uncaught (in promise) SyntaxError: "[object Object]" is not valid JSON 中文为: 未捕获(承诺中)语法错误:“[object Object]”不是有效的 JSON 其二、问题描…...

机器学习-New Optimization
机器学习(New Optimization) 前言: 学习资料 videopptblog 下面的PPT里面有一些符号错误,但是我还是按照PPT的内容编写公式,自己直到符号表示什么含义就好了 Notation 符号解释 θ t \theta_t θt第 t 步时,模型的参数 Δ L …...

3个12位ADC+17个定时器+摄像头接口:STM32F207IGT6的电机控制与机器视觉资源
STM32F207IGT6:176引脚工业级MCU的连接性与性能解析在工业自动化、电机控制以及物联网网关等应用中,MCU的性能不仅取决于主频,更取决于内部总线架构对瓶颈的突破。STM32F207IGT6是意法半导体STM32F2系列中的大容量型号,采用2424mm…...
式API的实现原理)
CargoBay源码解析:深入理解块(block)式API的实现原理
CargoBay源码解析:深入理解块(block)式API的实现原理 【免费下载链接】CargoBay The Essential StoreKit Companion 项目地址: https://gitcode.com/gh_mirrors/ca/CargoBay CargoBay是一个功能强大的iOS StoreKit辅助库,它为Apple的应用内购买框…...

地理数据可视化:地图绑定与空间分析
地理数据可视化:地图绑定与空间分析 前言 大家好,我是前端老炮儿。今天咱们来聊聊地理数据可视化! 地理数据可视化是数据可视化领域的一个重要分支,它可以帮助我们直观地展示和分析空间数据。无论是地图展示、区域分析还是位置追踪…...

cann/asc-devkit寄存器向量计算实践
Reg Vector Compute Practices Example Introduction 【免费下载链接】asc-devkit 本项目是CANN 推出的昇腾AI处理器专用的算子程序开发语言,原生支持C和C标准规范,主要由类库和语言扩展层构成,提供多层级API,满足多维场景算子开发…...

ARMv8/v9架构TRCIDR寄存器详解与调试实践
1. AArch64 TRCIDR寄存器概述在ARMv8/v9架构的调试系统中,TRCIDR(Trace ID Registers)系列寄存器扮演着关键角色。这些64位系统寄存器专门用于向软件报告处理器的跟踪单元功能特性,是调试基础设施的重要组成部分。当处理器实现了F…...

作业5:案例挑战
文章目录1、密码锁设计 P110,2、基于PWM的可调光台灯设计 P131,3、动态密码获取系统设计 P210,效果(1) 密码模式说明(2) 测试密码输入(3) 测试修改密码(4) 测试修改密码模式4、数码管时钟系统设计 P228,7.5.2 数码管时钟系统设计&…...

终极指南:5分钟让Switch手柄在Windows上完美运行
终极指南:5分钟让Switch手柄在Windows上完美运行 【免费下载链接】BetterJoy Allows the Nintendo Switch Pro Controller, Joycons and SNES controller to be used with CEMU, Citra, Dolphin, Yuzu and as generic XInput 项目地址: https://gitcode.com/gh_mi…...

Tomcat DefaultServlet MIME类型处理缺陷导致信息泄露
1. 这个漏洞不是“能读文件”那么简单,而是Tomcat在特定配置下主动把不该暴露的内部状态当HTTP响应发出去了CVE-2024-21733这个编号刚出来时,我第一反应是又一个“目录遍历”或“文件读取”类的老套路。但真正花半天时间搭环境复现、抓包分析、翻Tomcat源…...

Unity 2D项目初始化实战:从零搭建可维护游戏骨架
1. 这不是“又一个Unity入门教程”,而是我带三个实习生从零做出第一个可玩Demo的真实路径你搜“Unity 2D 教程”,首页全是“5分钟创建角色”“10行代码实现跳跃”——画面很炫,但关掉视频后,你连项目文件夹里该删哪个.meta、该留哪…...

SpinalHDL流水线设计:从时序抽象到工程实践
1. 项目概述:从Verilog的“线”到SpinalHDL的“流”在数字电路设计里,时序逻辑的流水线(Pipeline)是个老生常谈但又至关重要的概念。无论是为了提升系统主频,还是为了平衡组合逻辑路径的延迟,我们总免不了要…...