echarts一些配置项的使用
前言:我是自己最近写项目用到的,我做个整理;
一. 基本使用
1.具有大小(宽高)的div ,id唯一;
例如:
<div id="crewEchart"></div>2.在项目中引入:
import * as echarts from "echarts";3.写一个关于他的方法,在mounted的时候调用:
mounted() {this.setEcharts()//你自己起一个功能相关的名字就行;}4.在methods中写他的配置项:
methods:{setWarnEcharts(){},
}
二.配置项
以折线图为例:
1.图:
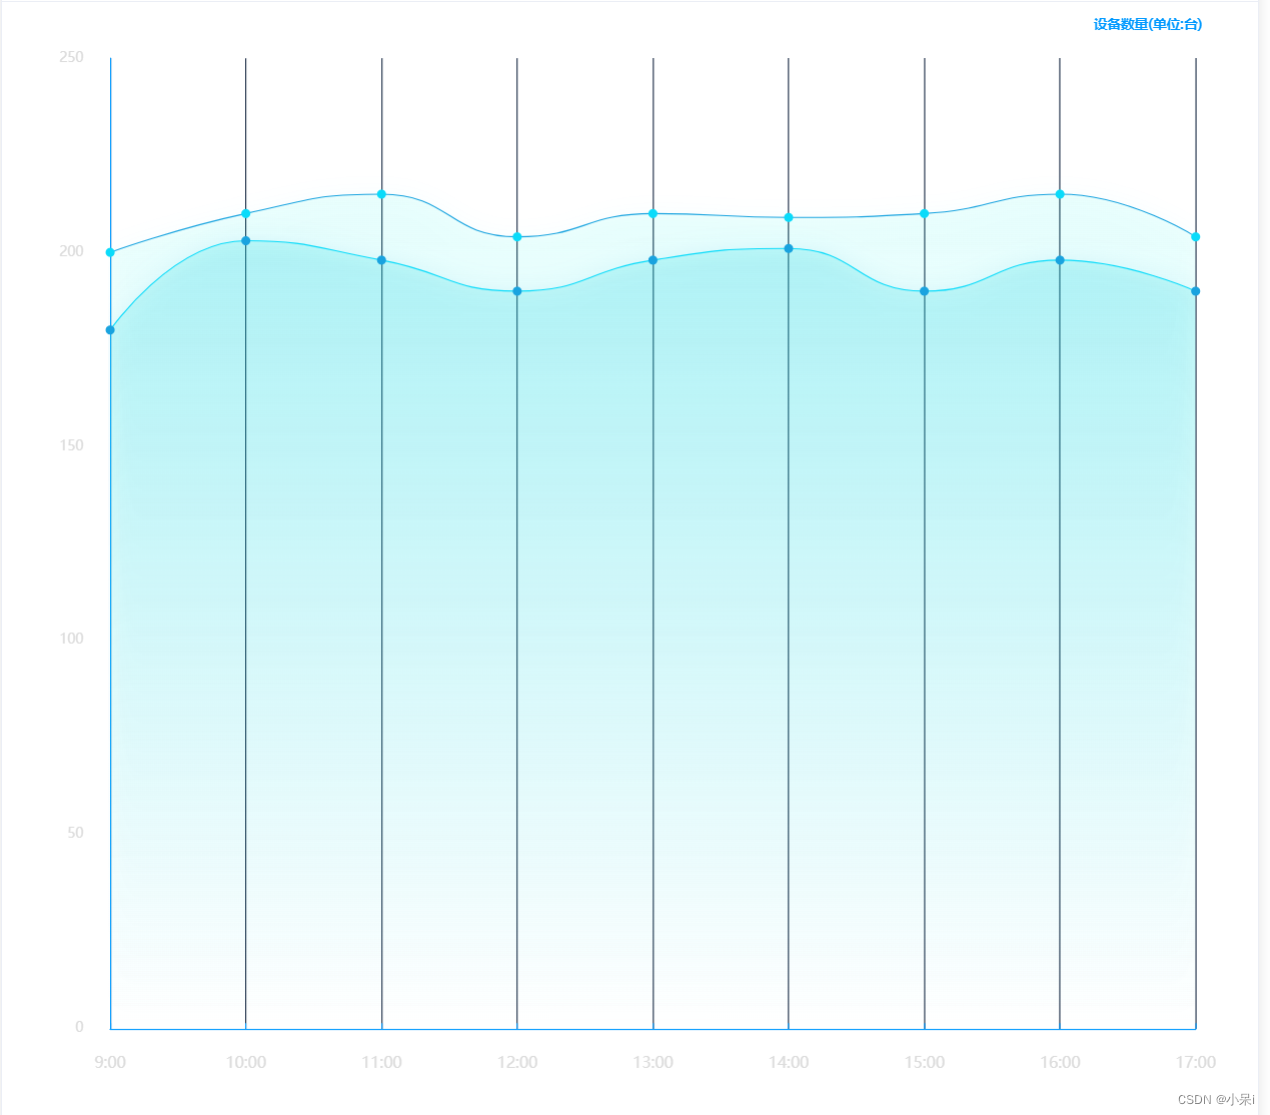
2.代码:
methods:{setWarnEcharts(){let xLabel =['9:00', '10:00', '11:00', '12:00', '13:00', '14:00', '15:00', '16:00', '17:00']
let online = ["180", "203", "198", "190", "198", "201", "190", "198", "190"]
let sum = ["200", "210", "215", "204", "210", "209", "210", "215", "204",]option = {title: {text: '设备数量(单位:台)',top: 10,right: '4%',bottom: '2%',textStyle: {color: '#0099FF',fontSize: 12,fontFamily: 'Microsoft YaHei'}},grid: {top: 50,left: '6%',right: '5%',bottom: '8%',containLabel: true},tooltip: {trigger: 'axis',backgroundColor:'transparent',axisPointer: {lineStyle: {type: 'solid',width: 3,color: {type: 'linear',x: 0,y: 0,x2: 0,y2: 1,colorStops: [{offset: 0,color: 'rgba(126,199,255,0)' // 0% 处的颜色}, {offset: 0.5,color: 'rgba(126,199,255,1)' // 100% 处的颜色}, {offset: 1,color: 'rgba(126,199,255,0)' // 100% 处的颜色}],global: false // 缺省为 false}},},formatter: (p) => {let dom = `<div style="width: 100px;height: 50px;;color:#fff;position: relative;"><svg style="position: absolute;top: 50%;left: 50%;transform: translateX(-50%) translateY(-50%);" class="svg" xmlns="http://www.w3.org/2000/svg" width="100" height="71" viewBox="0 0 84 55"><defs><style>.cls-1 {fill: #07172c;fill-opacity: 0.8;stroke: #a7d8ff;stroke-linejoin: round;stroke-opacity: 0.2;stroke-width: 1px;fill-rule: evenodd;}</style></defs><path id="矩形_419" data-name="矩形 419" class="cls-1" d="M266,595h74v50H266V624.046L261,620l5-3.984V595Z"transform="translate(-258.5 -592.5)" /></svg><div style="padding: 4px 8px 4px 14px;display: flex;justify-content: center;align-items: center;flex-direction: column;position: relative;z-index: 1;"><div style="margin-bottom: 4px;width:100%;display:${p[0]?'flex':'none'};justify-content:space-between;align-items:center;"><span style="font-size:14px;color:#7ec7ff;">${p[0]?p[0].seriesName:''}</span><span style="font-size:14px;color:#fff;">${p[0]?p[0].data:''}</span></div><div style="width:100%;height:100%;display:${p[1]?'flex':'none'};justify-content:space-between;align-items:center;"><span style="font-size:14px;color:#7ec7ff;">${p[1]?p[1].seriesName:''}</span><span style="font-size:14px;color:#fff;">${p[1]?p[1].data:''}</span></div></div></div>`return dom}},xAxis: [{type: 'category',boundaryGap: false,axisLine: { //坐标轴轴线相关设置。数学上的x轴lineStyle: {color: '#0099FF'},},axisLabel: { //坐标轴刻度标签的相关设置textStyle: {show: true,color: '#DBDBDB',padding: 16,fontSize: 14},formatter: function(data) {return data}},splitLine: {show: true,lineStyle: {color: '#192a44'},},axisTick: {show: true,inside: true},data: xLabel}],yAxis: [{//name: '数量',nameTextStyle: {color: "#7ec7ff",fontSize: 16,padding: 10},min: 0,splitLine: {show: false,lineStyle: {color: '#2AF4F7'},},axisLine: {show: true,lineStyle: {color: "#0099FF"},},axisLabel: {show: true,textStyle: {color: '#DBDBDB',padding: 16},formatter: function(value) {if (value === 0) {return value}return value}},axisTick: {show: false,},}],series: [{name: '在线:',type: 'line',symbol: 'circle', showAllSymbol: true,symbolSize: 8,smooth: true,lineStyle: {normal: {width: 1,color: "rgba(10,219,250,1)", // 线条颜色},//borderColor: 'rgba(0,0,0,.4)',},itemStyle: {color: "rgba(25,163,223,1)",borderColor: "#646ace",borderWidth: 0},tooltip: {show: true},areaStyle: { //区域填充样式normal: {//线性渐变,前4个参数分别是x0,y0,x2,y2(范围0~1);相当于图形包围盒中的百分比。如果最后一个参数是‘true’,则该四个值是绝对像素位置。color: new echarts.graphic.LinearGradient(0, 0, 0, 1, [{offset: 0,color: "rgba(50,228,228,0.3)"},{offset: 1,color: "rgba(50,228,228,0)"}], false),shadowColor: 'rgba(25,163,223,0.5)', //阴影颜色shadowBlur: 20 //shadowBlur设图形阴影的模糊大小。配合shadowColor,shadowOffsetX/Y, 设置图形的阴影效果。}},data: online}, {name: '总数:',type: 'line',symbol: 'circle', showAllSymbol: true,symbolSize: 8,smooth: true,lineStyle: {normal: {width: 1,color: "#19a3df", // 线条颜色},borderColor: 'rgba(0,0,0,.4)',},itemStyle: {color: "rgba(10,219,250,1)",borderColor: "#646ace",borderWidth: 0},tooltip: {show: true},areaStyle: { //区域填充样式normal: {stack: true,//线性渐变,前4个参数分别是x0,y0,x2,y2(范围0~1);相当于图形包围盒中的百分比。如果最后一个参数是‘true’,则该四个值是绝对像素位置。color: new echarts.graphic.LinearGradient(0, 0, 0, 1, [{offset: 0,color: "rgba(10,810,224,0.1)"},{offset: 1,color: "rgba(10,810,224,0)"}], false),shadowColor: 'rgba(10,219,250, 0.5)', //阴影颜色shadowBlur: 20 //shadowBlur设图形阴影的模糊大小。配合shadowColor,shadowOffsetX/Y, 设置图形的阴影效果。}},data: sum}]
};let len = 0
setInterval(()=>{if(len === xLabel.length){len = 0}myChart.dispatchAction({type: 'showTip',seriesIndex: 0,dataIndex: len,})len ++
}, 1000)},
}
三.单项介绍
1.以上图为例,简单介绍几个修改echarts的方法
主要是通过修改option来调整echarts图
1.修改标题:
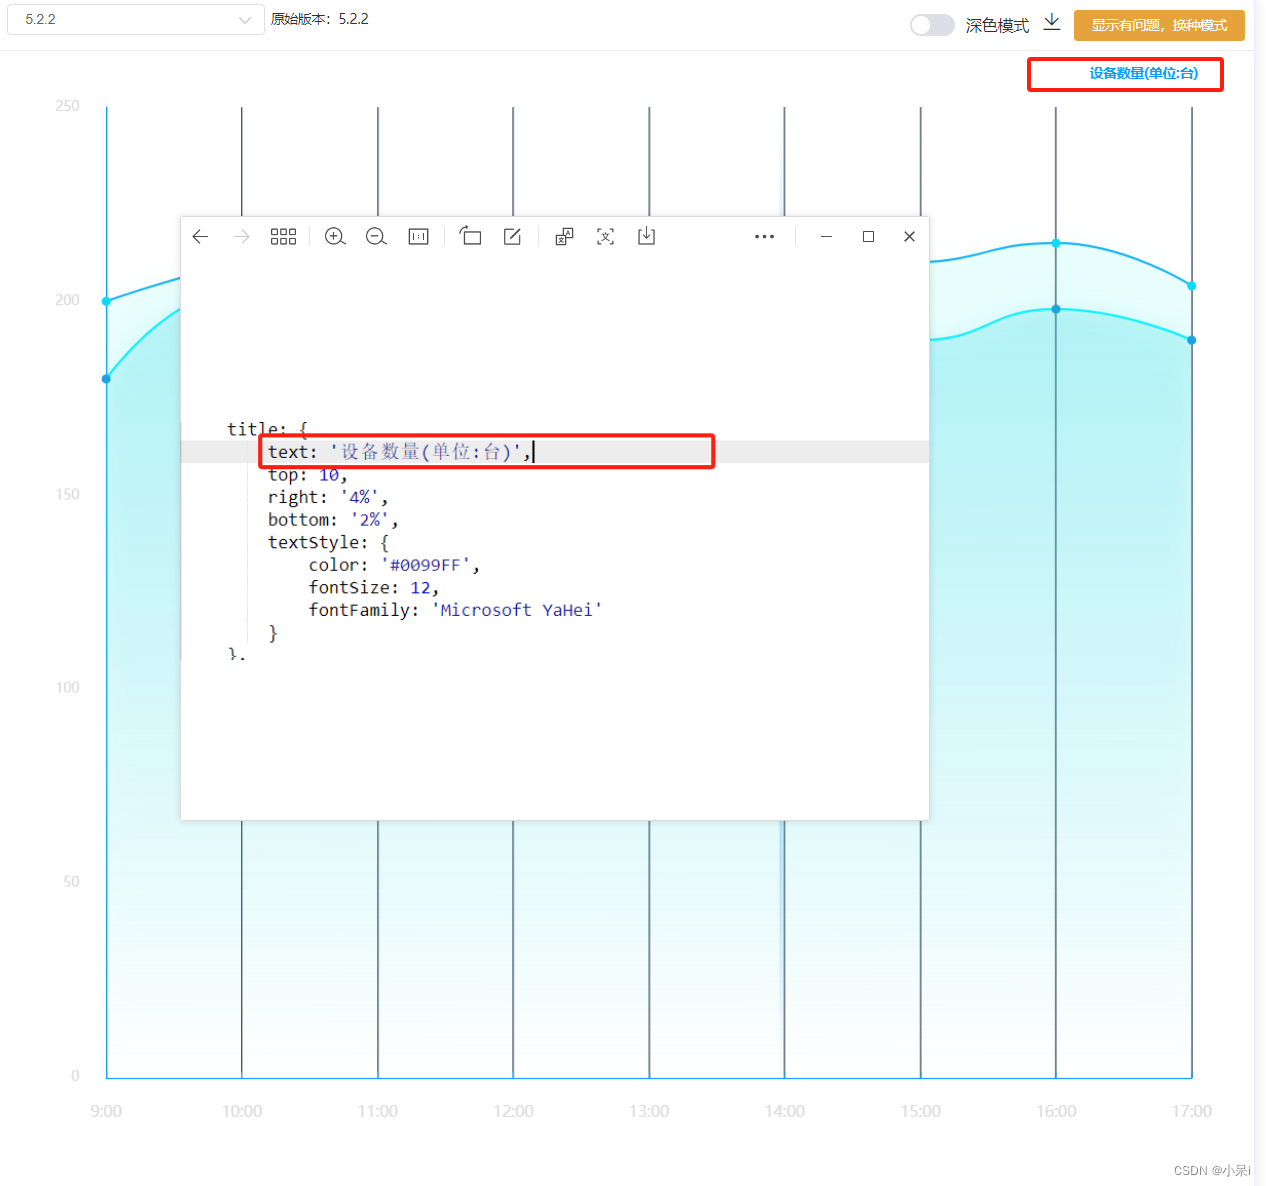
title: {text: '设备数量(单位:台)',//修改文字内容top: 10,//文字位置right: '4%',bottom: '2%',textStyle: {//文字样式color: '#0099FF',//文字颜色fontSize: 12,//文字大小fontFamily: 'Microsoft YaHei'//文字字体}},2.grid网格
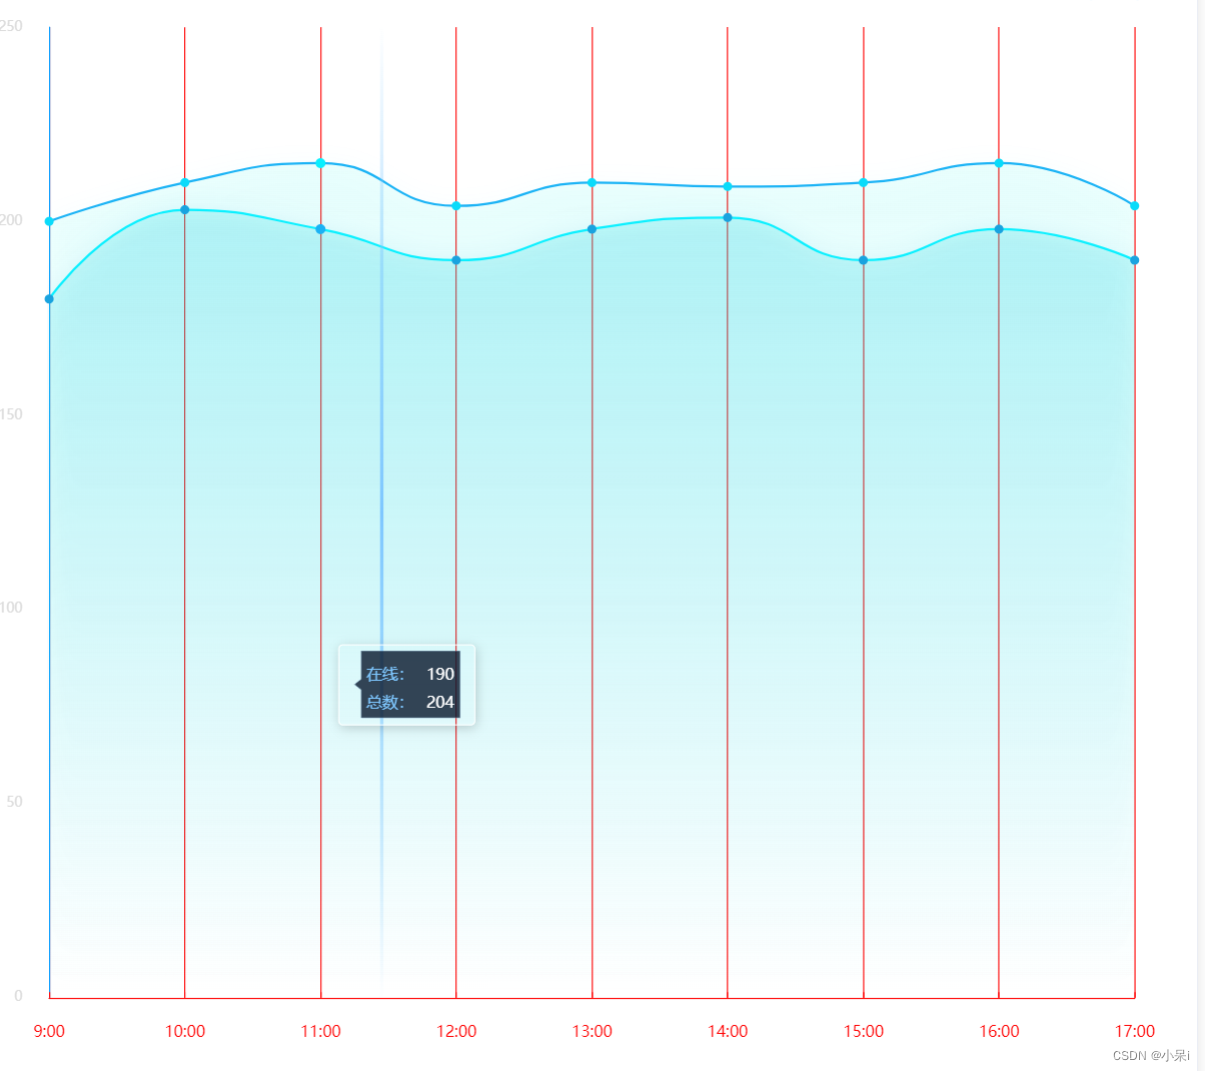
grid: {//这个是调整echarts图片整体的位置top: 50,//距离上面多少left: '6%',//左边right: '5%',//右边bottom: '8%',//下面containLabel: true,//我不知道这个},3.tooltip提示信息

tooltip: {//提示信息,当鼠标放在图表上展示的内容,红框选中部分trigger: 'axis',backgroundColor:'red',axisPointer: {lineStyle: {//线的样式,绿框选中部分type: 'solid',width: 3,color: {type: 'linear',x: 0,y: 0,x2: 0,y2: 1,colorStops: [{offset: 0,color: 'rgba(126,199,255,0)' // 0% 处的颜色}, {offset: 0.5,color: 'rgba(126,199,255,1)' // 100% 处的颜色}, {offset: 1,color: 'rgba(126,199,255,0)' // 100% 处的颜色}],global: false // 缺省为 false}},},formatter: (p) => {//这个可以用来自定义let dom = `<div style="width: 100px;height: 50px;;color:#fff;position: relative;"><svg style="position: absolute;top: 50%;left: 50%;transform: translateX(-50%) translateY(-50%);" class="svg" xmlns="http://www.w3.org/2000/svg" width="100" height="71" viewBox="0 0 84 55"><defs><style>.cls-1 {fill: #07172c;fill-opacity: 0.8;stroke: #a7d8ff;stroke-linejoin: round;stroke-opacity: 0.2;stroke-width: 1px;fill-rule: evenodd;}</style></defs><path id="矩形_419" data-name="矩形 419" class="cls-1" d="M266,595h74v50H266V624.046L261,620l5-3.984V595Z"transform="translate(-258.5 -592.5)" /></svg><div style="padding: 4px 8px 4px 14px;display: flex;justify-content: center;align-items: center;flex-direction: column;position: relative;z-index: 1;"><div style="margin-bottom: 4px;width:100%;display:${p[0]?'flex':'none'};justify-content:space-between;align-items:center;"><span style="font-size:14px;color:#7ec7ff;">${p[0]?p[0].seriesName:''}</span><span style="font-size:14px;color:#fff;">${p[0]?p[0].data:''}</span></div><div style="width:100%;height:100%;display:${p[1]?'flex':'none'};justify-content:space-between;align-items:center;"><span style="font-size:14px;color:#7ec7ff;">${p[1]?p[1].seriesName:''}</span><span style="font-size:14px;color:#fff;">${p[1]?p[1].data:''}</span></div></div></div>`return dom}},4.x轴设置: xAxis
xAxis: [{type: 'category',boundaryGap: false,axisLine: { //坐标轴轴线相关设置。数学上的x轴lineStyle: {color: 'red',//x轴线的颜色},},axisLabel: { //坐标轴刻度标签的相关设置textStyle: {//x轴文字的样式设置show: true,color: 'red',//x轴文字的颜色padding: 16,fontSize: 14},formatter: function(data) {return data}},splitLine: {show: true,lineStyle: {color: 'red',//竖线颜色},},axisTick: {show: true,inside: true},data: xLabel,//x轴数据}],5.y轴设置:yAxis
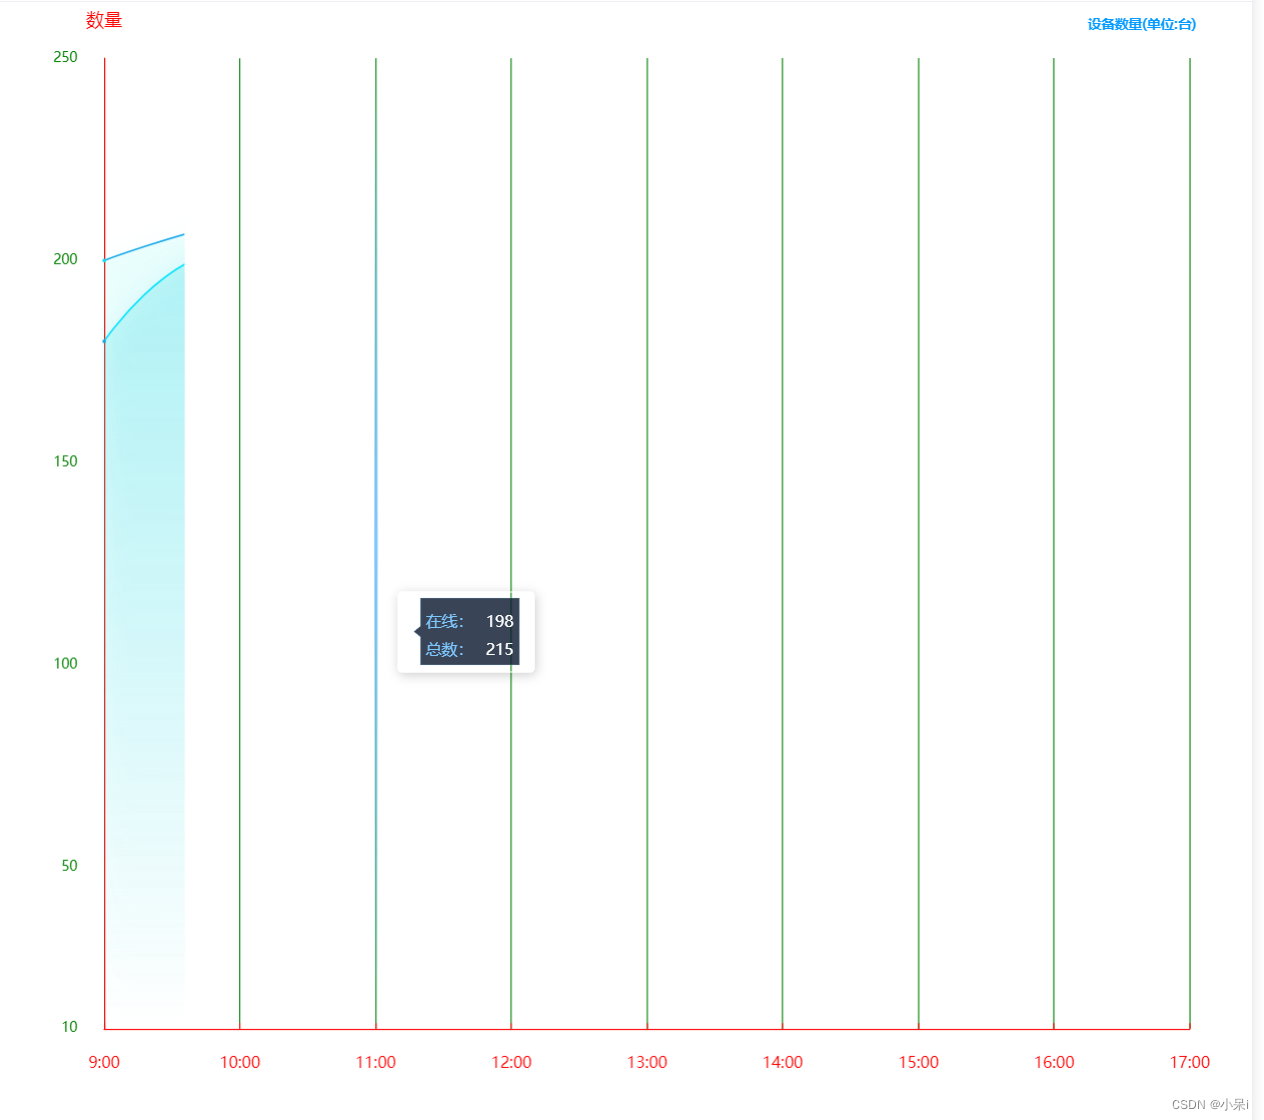
yAxis: [{name: '数量',//y轴名字nameTextStyle: {//y轴文字样式设置color: "#7ec7ff",fontSize: 16,padding: 10},min: 10,//y轴的最小值splitLine: {show: false,lineStyle: {color: '#2AF4F7'},},axisLine: {//y轴线的颜色show: true,lineStyle: {color: "#0099FF"},},axisLabel: {show: true,textStyle: {color: 'green',//y轴文字的颜色padding: 16},formatter: function(value) {//这里可以自定义,对y轴数据进行处理if (value === 0) {return value}return value}},axisTick: {show: false,},}],6.series 主要是调整他,折线图 饼图 等等,上面设置了横纵坐标,接下来设置内容...

series: [{//一个{}表示第一条数据name: '在线1111:',type: 'line',symbol: 'circle', showAllSymbol: true,symbolSize: 8,smooth: true,lineStyle: {normal: {width: 1,color: "red", // 线条颜色},//borderColor: 'rgba(0,0,0,.4)',},itemStyle: {color: "yellow",borderColor: "#646ace",borderWidth: 0},tooltip: {show: true},areaStyle: { //区域填充样式normal: {//线性渐变,前4个参数分别是x0,y0,x2,y2(范围0~1);相当于图形包围盒中的百分比。如果最后一个参数是‘true’,则该四个值是绝对像素位置。color: new echarts.graphic.LinearGradient(0, 0, 0, 1, [{offset: 0,color: "rgba(50,228,228,0.3)"},{offset: 1,color: "rgba(50,228,228,0)"}], false),shadowColor: 'rgba(25,163,223,0.5)', //阴影颜色shadowBlur: 20 //shadowBlur设图形阴影的模糊大小。配合shadowColor,shadowOffsetX/Y, 设置图形的阴影效果。}},data: online}, {name: '总数2222:',type: 'line',symbol: 'circle', showAllSymbol: true,symbolSize: 8,smooth: true,lineStyle: {normal: {width: 1,color: "#19a3df", // 线条颜色},borderColor: 'rgba(0,0,0,.4)',},itemStyle: {color: "rgba(10,219,250,1)",borderColor: "#646ace",borderWidth: 0},tooltip: {show: true},areaStyle: { //区域填充样式normal: {stack: true,//线性渐变,前4个参数分别是x0,y0,x2,y2(范围0~1);相当于图形包围盒中的百分比。如果最后一个参数是‘true’,则该四个值是绝对像素位置。color: new echarts.graphic.LinearGradient(0, 0, 0, 1, [{offset: 0,color: "rgba(10,810,224,0.1)"},{offset: 1,color: "rgba(10,810,224,0)"}], false),shadowColor: 'rgba(10,219,250, 0.5)', //阴影颜色shadowBlur: 20 //shadowBlur设图形阴影的模糊大小。配合shadowColor,shadowOffsetX/Y, 设置图形的阴影效果。}},data: sum}]7.还有饼图的两个属性 radius和 center
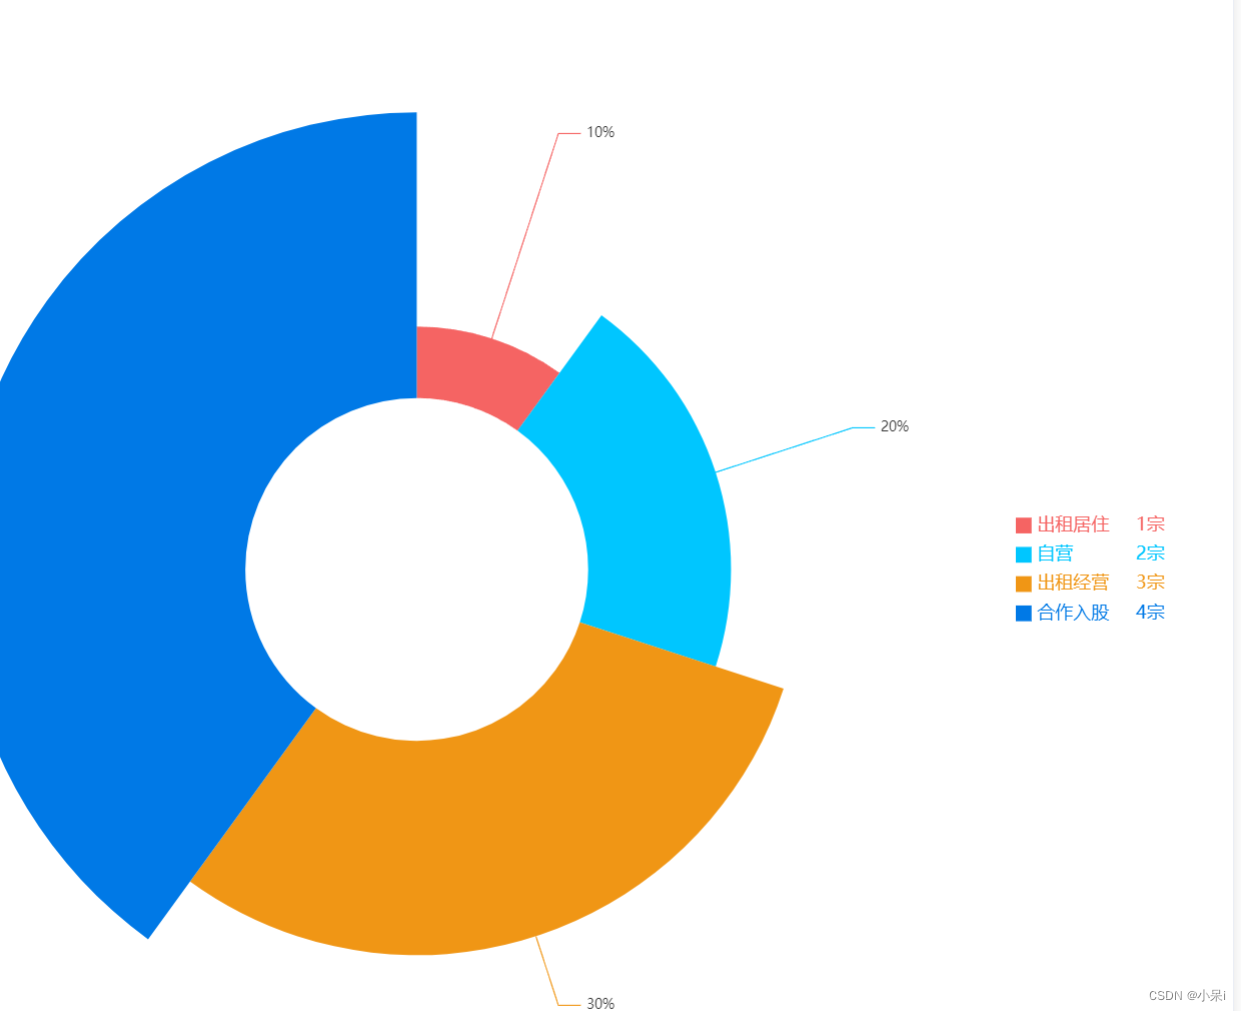
let datas = [{name: "出租居住",value: 1,},{name: "自营",value: 2,},{name: "出租经营",value: 3,},{name: "合作入股",value: 4,},];var option = {color: ["#F56463", "#00C6FF", "#F09615", "#0079E6"],legend: {itemHeight: 14,itemWidth: 14,icon: "rect",orient: "vertical",top: "center",right: "5%",textStyle: {align: "left",color: "#",verticalAlign: "middle",rich: {name: {width:80, fontSize: 16,},value: { width:20, align:"right",fontFamily: "Medium",fontSize: 16,},rate: {width:10,align:"right",fontSize: 16,},},},data: datas,formatter: (name) => {if (datas.length) {const item = datas.filter((item) => item.name === name)[0];return `{name|${name}}{value| ${item.value}} {rate| 宗}`;}},},tooltip: {trigger: "item",formatter: "{d}%",},series: [{name: "",type: "pie",radius: ["30%", "80%"],center: ["35%", "50%"],roseType: "radius",label: {formatter: "{d}%",},labelLine: {length: 1,length2: 20,},data: datas,},],};radius:["里面的圆的大小","外圆大小"];
center: ["echarts距离左边的距离", "echarts距离上边的距离"],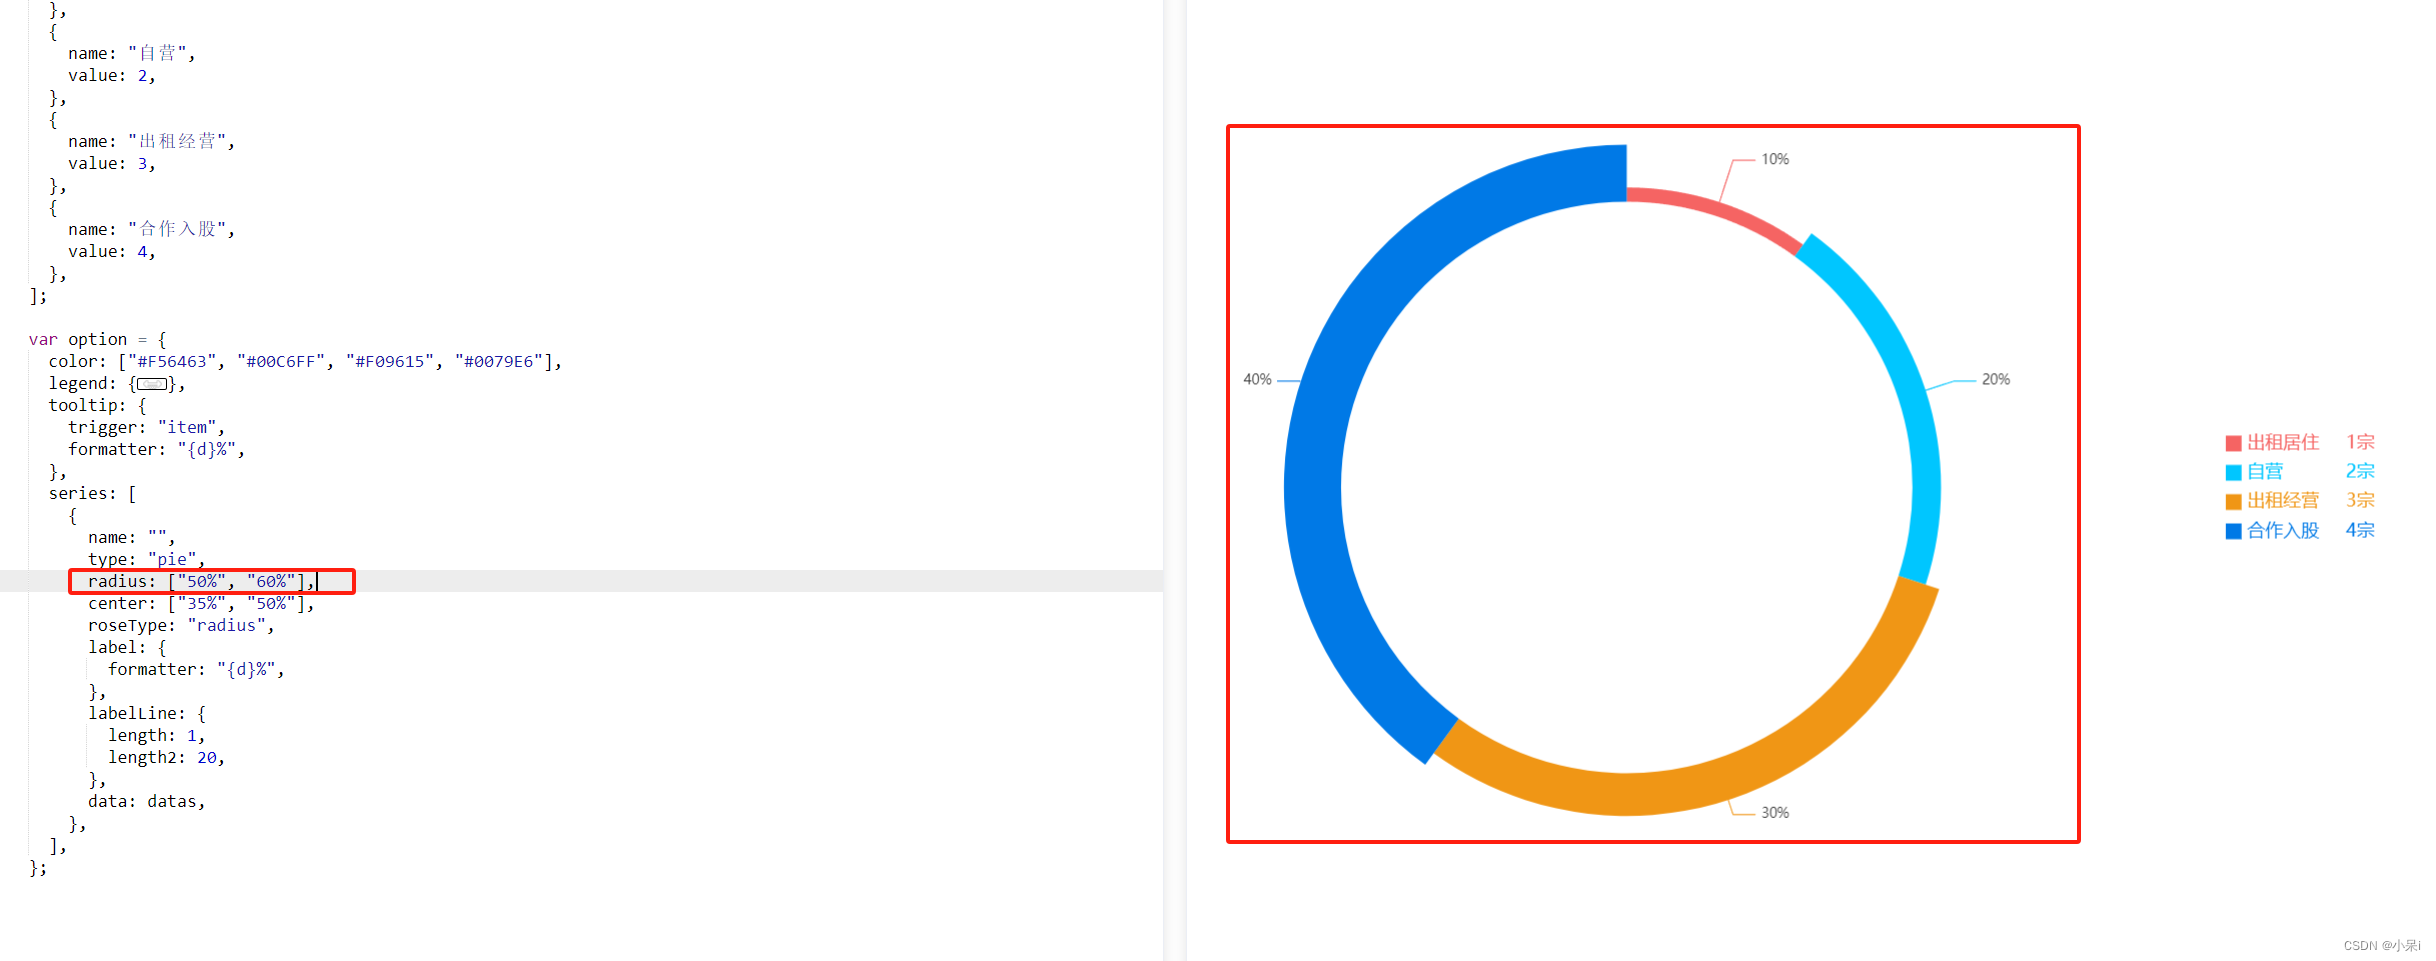
相关文章:
echarts一些配置项的使用
前言:我是自己最近写项目用到的,我做个整理; 一. 基本使用 1.具有大小(宽高)的div ,id唯一; 例如: <div id"crewEchart"></div> 2.在项目中引入: import * as echarts from "echarts"; 3.写一个关于他的方法,在mounted的时候调用: moun…...
(安全解析函数,解析yaml)(防止yaml文件中包含恶意代码))
python yaml库:safe_load()(安全解析函数,解析yaml)(防止yaml文件中包含恶意代码)
文章目录 Python YAML: 使用 safe_load 进行安全解析什么是 safe_load?如何使用 safe_load?为什么选择 safe_load 而非 load? Python YAML: 使用 safe_load 进行安全解析 YAML (YAML Ain’t Markup Language) 是一种人类可读的数据序列化标准。它被广泛用于配置文件、多语言…...
小程序:下拉刷新+上拉加载+自定义导航栏
下拉刷新 : <scroll-view scroll-y"true" 允许纵向滚动 refresher-enabled"true" 开启自定义下拉刷新 默认为false :refresher-triggered&quo…...
判断两个二叉树是否相等
bool isSameTree(struct TreeNode* p, struct TreeNode* q) {//两个都为空if(pNULL&&qNULL){return true;}//有一个为空if(pNULL||qNULL){return false;}//两个不为空,但值不相同if(p->val!q->val){return false;}//值相同return isSameTree(p->le…...
springcloud----检索中间件 ElasticSearch 分布式场景的运用
如果对es的基础知识有不了解的可以看 es看这个文章就会使用了 1.分布式集群场景下的使用 单机的elasticsearch做数据存储,必然面临两个问题:海量数据存储问题、单点故障问题。 海量数据存储问题:将索引库从逻辑上拆分为N个分片(…...

qt创建线程类并实现通信 C++
需求描述: 通过VS创建了一个QT项目,我需要一个线程类去实时获取设备取流的图像,并将图像传给qt的类用于在QLabel上显示。 实现: 头文件: //include ...省略//Qt界面的类Your_Project class Your_Project : public Q…...

【elasticsearch】使用自建证书搭建elasticsearch8.0.1集群
概述 本文将分享使用自建证书搭建加密的es集群,如果想使用rpm包安装,前期的搭建过程请参考上面一篇文章https://blog.csdn.net/margu_168/article/details/133344675。后续的操作与使用tar包安装的类似,只是需要注意目录的区别。 es8.0.1安…...
一篇文章带你用动态规划解决打家劫舍问题
动态规划的解题步骤可以分为以下五步,大家先好好记住 1.创建dp数组以及明确dp数组下标的含义 2.制定递推公式 3.初始化 4.遍历顺序 5.验证结果 根据打家劫舍的题意:两个直接相连的房子在同一天晚上被打劫会触发警报 所以我们制定出核心策略——偷东…...
idea中导入eclipse的javaweb项目——tomact服务(保姆级别)
idea中导入eclipse的javaweb项目——tomact服务(保姆级别) 1. 导入项目2. Project Settings下的各种配置步骤2.1 检查/修改 jdk 的引入2.2 配置Modules-Dependencies2.2.1 删掉eclipse相关的多余配置2.2.2 删掉jar包2.2.3 添加tomcat的依赖 2.3 配置Libr…...

【开源】给ChatGLM写个,Java对接的SDK
作者:小傅哥 - 百度搜 小傅哥bugstack 博客:bugstack.cn 沉淀、分享、成长,让自己和他人都能有所收获!😄 大家好,我是技术UP主小傅哥。 清华大学计算机系的超大规模训练模型 ChatGLM-130B 使用效果非常牛&…...
基于Pytest+Allure+Excel的接口自动化测试框架
1. Allure 简介 简介 Allure 框架是一个灵活的、轻量级的、支持多语言的测试报告工具,它不仅以 Web 的方式展示了简介的测试结果,而且允许参与开发过程的每个人可以从日常执行的测试中,最大限度地提取有用信息。 Allure 是由 Java 语言开发的…...
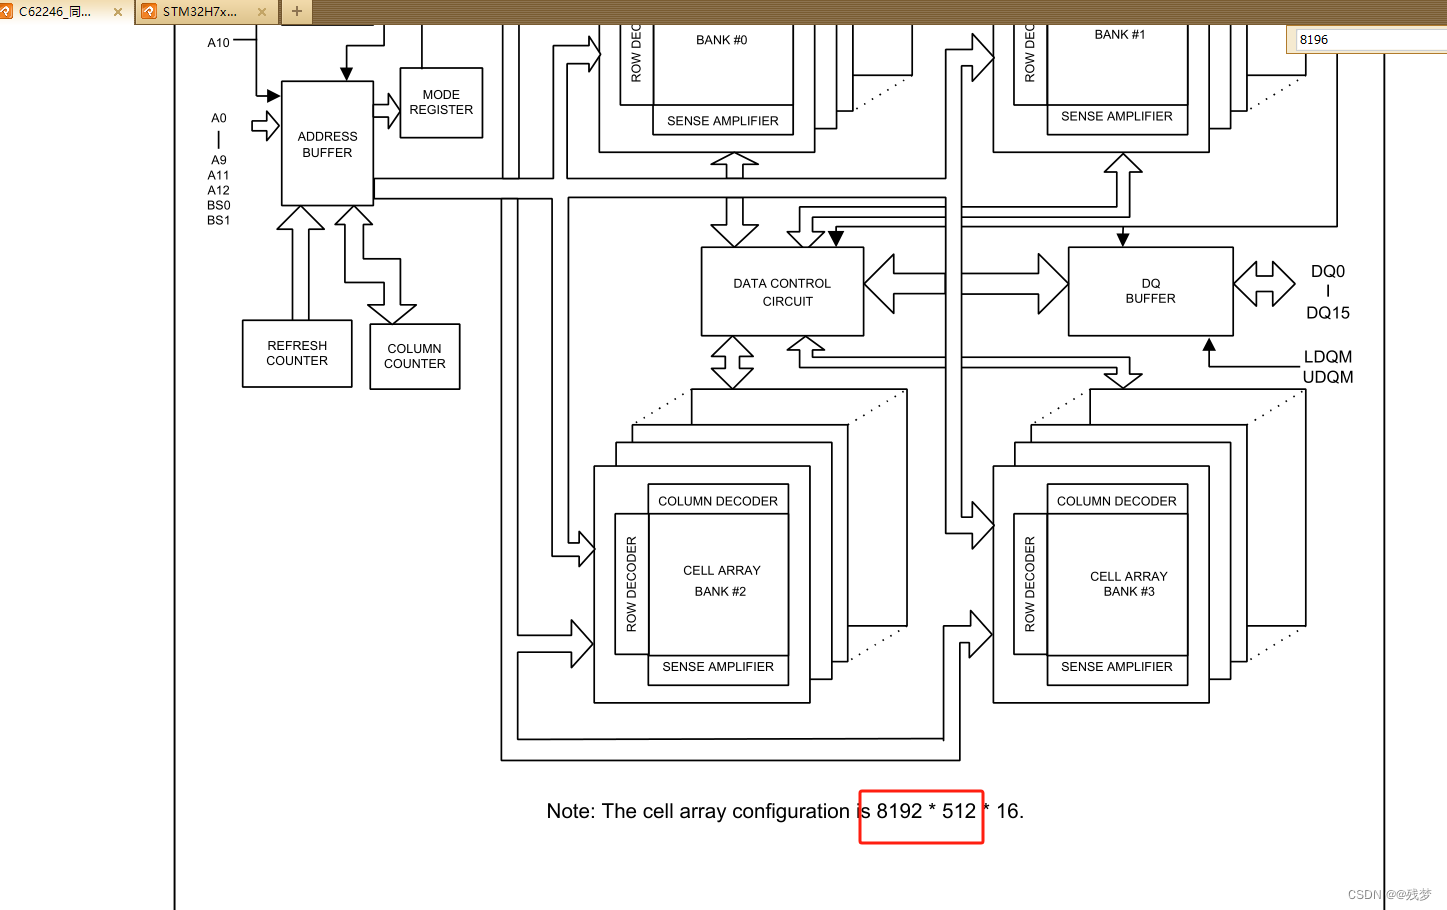
20.2 FMC驱动SDRAM的时序初始化实现及内存测试
继续上一篇的话题,写到SDRAM通过CubeMx配置后,在工程代码编写时直接引用的是我事先写好的时序初始化、内存测试文件,而未对其进行详细的解释,所以本篇文章就来娓娓道来。不多说,开始吧 SDRAM的初始化流程简述 SDRAM初…...
联想电脑一键重装系统Win10操作方法
很多用户都会利用重装系统的方法,来解决系统崩溃、病毒感染等问题。但是,很多新手用户不知道联想电脑Win10系统重装的详细方法步骤,下面小编给大家详细介绍关于联想电脑Win10系统重装的操作方法,帮助大家轻松快速地完成系统的重装…...
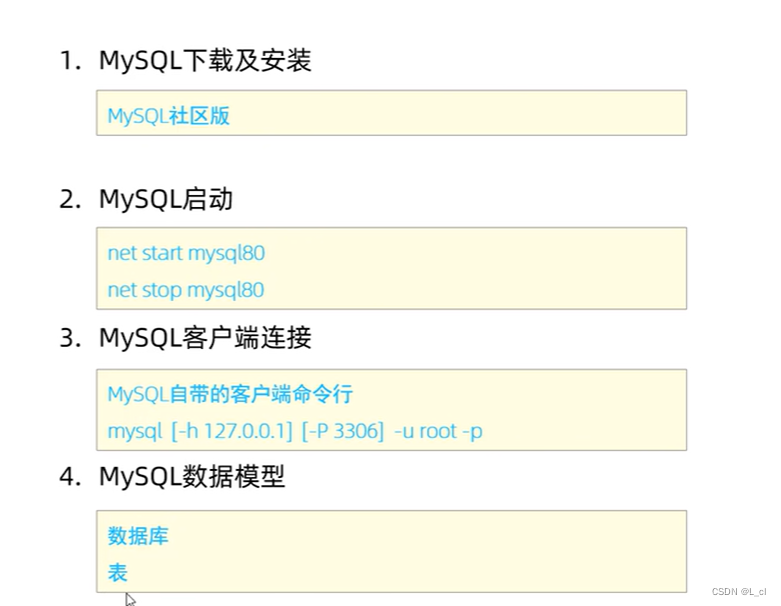
Mysql数据库 1.概述
Mysql内容概述 1. Mysql概述 数据库相关概念: 名称 全称 简称 数据库 存储数据的仓库,数据是有组织的进行存储 …...

Qt编程,文件操作、UDP通信
目录 1、文件类 QFile 2、 UPD/TCP网络编程 1、##UDP客户端 2、##UDP服务器端 1、文件类 QFile QFile file(filename); file.exists() file.setFileName(filename1); file.fileName() file.bytesAvailable() file.size() file.copy("2.txt") file1.errorString(…...
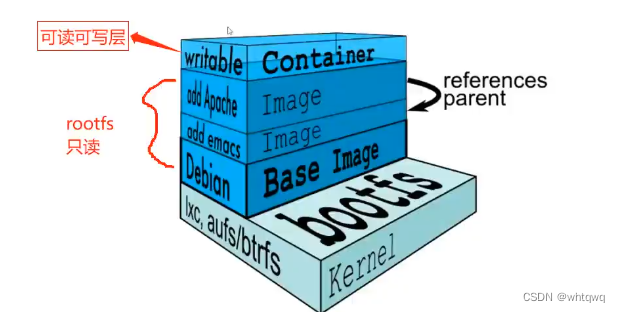
Docker 的数据管理和Dockerfile镜像的创建
目录 Docker 的数据管理 管理 Docker 容器中数据的方式 端口映射 容器互联(使用centos镜像) Docker 镜像的创建 Dockerfile 操作常用的指令 编写 Dockerfile 时格式 Dockerfile 案例 Docker 的数据管理 管理 Docker 容器中数据的方式 管理 Doc…...

[python] 利用 Pydoc 快速生成整个 Python 项目的文档
如何写注释 class MyClass:"""This is a simple example class.Attributes:param1 (int): The first parameter.param2 (str): The second parameter."""def __init__(self, param1, param2):"""The constructor for MyClass.:p…...

Maven 配置指南
目录 一、配置本地存储库 二、配置并行Artifact 解析 三、安全和部署设置 四、将镜像用于存储库 五、Profiles 六、可选配置 七、Settings 八、安全性 九、工具链 Maven配置发生在3个级别: 项目-大多数静态配置发生在pom.xml中安装-这是为Maven安装添加的…...

第十八章 类和对象——多态
一、多态的基本概念 多态是C面向对象三大特性之一 多态分为两类 静态多态: 函数重载 和 运算符重载属于静态多态,复用函数名 动态多态: 派生类和虚函数实现运行时多态 静态多态和动态多态区别: 静态多态的函数地址早绑定 - 编译阶段确定函数地址 动…...
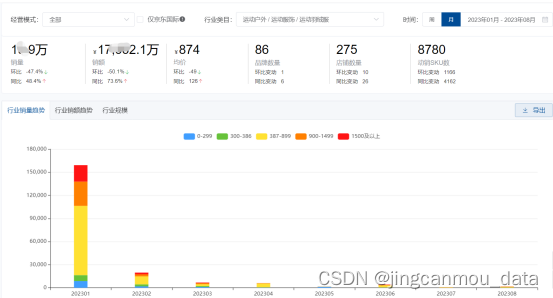
京东数据平台:2023年服饰行业销售数据分析
最近看到有些消费机构分析,不少知名的运动品牌都把“主战场”放到了冲锋衣,那么羽绒服市场就比较危险了。但其实羽绒服市场也有机会点可寻。 先来说冲锋衣。的确,从今年的销售数据以及增长情况,冲锋衣的确会是今年冬天的大热门品…...

5分钟免费制作专业AI翻唱:AICoverGen完整指南
5分钟免费制作专业AI翻唱:AICoverGen完整指南 【免费下载链接】AICoverGen A WebUI to create song covers with any RVC v2 trained AI voice from YouTube videos or audio files. 项目地址: https://gitcode.com/gh_mirrors/ai/AICoverGen 想让AI帮你翻唱…...

高考解析几何“秒杀”技巧:用极点极线快速搞定椭圆定点定值难题
高考解析几何“秒杀”技巧:用极点极线快速搞定椭圆定点定值难题 解析几何作为高考数学的压轴题型,常常让考生望而生畏。面对复杂的计算和抽象的条件,如何在有限时间内快速找到突破口?极点极线理论作为高等几何中的重要工具&#x…...

Java 大厂面试 200 题完整版含答案解析
前言本文整理了近两年从阿里、腾讯、字节、美团、京东、拼多多等大厂面试中高频出现的 200 道 Java 面试题,覆盖 Java 基础、集合、并发、JVM、Spring、MySQL、Redis、消息队列、分布式、场景设计 等核心模块,每题都附有简明扼要的答案解析,助…...

怎么判断一家工厂还在不在正常生产?6 类活跃度信号,从纸面到现场
跑工厂的销售员都遇到过这种事:手机里存着一份名单,导航开两小时,到门口才发现卷帘门焊死、车间长草、保安说"厂子去年就搬了"。 问题出在哪?大多数人判断"这家工厂在不在",靠的是工商登记——执照…...
如何构建鲁棒的点云局部描述符)
从理论到实践:三维形状上下文(3DSC)如何构建鲁棒的点云局部描述符
1. 为什么我们需要三维形状上下文(3DSC) 想象一下你正在玩一个拼图游戏,但所有碎片都被随机撒上了胡椒粉,有些碎片还被书本盖住了一角。这就是计算机处理含噪声、遮挡的点云数据时的真实处境。在机器人导航、自动驾驶或者工业质检中,我们经常…...

DIY智能电机推子:从闭环控制到MIDI交互的硬件实战
1. 项目概述与核心价值如果你玩过专业的音频混音台,或者在一些高端的灯光控制台上见过那种会自己“嗖”一下滑到指定位置的推子,那你一定对电机推子(Motorized Fader)不陌生。这东西的魅力在于,它既是精准的模拟输入设…...

5分钟终极指南:在Blender中完美导入Rhino 3dm文件的完整教程
5分钟终极指南:在Blender中完美导入Rhino 3dm文件的完整教程 【免费下载链接】import_3dm Blender importer script for Rhinoceros 3D files 项目地址: https://gitcode.com/gh_mirrors/im/import_3dm 你是否正在寻找一种简单、快速且免费的方法,…...

基于Rust的网页正文提取工具web-reader:从原理到自动化实践
1. 项目概述:一个为现代阅读场景而生的开源利器最近在折腾个人知识库和稍后读工具链,发现市面上的网页内容抓取工具要么太重,要么太“脏”——抓下来的内容常常带着一堆广告、导航栏,甚至还有烦人的弹窗代码。直到我遇到了Cat-tj/…...
:含17个已验证失效词黑名单与8组高通过率--sref权重组合)
Midjourney极简艺术风格实战手册(2024V6.2最新适配版):含17个已验证失效词黑名单与8组高通过率--sref权重组合
更多请点击: https://intelliparadigm.com 第一章:Midjourney极简艺术风格的核心定义与美学边界 极简艺术风格在 Midjourney 中并非单纯减少元素,而是通过语义压缩、形式提纯与负空间策略构建高度凝练的视觉语言。其核心在于以最少的视觉单元…...

Chrome QRCode插件终极指南:如何在3分钟内实现跨设备无缝内容同步
Chrome QRCode插件终极指南:如何在3分钟内实现跨设备无缝内容同步 【免费下载链接】chrome-qrcode :zap: A Chrome plugin to Genrate QRCode of URL / Text, or Decode the QRcode in website. 一个Chrome浏览器插件,用于生成当前URL或者选中内容的二维…...