Grafana dashboards as ConfigMaps
文章目录
- 1. 简介
- 2. 创建 configmaps
- 3. grafana 界面查看
1. 简介
将 Grafana 仪表板存储为 Kubernetes ConfigMap 相比传统的通过 Grafana 界面导入仪表板有以下一些主要优点:
- 版本控制: ConfigMap 可以存储在版本控制系统(如Git)中,便于跟踪和管理仪表板的变更历史。而传统方式下,仪表板的改动很难追踪和恢复。
- 可移植性:ConfigMap 是 Kubernetes 原生对象,可以在不同的集群和环境之间轻松迁移和共享。传统方式下,仪表板需要通过导出导入的方式在不同环境之间传递。
- 集中管理: 所有仪表板都可以作为 ConfigMap 集中存储和管理,避免分散在多个位置。传统方式下,仪表板管理较为分散。
- 动态更新:Kubernetes 支持在不重启 Grafana 的情况下更新 ConfigMap,从而无缓冲更新仪表板。传统方式需要重启 Grafana 使更改生效。
- 一致性部署: 通过 ConfigMap 的方式,可以确保 Grafana 实例在部署时使用完全一致的仪表板配置。
- 安全性 :ConfigMap 可以利用 Kubernetes 的角色访问控制机制来管理访问权限。
- 自动化: ConfigMap 可以与 GitOps 工作流相结合,实现仪表板配置的自动化部署和更新。
总的来说,使用 ConfigMap 管理 Grafana 仪表板能够提高可维护性、一致性和自动化程度,同时增强安全性和可迁移性,非常适合云原生环境下的使用。
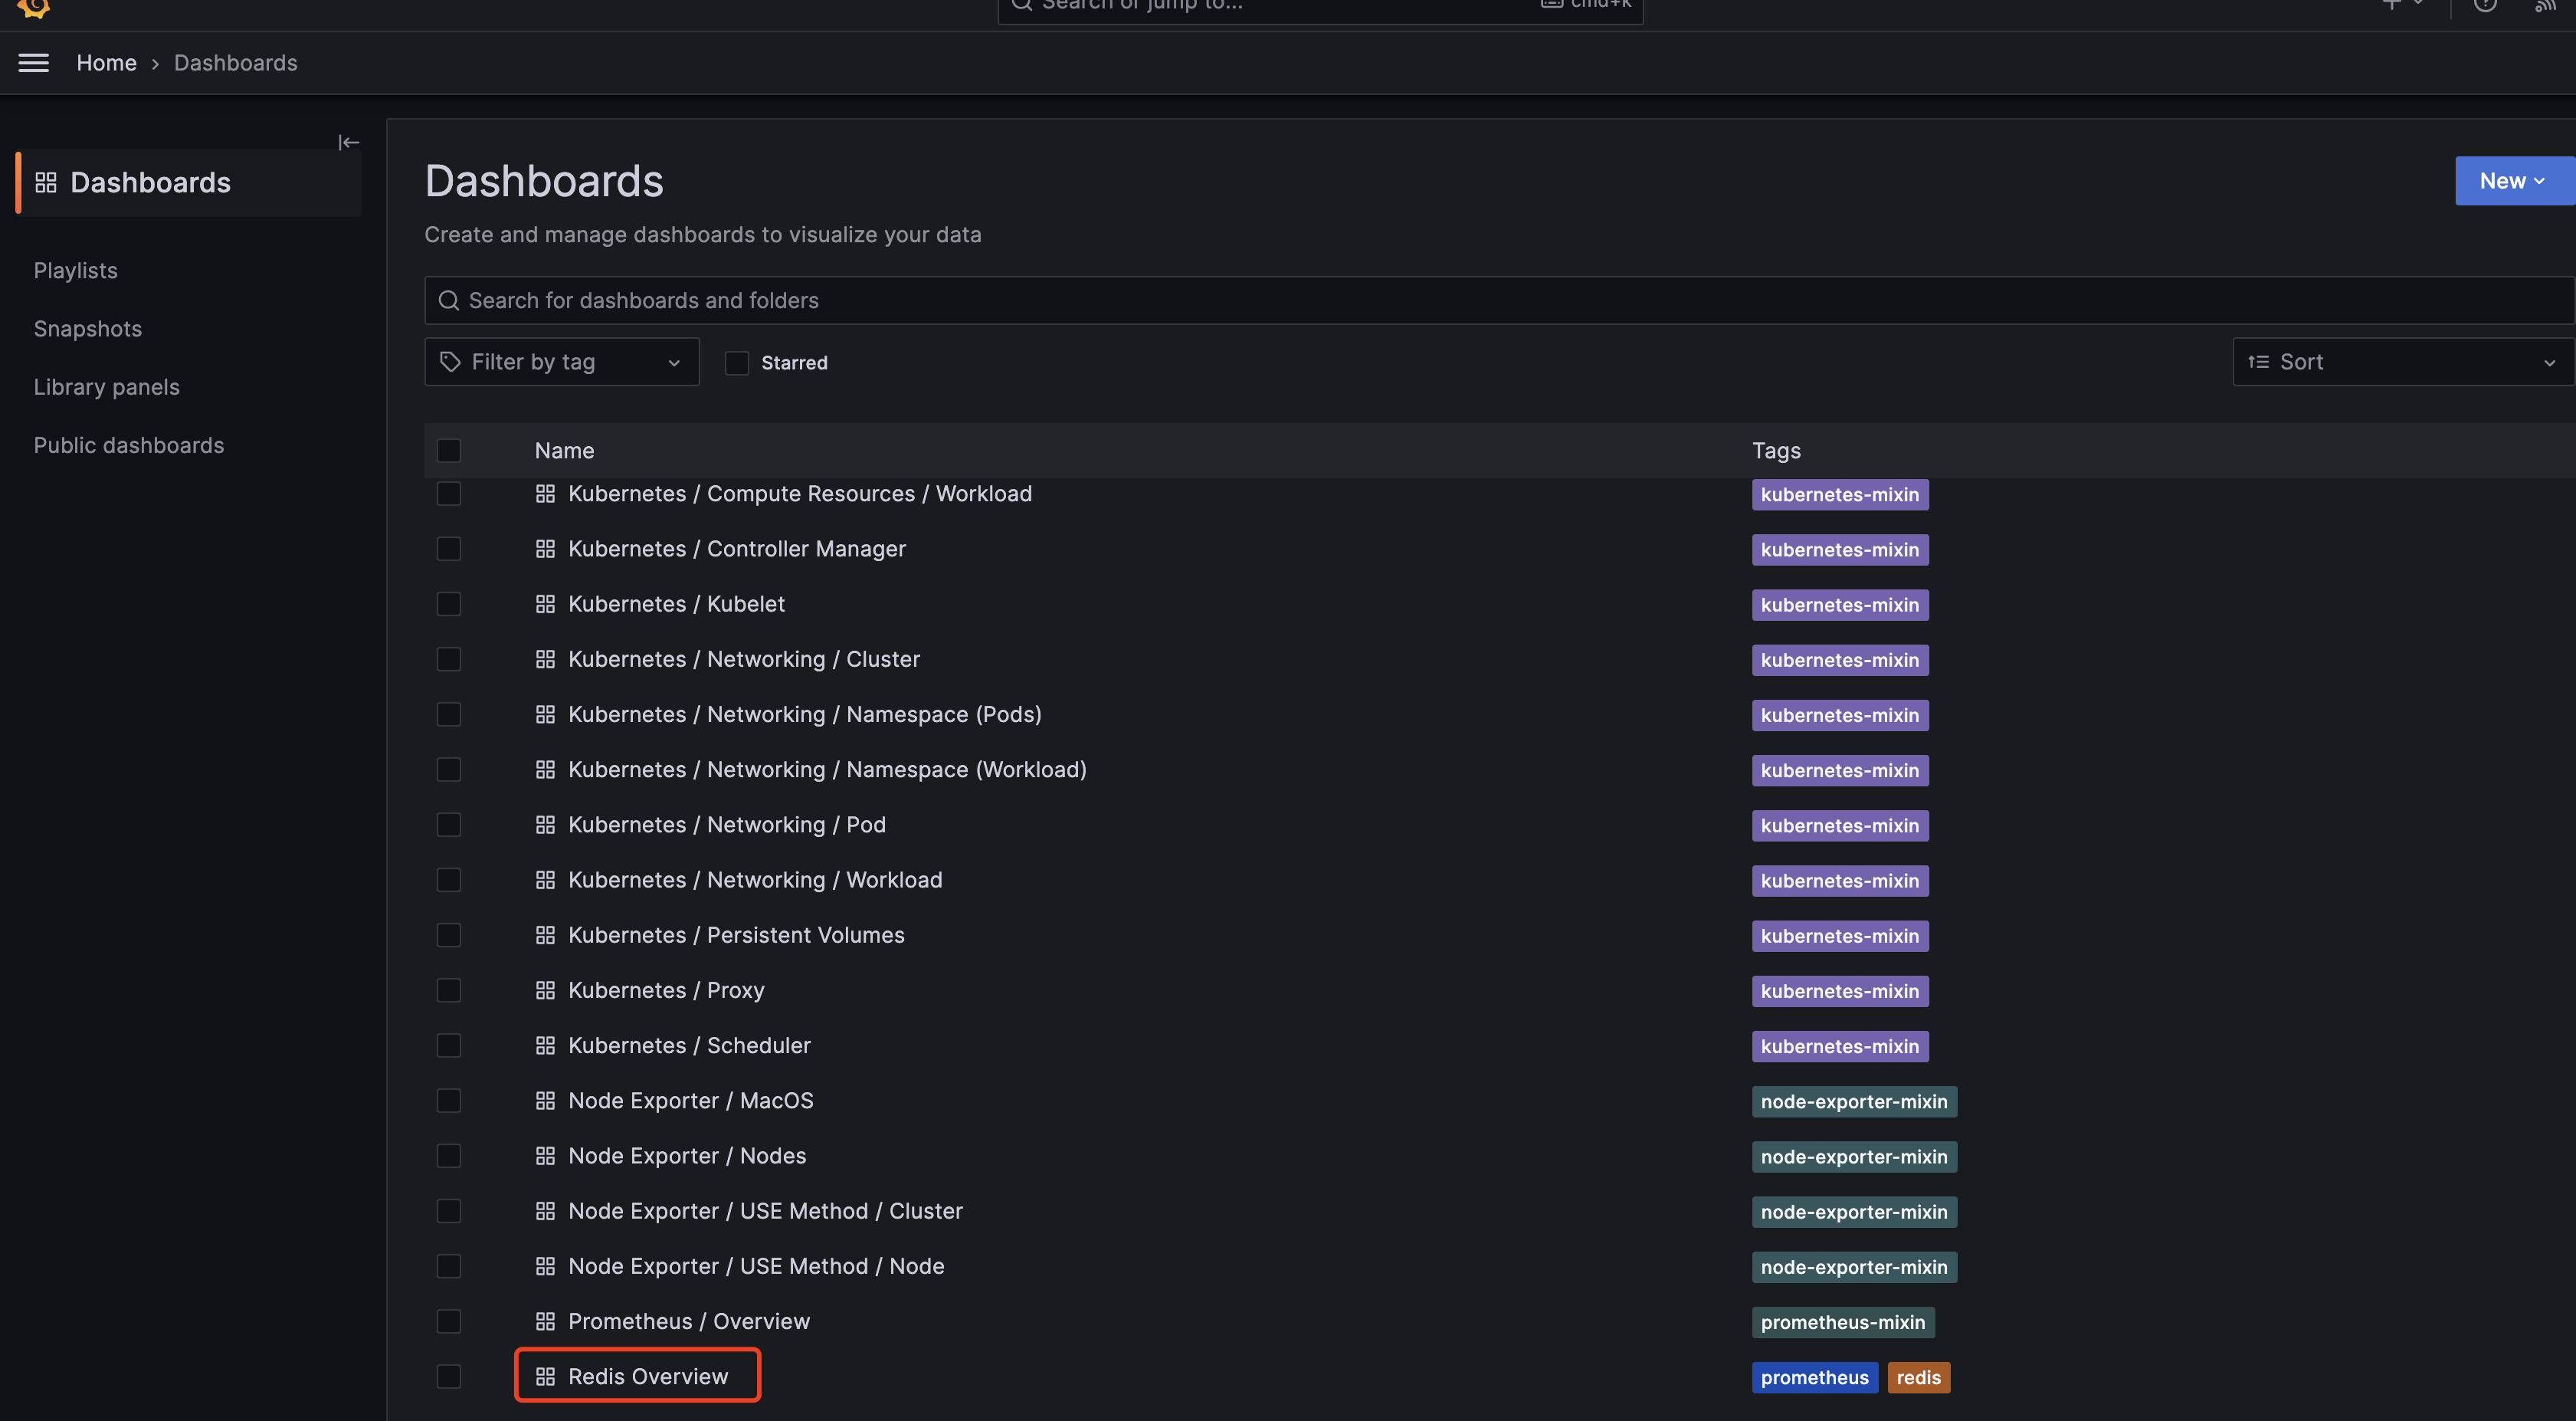
获取监控仪表盘的json文件,例如,展示 Gafana Redis Overview dashboard 的 redis.json,以prometheus作为数据源。
{"annotations": {"list": [{"builtIn": 1,"datasource": "-- Grafana --","enable": true,"hide": true,"iconColor": "rgba(0, 211, 255, 1)","name": "Annotations & Alerts","type": "dashboard"}]},"description": "Redis Overview","editable": true,"gnetId": 763,"graphTooltip": 1,"id": 28,"iteration": 1620627698368,"links": [],"panels": [{"cacheTimeout": null,"colorBackground": false,"colorValue": false,"colors": ["rgba(245, 54, 54, 0.9)","rgba(237, 129, 40, 0.89)","rgba(50, 172, 45, 0.97)"],"datasource": "Prometheus","decimals": 0,"editable": true,"error": false,"fieldConfig": {"defaults": {"custom": {}},"overrides": []},"format": "s","gauge": {"maxValue": 100,"minValue": 0,"show": false,"thresholdLabels": false,"thresholdMarkers": true},"gridPos": {"h": 7,"w": 3,"x": 0,"y": 0},"id": 9,"interval": null,"isNew": true,"links": [],"mappingType": 1,"mappingTypes": [{"name": "value to text","value": 1},{"name": "range to text","value": 2}],"maxDataPoints": 100,"nullPointMode": "connected","nullText": null,"postfix": "","postfixFontSize": "50%","prefix": "","prefixFontSize": "50%","rangeMaps": [{"from": "null","text": "N/A","to": "null"}],"sparkline": {"fillColor": "rgba(31, 118, 189, 0.18)","full": false,"lineColor": "rgb(31, 120, 193)","show": true},"tableColumn": "","targets": [{"expr": "max(max_over_time(redis_uptime_in_seconds{service=~\"$service\",pod=~\"$pod\"}[$__interval]))","format": "time_series","interval": "","intervalFactor": 2,"legendFormat": "","metric": "","refId": "A","step": 1800}],"thresholds": "","title": "Max Uptime","type": "singlestat","valueFontSize": "70%","valueMaps": [{"op": "=","text": "N/A","value": "null"}],"valueName": "current"},{"cacheTimeout": null,"colorBackground": false,"colorValue": false,"colors": ["rgba(245, 54, 54, 0.9)","rgba(237, 129, 40, 0.89)","rgba(50, 172, 45, 0.97)"],"datasource": "Prometheus","decimals": 0,"editable": true,"error": false,"fieldConfig": {"defaults": {"custom": {}},"overrides": []},"format": "none","gauge": {"maxValue": 100,"minValue": 0,"show": false,"thresholdLabels": false,"thresholdMarkers": true},"gridPos": {"h": 7,"w": 2,"x": 3,"y": 0},"hideTimeOverride": true,"id": 12,"interval": null,"isNew": true,"links": [],"mappingType": 1,"mappingTypes": [{"name": "value to text","value": 1},{"name": "range to text","value": 2}],"maxDataPoints": 100,"nullPointMode": "connected","nullText": null,"postfix": "","postfixFontSize": "50%","prefix": "","prefixFontSize": "50%","rangeMaps": [{"from": "null","text": "N/A","to": "null"}],"sparkline": {"fillColor": "rgba(31, 118, 189, 0.18)","full": false,"lineColor": "rgb(31, 120, 193)","show": true},"tableColumn": "","targets": [{"expr": "sum(redis_connected_clients{service=~\"$service\",pod=~\"$pod\"})","format": "time_series","intervalFactor": 2,"legendFormat": "","metric": "","refId": "A","step": 2}],"thresholds": "","timeFrom": "1m","timeShift": null,"title": "Clients","type": "singlestat","valueFontSize": "80%","valueMaps": [{"op": "=","text": "N/A","value": "null"}],"valueName": "current"},{"cacheTimeout": null,"colorBackground": false,"colorValue": false,"colors": ["rgba(50, 172, 45, 0.97)","rgba(237, 129, 40, 0.89)","rgba(245, 54, 54, 0.9)"],"datasource": "Prometheus","decimals": 0,"editable": true,"error": false,"fieldConfig": {"defaults": {"custom": {}},"overrides": []},"format": "percent","gauge": {"maxValue": 100,"minValue": 0,"show": true,"thresholdLabels": false,"thresholdMarkers": true},"gridPos": {"h": 7,"w": 3,"x": 5,"y": 0},"hideTimeOverride": true,"id": 11,"interval": null,"isNew": true,"links": [],"mappingType": 1,"mappingTypes": [{"name": "value to text","value": 1},{"name": "range to text","value": 2}],"maxDataPoints": 100,"nullPointMode": "connected","nullText": null,"postfix": "","postfixFontSize": "50%","prefix": "","prefixFontSize": "50%","rangeMaps": [{"from": "null","text": "N/A","to": "null"}],"sparkline": {"fillColor": "rgba(31, 118, 189, 0.18)","full": false,"lineColor": "rgb(31, 120, 193)","show": true},"tableColumn": "","targets": [{"expr": "sum(100 * (redis_memory_used_bytes{service=~\"$service\",pod=~\"$pod\"}  / redis_memory_max_bytes{service=~\"$service\",pod=~\"$pod\"}))","format": "time_series","interval": "","intervalFactor": 2,"legendFormat": "","metric": "","refId": "A","step": 2}],"thresholds": "80,95","timeFrom": "1m","timeShift": null,"title": "Memory Usage","type": "singlestat","valueFontSize": "80%","valueMaps": [{"op": "=","text": "N/A","value": "null"}],"valueName": "current"},{"aliasColors": {},"bars": false,"dashLength": 10,"dashes": false,"datasource": "Prometheus","editable": true,"error": false,"fieldConfig": {"defaults": {"custom": {},"links": []},"overrides": []},"fill": 8,"fillGradient": 0,"grid": {},"gridPos": {"h": 7,"w": 8,"x": 8,"y": 0},"hiddenSeries": false,"id": 18,"isNew": true,"legend": {"avg": false,"current": false,"hideEmpty": false,"hideZero": false,"max": false,"min": false,"show": true,"total": false,"values": false},"lines": true,"linewidth": 1,"links": [],"nullPointMode": "connected","options": {"alertThreshold": true},"percentage": false,"pluginVersion": "7.4.2","pointradius": 5,"points": false,"renderer": "flot","seriesOverrides": [],"spaceLength": 10,"stack": true,"steppedLine": false,"targets": [{"expr": "sum(rate(redis_commands_total{service=~\"$service\",pod=~\"$pod\"} [1m])) by (cmd)","format": "time_series","interval": "","intervalFactor": 2,"legendFormat": "{{ cmd }}","metric": "redis_command_calls_total","refId": "A","step": 240}],"thresholds": [],"timeFrom": null,"timeRegions": [],"timeShift": null,"title": "Total Commands / sec","tooltip": {"msResolution": true,"shared": true,"sort": 2,"value_type": "individual"},"type": "graph","xaxis": {"buckets": null,"mode": "time","name": null,"show": true,"values": []},"yaxes": [{"format": "short","label": null,"logBase": 1,"max": null,"min": null,"show": true},{"format": "short","label": null,"logBase": 1,"max": null,"min": null,"show": true}],"yaxis": {"align": false,"alignLevel": null}},{"aliasColors": {},"bars": false,"dashLength": 10,"dashes": false,"datasource": "Prometheus","decimals": 2,"editable": true,"error": false,"fieldConfig": {"defaults": {"custom": {},"links": []},"overrides": []},"fill": 1,"fillGradient": 0,"grid": {},"gridPos": {"h": 7,"w": 8,"x": 16,"y": 0},"hiddenSeries": false,"id": 1,"isNew": true,"legend": {"avg": false,"current": false,"max": false,"min": false,"show": true,"total": false,"values": false},"lines": true,"linewidth": 2,"links": [],"nullPointMode": "connected","options": {"alertThreshold": true},"percentage": true,"pluginVersion": "7.4.2","pointradius": 5,"points": false,"renderer": "flot","seriesOverrides": [],"spaceLength": 10,"stack": false,"steppedLine": false,"targets": [{"expr": "irate(redis_keyspace_hits_total{service=~\"$service\",pod=~\"$pod\"}[5m])","format": "time_series","hide": false,"interval": "","intervalFactor": 2,"legendFormat": "hits, {{ pod }}","metric": "","refId": "A","step": 240,"target": ""},{"expr": "irate(redis_keyspace_misses_total{service=~\"$service\",pod=~\"$pod\"}[5m])","format": "time_series","hide": false,"interval": "","intervalFactor": 2,"legendFormat": "misses, {{ pod }}","metric": "","refId": "B","step": 240,"target": ""}],"thresholds": [],"timeFrom": null,"timeRegions": [],"timeShift": null,"title": "Hits / Misses per Sec","tooltip": {"msResolution": false,"shared": true,"sort": 0,"value_type": "individual"},"type": "graph","xaxis": {"buckets": null,"mode": "time","name": null,"show": true,"values": []},"yaxes": [{"format": "short","label": "","logBase": 1,"max": null,"min": 0,"show": true},{"format": "short","label": null,"logBase": 1,"max": null,"min": null,"show": true}],"yaxis": {"align": false,"alignLevel": null}},{"aliasColors": {"max": "#BF1B00"},"bars": false,"dashLength": 10,"dashes": false,"datasource": "Prometheus","editable": true,"error": false,"fieldConfig": {"defaults": {"custom": {},"links": []},"overrides": []},"fill": 1,"fillGradient": 0,"grid": {},"gridPos": {"h": 7,"w": 12,"x": 0,"y": 7},"hiddenSeries": false,"id": 7,"isNew": true,"legend": {"avg": false,"current": false,"hideEmpty": false,"hideZero": false,"max": false,"min": false,"show": true,"total": false,"values": false},"lines": true,"linewidth": 2,"links": [],"nullPointMode": "null as zero","options": {"alertThreshold": true},"percentage": false,"pluginVersion": "7.4.2","pointradius": 5,"points": false,"renderer": "flot","seriesOverrides": [],"spaceLength": 10,"stack": false,"steppedLine": false,"targets": [{"expr": "redis_memory_used_bytes{service=~\"$service\",pod=~\"$pod\"}","format": "time_series","interval": "","intervalFactor": 2,"legendFormat": "used, {{ pod }}","metric": "","refId": "A","step": 240,"target": ""},{"expr": "redis_memory_max_bytes{service=~\"$service\",pod=~\"$pod\"}","format": "time_series","hide": false,"interval": "","intervalFactor": 2,"legendFormat": "max, {{ pod }}","refId": "B","step": 240}],"thresholds": [],"timeFrom": null,"timeRegions": [],"timeShift": null,"title": "Total Memory Usage","tooltip": {"msResolution": false,"shared": true,"sort": 0,"value_type": "cumulative"},"type": "graph","xaxis": {"buckets": null,"mode": "time","name": null,"show": true,"values": []},"yaxes": [{"format": "bytes","label": null,"logBase": 1,"max": null,"min": 0,"show": true},{"format": "short","label": null,"logBase": 1,"max": null,"min": null,"show": true}],"yaxis": {"align": false,"alignLevel": null}},{"aliasColors": {},"bars": false,"dashLength": 10,"dashes": false,"datasource": "Prometheus","editable": true,"error": false,"fieldConfig": {"defaults": {"custom": {},"links": []},"overrides": []},"fill": 1,"fillGradient": 0,"grid": {},"gridPos": {"h": 7,"w": 12,"x": 12,"y": 7},"hiddenSeries": false,"id": 10,"isNew": true,"legend": {"avg": false,"current": false,"max": false,"min": false,"show": true,"total": false,"values": false},"lines": true,"linewidth": 2,"links": [],"nullPointMode": "connected","options": {"alertThreshold": true},"percentage": false,"pluginVersion": "7.4.2","pointradius": 5,"points": false,"renderer": "flot","seriesOverrides": [],"spaceLength": 10,"stack": false,"steppedLine": false,"targets": [{"expr": "sum(rate(redis_net_input_bytes_total{service=~\"$service\",pod=~\"$pod\"}[5m])) by (pod)","format": "time_series","interval": "","intervalFactor": 2,"legendFormat": "input, {{ pod }}","refId": "A","step": 240},{"expr": "sum(rate(redis_net_output_bytes_total{service=~\"$service\",pod=~\"$pod\"}[5m])) by (pod)","format": "time_series","interval": "","intervalFactor": 2,"legendFormat": "output, {{ pod }}","refId": "B","step": 240}],"thresholds": [],"timeFrom": null,"timeRegions": [],"timeShift": null,"title": "Network I/O","tooltip": {"msResolution": true,"shared": true,"sort": 0,"value_type": "cumulative"},"type": "graph","xaxis": {"buckets": null,"mode": "time","name": null,"show": true,"values": []},"yaxes": [{"format": "bytes","label": null,"logBase": 1,"max": null,"min": null,"show": true},{"format": "short","label": null,"logBase": 1,"max": null,"min": null,"show": true}],"yaxis": {"align": false,"alignLevel": null}},{"aliasColors": {},"bars": false,"dashLength": 10,"dashes": false,"datasource": "Prometheus","editable": true,"error": false,"fieldConfig": {"defaults": {"custom": {},"links": []},"overrides": []},"fill": 7,"fillGradient": 0,"grid": {},"gridPos": {"h": 7,"w": 12,"x": 0,"y": 14},"hiddenSeries": false,"id": 5,"isNew": true,"legend": {"alignAsTable": false,"avg": false,"current": true,"hideEmpty": false,"hideZero": true,"max": false,"min": false,"rightSide": false,"show": true,"total": false,"values": true},"lines": true,"linewidth": 2,"links": [],"nullPointMode": "connected","options": {"alertThreshold": true},"percentage": false,"pluginVersion": "7.4.2","pointradius": 5,"points": false,"renderer": "flot","seriesOverrides": [],"spaceLength": 10,"stack": true,"steppedLine": false,"targets": [{"expr": "sum (redis_db_keys{service=~\"$service\",pod=~\"$pod\"}) by (db, pod)","format": "time_series","interval": "","intervalFactor": 2,"legendFormat": "{{ db }}, {{ pod }}","refId": "A","step": 240,"target": ""}],"thresholds": [],"timeFrom": null,"timeRegions": [],"timeShift": null,"title": "Total Items per DB","tooltip": {"msResolution": false,"shared": true,"sort": 0,"value_type": "individual"},"type": "graph","xaxis": {"buckets": null,"mode": "time","name": null,"show": true,"values": []},"yaxes": [{"format": "none","label": null,"logBase": 1,"max": null,"min": null,"show": true},{"format": "short","label": null,"logBase": 1,"max": null,"min": null,"show": true}],"yaxis": {"align": false,"alignLevel": null}},{"aliasColors": {},"bars": false,"dashLength": 10,"dashes": false,"datasource": "Prometheus","editable": true,"error": false,"fieldConfig": {"defaults": {"custom": {},"links": []},"overrides": []},"fill": 7,"fillGradient": 0,"grid": {},"gridPos": {"h": 7,"w": 12,"x": 12,"y": 14},"hiddenSeries": false,"id": 13,"isNew": true,"legend": {"avg": false,"current": false,"max": false,"min": false,"show": true,"total": false,"values": false},"lines": true,"linewidth": 2,"links": [],"nullPointMode": "connected","options": {"alertThreshold": true},"percentage": false,"pluginVersion": "7.4.2","pointradius": 5,"points": false,"renderer": "flot","seriesOverrides": [],"spaceLength": 10,"stack": true,"steppedLine": false,"targets": [{"expr": "sum (redis_db_keys{service=~\"$service\",pod=~\"$pod\"}) by (pod) - sum (redis_db_keys_expiring{service=~\"$service\",pod=~\"$pod\"}) by (pod)","format": "time_series","interval": "","intervalFactor": 2,"legendFormat": "not expiring, {{ pod }}","refId": "A","step": 240,"target": ""},{"expr": "sum (redis_db_keys_expiring{service=~\"$service\",pod=~\"$pod\"}) by (pod)","format": "time_series","interval": "","intervalFactor": 2,"legendFormat": "expiring, {{ pod }}","metric": "","refId": "B","step": 240}],"thresholds": [],"timeFrom": null,"timeRegions": [],"timeShift": null,"title": "Expiring vs Not-Expiring Keys","tooltip": {"msResolution": false,"shared": true,"sort": 0,"value_type": "individual"},"type": "graph","xaxis": {"buckets": null,"mode": "time","name": null,"show": true,"values": []},"yaxes": [{"format": "short","label": null,"logBase": 1,"max": null,"min": null,"show": true},{"format": "short","label": null,"logBase": 1,"max": null,"min": null,"show": true}],"yaxis": {"align": false,"alignLevel": null}},{"aliasColors": {"evicts": "#890F02","memcached_items_evicted_total{instance=\"172.17.0.1:9150\",job=\"prometheus\"}": "#890F02","reclaims": "#3F6833"},"bars": false,"dashLength": 10,"dashes": false,"datasource": "Prometheus","editable": true,"error": false,"fieldConfig": {"defaults": {"custom": {},"links": []},"overrides": []},"fill": 1,"fillGradient": 0,"grid": {},"gridPos": {"h": 7,"w": 12,"x": 0,"y": 21},"hiddenSeries": false,"id": 8,"isNew": true,"legend": {"avg": false,"current": false,"max": false,"min": false,"show": true,"total": false,"values": false},"lines": true,"linewidth": 2,"links": [],"nullPointMode": "connected","options": {"alertThreshold": true},"percentage": false,"pluginVersion": "7.4.2","pointradius": 5,"points": false,"renderer": "flot","seriesOverrides": [{"alias": "reclaims","yaxis": 2}],"spaceLength": 10,"stack": false,"steppedLine": false,"targets": [{"expr": "sum(rate(redis_expired_keys_total{service=~\"$service\",pod=~\"$pod\"}[5m])) by (pod)","format": "time_series","hide": false,"interval": "","intervalFactor": 2,"legendFormat": "expired, {{ pod }}","metric": "","refId": "A","step": 240,"target": ""},{"expr": "sum(rate(redis_evicted_keys_total{service=~\"$service\",pod=~\"$pod\"}[5m])) by (pod)","format": "time_series","interval": "","intervalFactor": 2,"legendFormat": "evicted, {{ pod }}","refId": "B","step": 240}],"thresholds": [],"timeFrom": null,"timeRegions": [],"timeShift": null,"title": "Expired/Evicted Keys","tooltip": {"msResolution": false,"shared": true,"sort": 0,"value_type": "cumulative"},"type": "graph","xaxis": {"buckets": null,"mode": "time","name": null,"show": true,"values": []},"yaxes": [{"format": "short","label": null,"logBase": 1,"max": null,"min": null,"show": true},{"format": "short","label": null,"logBase": 1,"max": null,"min": null,"show": true}],"yaxis": {"align": false,"alignLevel": null}},{"aliasColors": {},"bars": false,"dashLength": 10,"dashes": false,"datasource": "Prometheus","fieldConfig": {"defaults": {"custom": {},"links": []},"overrides": []},"fill": 1,"fillGradient": 0,"gridPos": {"h": 7,"w": 12,"x": 12,"y": 21},"hiddenSeries": false,"id": 16,"legend": {"avg": false,"current": false,"max": false,"min": false,"show": true,"total": false,"values": false},"lines": true,"linewidth": 1,"links": [],"nullPointMode": "null","options": {"alertThreshold": true},"percentage": false,"pluginVersion": "7.4.2","pointradius": 2,"points": false,"renderer": "flot","seriesOverrides": [],"spaceLength": 10,"stack": false,"steppedLine": false,"targets": [{"expr": "sum(redis_connected_clients{service=~\"$service\",pod=~\"$pod\"})","format": "time_series","intervalFactor": 1,"legendFormat": "connected","refId": "A"},{"expr": "sum(redis_blocked_clients{service=~\"$service\",pod=~\"$pod\"})","format": "time_series","intervalFactor": 1,"legendFormat": "blocked","refId": "B"}],"thresholds": [],"timeFrom": null,"timeRegions": [],"timeShift": null,"title": "Connected/Blocked Clients","tooltip": {"shared": true,"sort": 0,"value_type": "individual"},"type": "graph","xaxis": {"buckets": null,"mode": "time","name": null,"show": true,"values": []},"yaxes": [{"format": "short","label": null,"logBase": 1,"max": null,"min": null,"show": true},{"format": "short","label": null,"logBase": 1,"max": null,"min": null,"show": true}],"yaxis": {"align": false,"alignLevel": null}},{"aliasColors": {},"bars": false,"dashLength": 10,"dashes": false,"datasource": "Prometheus","editable": true,"error": false,"fieldConfig": {"defaults": {"custom": {},"links": []},"overrides": []},"fill": 2,"fillGradient": 0,"grid": {},"gridPos": {"h": 7,"w": 12,"x": 0,"y": 28},"hiddenSeries": false,"id": 20,"isNew": true,"legend": {"avg": false,"current": false,"hideEmpty": false,"hideZero": true,"max": false,"min": false,"show": true,"total": false,"values": false},"lines": true,"linewidth": 1,"links": [],"nullPointMode": "connected","options": {"alertThreshold": true},"percentage": false,"pluginVersion": "7.4.2","pointradius": 5,"points": false,"renderer": "flot","seriesOverrides": [],"spaceLength": 10,"stack": false,"steppedLine": false,"targets": [{"expr": "sum(irate(redis_commands_duration_seconds_total{service=~\"$service\",pod=~\"$pod\"}[1m])) by (cmd)\n  /\nsum(irate(redis_commands_total{service=~\"$service\",pod=~\"$pod\"}[1m])) by (cmd)\n","format": "time_series","interval": "","intervalFactor": 2,"legendFormat": "{{ cmd }}","metric": "redis_command_calls_total","refId": "A","step": 240}],"thresholds": [],"timeFrom": null,"timeRegions": [],"timeShift": null,"title": "Average Time Spent by Command / sec","tooltip": {"msResolution": true,"shared": true,"sort": 2,"value_type": "individual"},"type": "graph","xaxis": {"buckets": null,"mode": "time","name": null,"show": true,"values": []},"yaxes": [{"format": "s","label": null,"logBase": 1,"max": null,"min": null,"show": true},{"format": "short","label": null,"logBase": 1,"max": null,"min": null,"show": true}],"yaxis": {"align": false,"alignLevel": null}},{"aliasColors": {},"bars": false,"dashLength": 10,"dashes": false,"datasource": "Prometheus","editable": true,"error": false,"fieldConfig": {"defaults": {"custom": {},"links": []},"overrides": []},"fill": 8,"fillGradient": 0,"grid": {},"gridPos": {"h": 7,"w": 12,"x": 12,"y": 28},"hiddenSeries": false,"id": 14,"isNew": true,"legend": {"avg": false,"current": false,"hideEmpty": false,"hideZero": false,"max": false,"min": false,"show": true,"total": false,"values": false},"lines": true,"linewidth": 1,"links": [],"nullPointMode": "connected","options": {"alertThreshold": true},"percentage": false,"pluginVersion": "7.4.2","pointradius": 5,"points": false,"renderer": "flot","seriesOverrides": [],"spaceLength": 10,"stack": true,"steppedLine": false,"targets": [{"expr": "sum(irate(redis_commands_duration_seconds_total{service=~\"$service\",pod=~\"$pod\"}[1m])) by (cmd) != 0","format": "time_series","interval": "","intervalFactor": 2,"legendFormat": "{{ cmd }}","metric": "redis_command_calls_total","refId": "A","step": 240}],"thresholds": [],"timeFrom": null,"timeRegions": [],"timeShift": null,"title": "Total Time Spent by Command / sec","tooltip": {"msResolution": true,"shared": true,"sort": 2,"value_type": "individual"},"type": "graph","xaxis": {"buckets": null,"mode": "time","name": null,"show": true,"values": []},"yaxes": [{"format": "s","label": null,"logBase": 1,"max": null,"min": null,"show": true},{"format": "short","label": null,"logBase": 1,"max": null,"min": null,"show": true}],"yaxis": {"align": false,"alignLevel": null}}],"refresh": false,"schemaVersion": 27,"style": "dark","tags": ["prometheus","redis"],"templating": {"list": [{"allValue": null,"current": {"selected": true,"text": "lkirulxq-l46-redis-exporter-svc","value": "lkirulxq-l46-redis-exporter-svc"},"datasource": null,"definition": "label_values(redis_up,service)","description": null,"error": null,"hide": 0,"includeAll": false,"label": "Service","multi": false,"name": "service","options": [],"query": {"query": "label_values(redis_up,service)","refId": "StandardVariableQuery"},"refresh": 1,"regex": "","skipUrlSync": false,"sort": 1,"tagValuesQuery": "","tags": [],"tagsQuery": "","type": "query","useTags": false},{"allValue": null,"current": {"selected": false,"text": "lkirulxq-l46-redis-1","value": "lkirulxq-l46-redis-1"},"datasource": null,"definition": "label_values(redis_up{service=\"$service\"},pod)","description": null,"error": null,"hide": 0,"includeAll": false,"label": "Pod","multi": false,"name": "pod","options": [],"query": {"query": "label_values(redis_up{service=\"$service\"},pod)","refId": "StandardVariableQuery"},"refresh": 1,"regex": "","skipUrlSync": false,"sort": 0,"tagValuesQuery": "","tags": [],"tagsQuery": "","type": "query","useTags": false},{"auto": false,"auto_count": 30,"auto_min": "10s","current": {"selected": false,"text": "1s","value": "1s"},"description": null,"error": null,"hide": 0,"label": "Interval","name": "interval","options": [{"selected": true,"text": "1s","value": "1s"},{"selected": false,"text": "5s","value": "5s"},{"selected": false,"text": "1m","value": "1m"},{"selected": false,"text": "5m","value": "5m"},{"selected": false,"text": "1h","value": "1h"},{"selected": false,"text": "6h","value": "6h"},{"selected": false,"text": "1d","value": "1d"}],"query": "1s,5s,1m,5m,1h,6h,1d","refresh": 2,"skipUrlSync": false,"type": "interval"}]},"time": {"from": "now-24h","to": "now"},"timepicker": {"refresh_intervals": ["5s","10s","30s","1m","5m","15m","30m","1h","2h","1d"],"time_options": ["5m","15m","1h","6h","12h","24h","2d","7d","30d"]},"timezone": "browser","title": "Redis Overview","uid": "redis","version": 6
}
2. 创建 configmaps
kubectl apply configmap redis-dashboard -n prometheus --from-file=redis.json
编辑 configmap 添加 label
kubectl edit cm  redis-dashboards -n prometheus
....
metadata:labels:grafana_dashboard: "1"
.......
....
3. grafana 界面查看
相关文章:
Grafana dashboards as ConfigMaps
文章目录 1. 简介2. 创建 configmaps3. grafana 界面查看 1. 简介 将 Grafana 仪表板存储为 Kubernetes ConfigMap 相比传统的通过 Grafana 界面导入仪表板有以下一些主要优点: 版本控制: ConfigMap 可以存储在版本控制系统(如Git)中,便于跟踪和管理仪表板的变更历…...
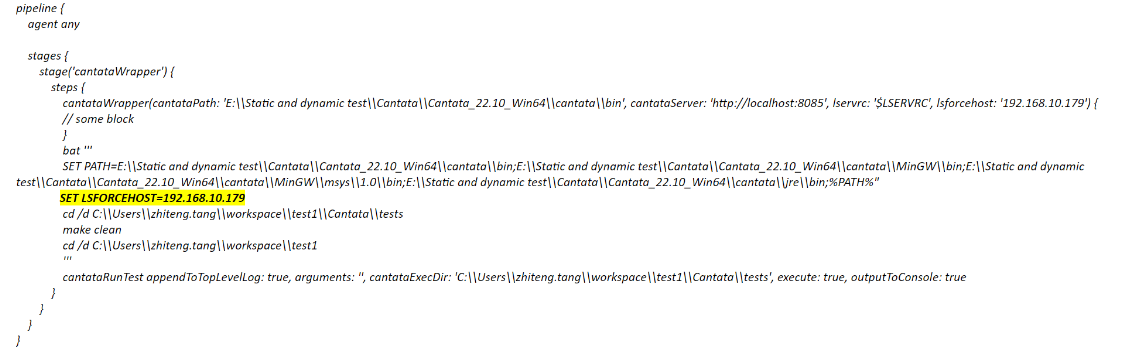
【QA-SYSTEMS】CANTATA-解决Jenkins中build Cantata报错
【更多软件使用问题请点击亿道电子官方网站查询】 1、 文档目标 解决Jenkins中build Cantata测试项目报找不到license server的错误。 2、 问题场景 在Jenkins中build Cantata测试项目,报错“Failed to figure out the license server correctly”。 3、软硬件环…...

个人网站展示(静态)
大学期间做了一个个人博客网站,纯H5编码的网站,利用php搭建了一个留言模块。 有需要源码的同学,可以联系我~ 首页: IT杂记模块 文人墨客模块 劳有所获模块 生活日志模块 关于我 一个推崇全栈开发的前端开发人员 微信: itrzzh …...

C++——内存管理、模板
一、C内存管理 在C语言中我们曾学习过动态内存管理的相关知识,通过malloc、calloc、realloc和free等对堆上的空间进行申请和释放。在C中我们同样会面临类似的需求,因此C对动态开辟内存的方式进行了一些调整,我们可以使用new和delete操作符来对…...

商品上传上货搬家使用1688商品采集api接口
1688.item_get 公共参数 名称类型必须描述keyString是调用key(必须以GET方式拼接在URL中)secretString是调用密钥api_nameString是API接口名称(包括在请求地址中)[item_search,item_get,item_search_shop等]cacheString否[yes,no…...
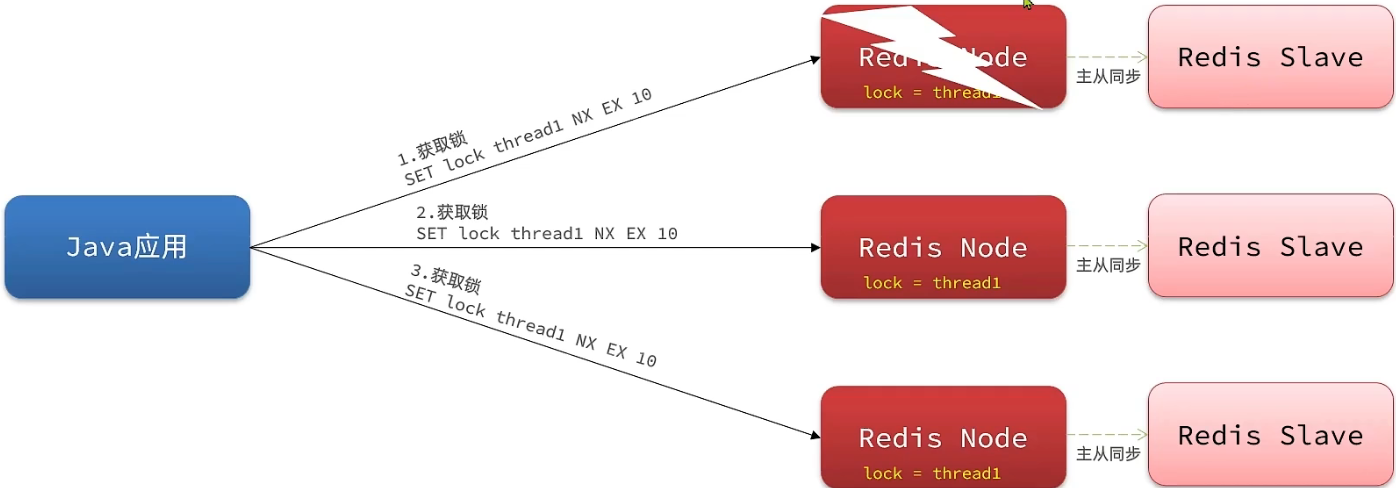
redisson解决redis服务器的主从一致性问题
redisson解决redis的主节点和从节点一致性的问题。从而解决锁被错误获取的情况。 实际开发中我们会搭建多台redis服务器,但这些服务器分主次,主服务器负责处理写的操作(增删改),从服务器负责处理读的操作,…...

Vue-router
router的使用(52) 5个基础步骤: 1.在终端执行yarn add vue-router3.6.5,安装router插件 yarn add vue-router3.6.5 2.在文件的main.js中引入router插件 import VueRouter from vue-router 3.在main.js中安装注册Vue.use(Vue…...
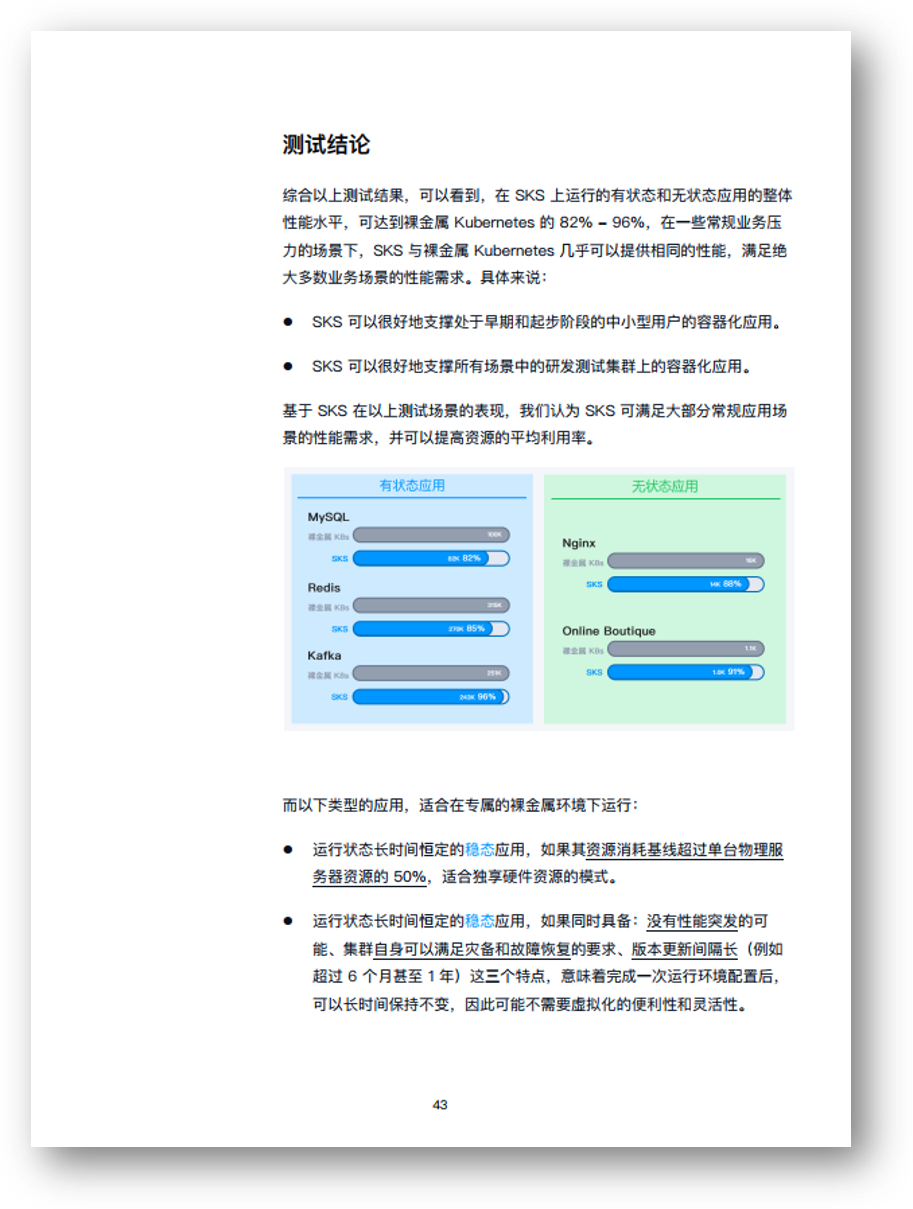
白皮书发布|超融合运行 K8s 的场景、功能与优势
目前,不少企业都使用虚拟化/超融合运行 Kubernetes 和容器化应用。一些用户可能会有疑惑:既然 Kubernetes 可以部署在裸金属上,使用虚拟化不是“多此一举”吗? 在电子书《IT 基础架构团队的 Kubernetes 管理:从入门到…...

全局Ceph节点宕机处理
在极端情况下,如数据中心断电,造成 Ceph 存储集群全局宕机,可以按照本节所示流程进行 Ceph 集群上电恢复操作。 4.1 手动上电执行步骤 如为 Ceph 集群上电,monitor server 应最先上电;集群上电前确认使用 Ceph 之前端…...

电脑中缺失EMP.dll文件怎么办,解决EMP.dll丢失问题的有效方法分享
当你的电脑出现由于找不到emp.dll无法继续执行代码的提示,那你要怎么办呢?其实解决方法还是挺多的,今天就来给大家详细的说说emp.dll这方面的信息吧。 一、电脑为什么会出现emp.dll丢失 不完全卸载软件:在卸载程序时,…...
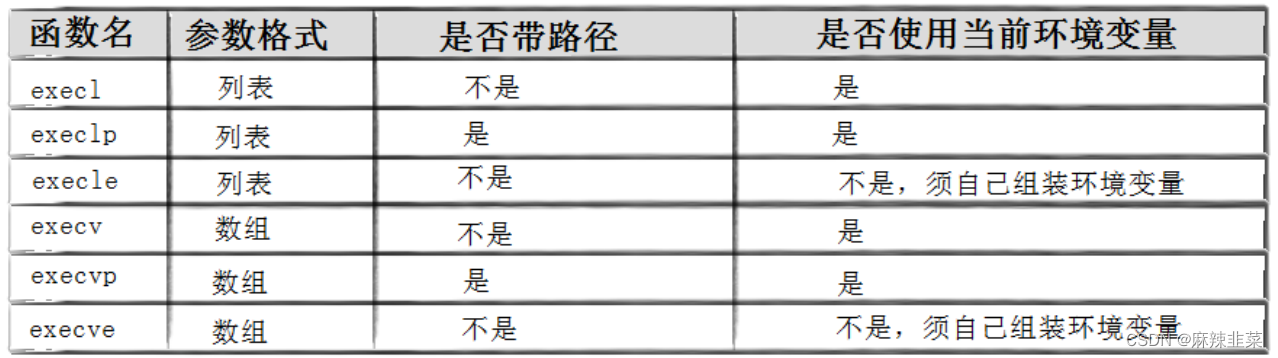
Linux 进程程序替换
💓博主CSDN主页:麻辣韭菜-CSDN博客💓 ⏩专栏分类:http://t.csdnimg.cn/G90eI⏪ 🚚代码仓库:Linux: Linux日常代码练习🚚 🌹关注我🫵带你学习更多Linux知识 🔝ǵ…...

系统分析与设计(一)
我们有这么多各式各样的工具,互联网给我们带来了这么多用户和数据,这是好事也有副作用。 世界上能访问用户数据,并根据数据做分析和改进的公司,大概Google是其中翘楚,这种 data-centric 的做法做过了头,也有悲剧发生: Douglas Bowman 曾经是Google 的视觉设计主管,2009年的一天…...
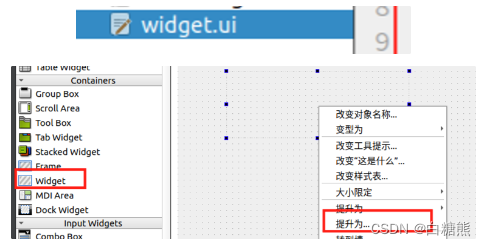
【QT】自定义控件的示例
自定义控件(很重要) 什么是自定义控件? 顾名思义就是创建一个窗口,放入多个控件,拼接起来,一起使用。 为什么需要它? 需求,假设有100个窗口,那如果有两个控件同时被使…...
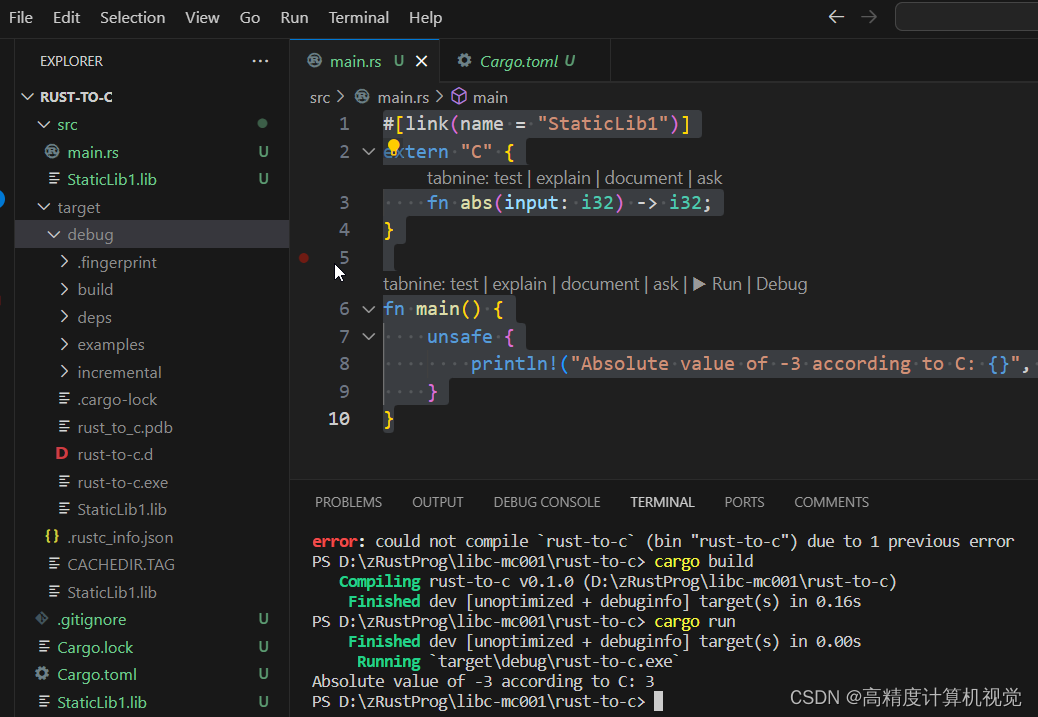
Rust入门:Rust如何调用C静态库的函数
关于Rust调用C,因为接口比较复杂,貌似Rust不打算支持。而对于C函数,则相对支持较好。 如果要研究C/Rust相互关系的话,可以参考: https://docs.rs/cxx/latest/cxx/ Rust ❤️ C 这里只对调用C静态库做一个最简短的介…...
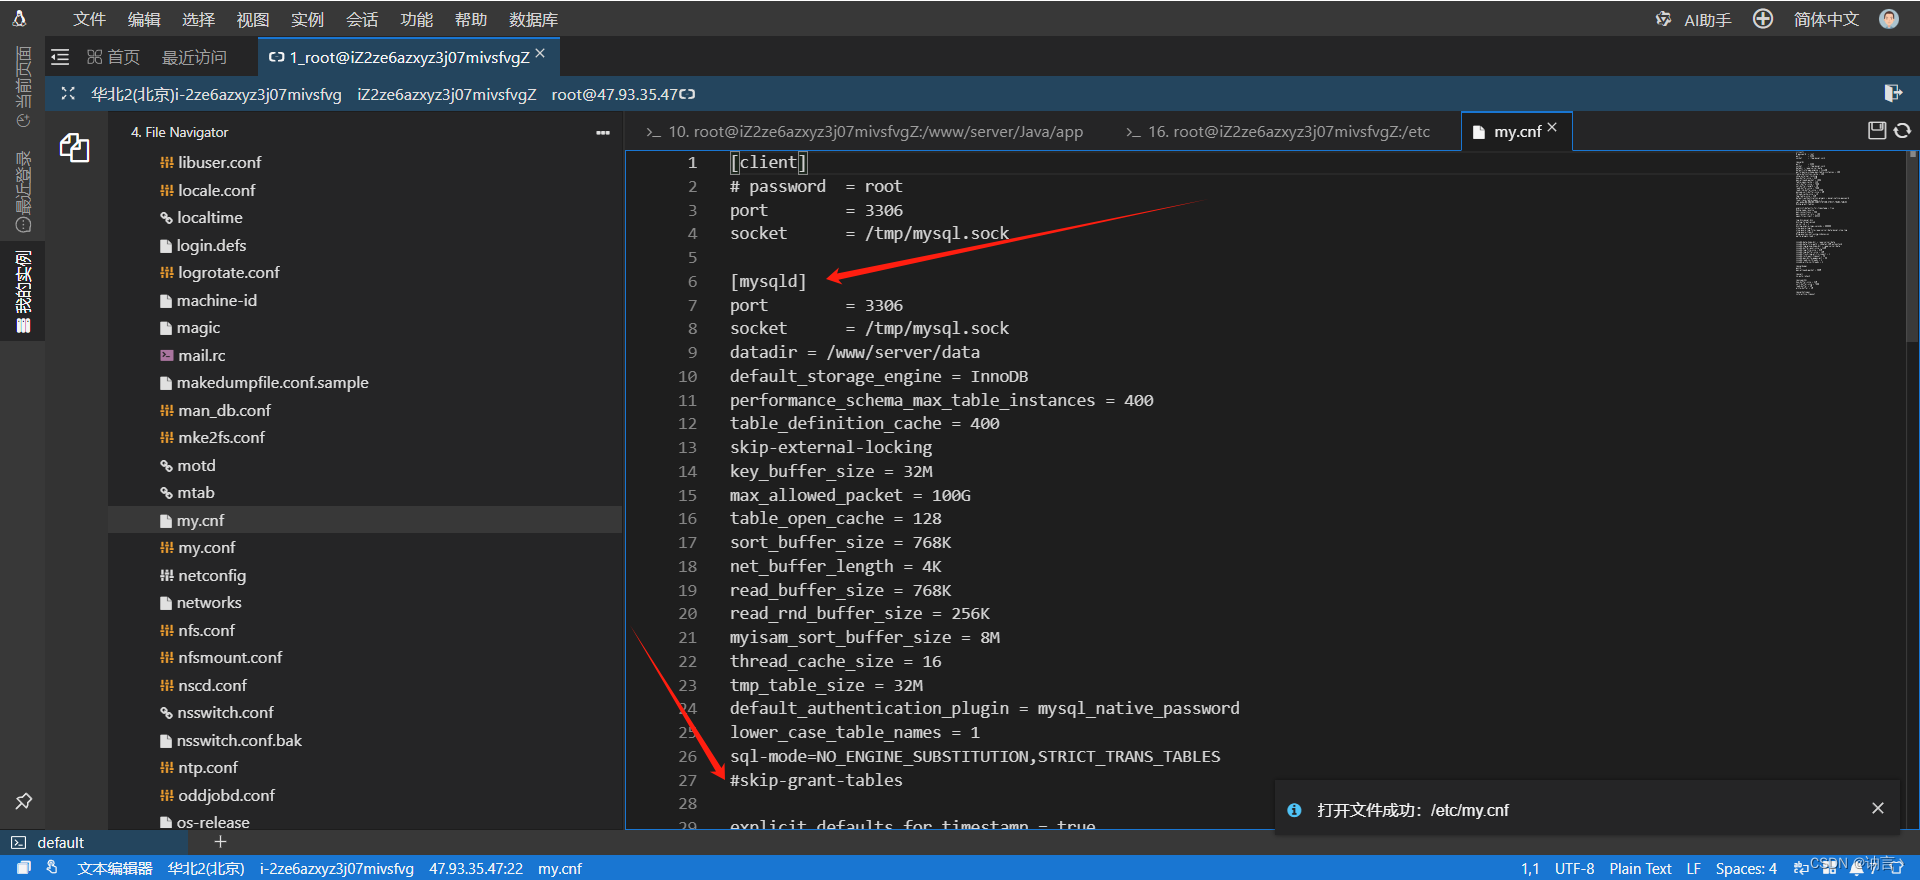
阿里云Linux系统MySQL8忘记密码修改密码
相关版本 操作系统:Alibaba Cloud Linux 3.2104 LTS 64位MySQL:mysql Ver 8.0.34 for Linux on x86_64 (Source distribution) MySQL版本可通过下方命令查询 mysql --version一、修改my.cnf文件 文件位置:etc/my.cnf进入远程连接后可以打…...

初识C语言—字符串、转义字符、注释
字符串 字符串就是一串字符 用英文双引号括起来的字符 int main() {"dasgfhjkasg\n""hello world!"return 0; } 字符串的结束标志是\0这个转义字符 如何证明呢? int main() {//字符数组 - 数组是一组相同类型的元素char arr[] "hel…...

洛谷 P1731 [NOI1999] 生日蛋糕
题目 题目链接 自己没看题解写的,摸石头过河,解释一下 首先,输入输出都是正整数。先搞定输入,再判断条件,如果无解,输出0,否则输出蛋糕外表面面积Q(这里用全局变量,开l…...

操作教程|使用MeterSphere对恒生UFX系统进行压力测试
恒生UFX(United Finance Exchange,统一金融交换)系统(以下简称为“UFX系统”),是一款帮助证券公司统一管理外部接入客户的系统,该系统整体上覆盖了期货、证券、基金、银行、信托、海外业务等各类…...
算法中的数学知识
文章目录 算法中的数学知识约数约数个数约数之和 筛法求质数阶乘分解解法一解法二: 欧拉函数基本模板筛法求欧拉函数大数据幂的欧拉函数 快速幂费马小定理快速幂求逆元数论分块例题:[因数平方和](https://www.acwing.com/problem/content/4665/)分析:具体…...
2024高频前端面试题 Vue2 和 Vue3 篇
HTML和CSS篇:2024高频前端面试题 HTML 和 CSS 篇-CSDN博客 JavaScript 和 ES6 篇: 2024高频前端面试题 JavaScript 和 ES6 篇-CSDN博客 * Vue2 和 Vue3的区别: 1)双向数据绑定原理的区别 2)根节点的不同 Vue2只能一…...

【JAVA基础面经】进程间的通信方式
文章目录前言1.管道(Pipe)2.命名管道(FIFO)3.消息队列4.共享内存5.信号量6.信号(Signal)7.Socket面试问题前言 进程是系统资源分配的最小单位,每个进程拥有独立的地址空间。为了保证不同进程之间…...

终极Pingvin Share配置优化指南:从基础设置到高级安全防护
终极Pingvin Share配置优化指南:从基础设置到高级安全防护 【免费下载链接】pingvin-share A self-hosted file sharing platform that combines lightness and beauty, perfect for seamless and efficient file sharing. 项目地址: https://gitcode.com/gh_mirr…...

Alacritty Theme主题对比分析:深色vs浅色主题的视觉体验差异
Alacritty Theme主题对比分析:深色vs浅色主题的视觉体验差异 【免费下载链接】alacritty-theme Collection of Alacritty color schemes 项目地址: https://gitcode.com/gh_mirrors/ala/alacritty-theme Alacritty是一款轻量级、高性能的终端模拟器ÿ…...

开源文档迁移神器:feishu-doc-export如何3步解决企业知识库转移效率难题
开源文档迁移神器:feishu-doc-export如何3步解决企业知识库转移效率难题 【免费下载链接】feishu-doc-export 飞书文档导出服务 项目地址: https://gitcode.com/gh_mirrors/fe/feishu-doc-export 想象一下,你的公司要从飞书切换到企业微信&#x…...

IDEC PF3S-HSC1输入模块
IDEC PF3S-HSC1 输入模块该设备属于 IDEC FA-3S系列中的高速功能模块,常见于PLC控制系统架构中,主要用于高速信号采集与输入处理,在运动控制与自动化生产线中应用较多。属于FA-3S系列PLC扩展模块,用于高速输入信号处理。可接收高速…...

Autosar MCAL开发避坑指南:EB配置Icu模块时,关于EMIOS时钟、中断与通道选择的三个关键决策点
Autosar MCAL实战:EMIOS时钟分频与ICU通道配置的三大核心策略 在汽车电子控制单元(ECU)开发中,精确捕获PWM信号是获取转速、位置等关键物理量的基础。我曾参与过多个基于Autosar的电机控制项目,发现约60%的Icu模块配置问题都源于EMIOS时钟设置…...

2026亚马逊爬虫终极实战:绕过AWS WAF v2+JA4+TLS指纹检测,零封号搭建跨境电商数据监控系统
一、项目背景:2026亚马逊反爬现状 上个月我维护了一年的亚马逊爬虫突然全挂了,所有请求统一返回403 Forbidden。排查了整整一周才发现,亚马逊在2026年Q1全面升级了AWS WAF v2 Bot Control,新增了JA4 TLS指纹检测和HTTP/2帧顺序验证…...
连接劣)
Springboot 实现多数据源(PostgreSQL 和 SQL Server)连接劣
一、环境准备 Free Spire.Doc for Python 是免费 Python 文档处理库,无需依赖 Microsoft Word,支持 Word 文档的创建、编辑、转换等操作,其中内置的 Markdown 解析能力,能高效实现 Markdown 到 Doc/Docx 格式的转换,且…...

vxe-table主题定制:CSS变量驱动的企业级UI架构解决方案
vxe-table主题定制:CSS变量驱动的企业级UI架构解决方案 【免费下载链接】vxe-table vxe table 支持 vue2, vue3 的表格解决方案 项目地址: https://gitcode.com/gh_mirrors/vx/vxe-table 在企业级应用开发中,表格组件往往需要与品牌设计系统深度集…...

用STM32和US100超声波模块做个智能小车避障:从硬件连接到代码调试全流程
STM32与US100超声波模块实战:打造高精度智能避障小车 项目背景与核心组件 智能小车作为嵌入式开发的经典项目,融合了传感器技术、电机控制和算法逻辑等多个领域。在这个项目中,我们将使用STM32F103C8T6最小系统板作为主控,搭配US1…...