Python绘图
1.二维绘图
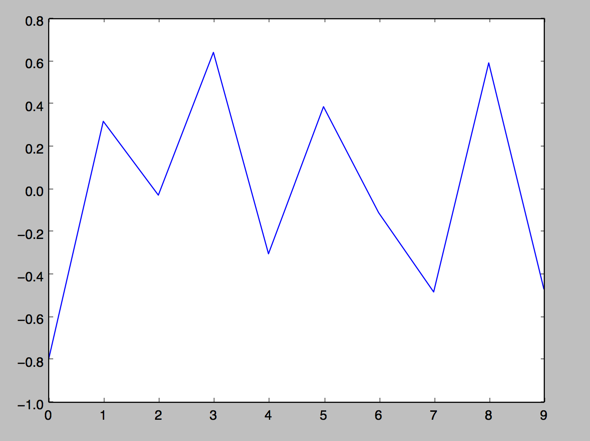
a. 一维数据集
用 Numpy ndarray 作为数据传入 ply
1.
import numpy as np
import matplotlib as mpl
import matplotlib.pyplot as pltnp.random.seed(1000)
y = np.random.standard_normal(10)
print "y = %s"% y
x = range(len(y))
print "x=%s"% x
plt.plot(y)
plt.show()

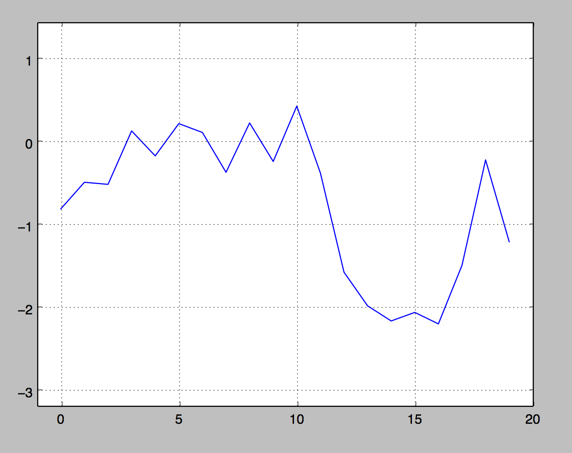
2.操纵坐标轴和增加网格及标签的函数
import numpy as np
import matplotlib as mpl
import matplotlib.pyplot as pltnp.random.seed(1000)
y = np.random.standard_normal(10)
plt.plot(y.cumsum())
plt.grid(True) ##增加格点
plt.axis('tight') # 坐标轴适应数据量 axis 设置坐标轴
plt.show()

3.plt.xlim 和 plt.ylim 设置每个坐标轴的最小值和最大值
#!/etc/bin/python
#coding=utf-8
import numpy as np
import matplotlib as mpl
import matplotlib.pyplot as pltnp.random.seed(1000)
y = np.random.standard_normal(20)
plt.plot(y.cumsum())
plt.grid(True) ##增加格点
plt.xlim(-1,20)
plt.ylim(np.min(y.cumsum())- 1, np.max(y.cumsum()) + 1)plt.show()
4. 添加标题和标签 plt.title, plt.xlabe, plt.ylabel 离散点, 线
#!/etc/bin/python
#coding=utf-8
import numpy as np
import matplotlib as mpl
import matplotlib.pyplot as pltnp.random.seed(1000)
y = np.random.standard_normal(20)plt.figure(figsize=(7,4)) #画布大小
plt.plot(y.cumsum(),'b',lw = 1.5) # 蓝色的线
plt.plot(y.cumsum(),'ro') #离散的点
plt.grid(True)
plt.axis('tight')
plt.xlabel('index')
plt.ylabel('value')
plt.title('A simple Plot')
plt.show()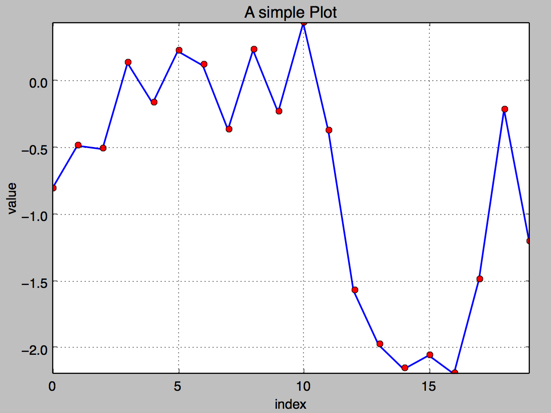
b. 二维数据集
np.random.seed(2000)
y = np.random.standard_normal((10, 2)).cumsum(axis=0)   #10行2列   在这个数组上调用cumsum 计算赝本数据在0轴(即第一维)上的总和
print y

1.两个数据集绘图
#!/etc/bin/python
#coding=utf-8
import numpy as np
import matplotlib as mpl
import matplotlib.pyplot as pltnp.random.seed(2000)
y = np.random.standard_normal((10, 2))
plt.figure(figsize=(7,5))
plt.plot(y, lw = 1.5)
plt.plot(y, 'ro')
plt.grid(True)
plt.axis('tight')
plt.xlabel('index')
plt.ylabel('value')
plt.title('A simple plot')
plt.show()

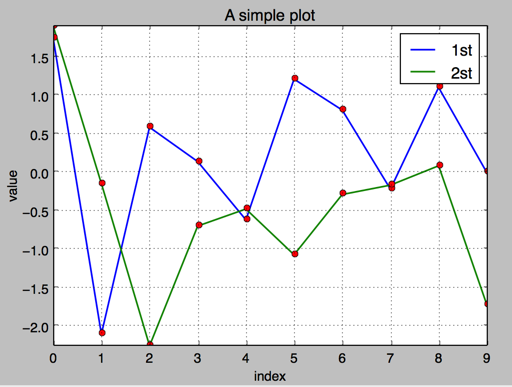
2.添加图例 plt.legend(loc = 0)
#!/etc/bin/python
#coding=utf-8
import numpy as np
import matplotlib as mpl
import matplotlib.pyplot as pltnp.random.seed(2000)
y = np.random.standard_normal((10, 2))
plt.figure(figsize=(7,5))
plt.plot(y[:,0], lw = 1.5,label = '1st')
plt.plot(y[:,1], lw = 1.5, label = '2st')
plt.plot(y, 'ro')
plt.grid(True)
plt.legend(loc = 0) #图例位置自动
plt.axis('tight')
plt.xlabel('index')
plt.ylabel('value')
plt.title('A simple plot')
plt.show()
3.使用2个 Y轴(左右)fig, ax1 = plt.subplots() ax2 = ax1.twinx()
#!/etc/bin/python
#coding=utf-8
import numpy as np
import matplotlib as mpl
import matplotlib.pyplot as pltnp.random.seed(2000)
y = np.random.standard_normal((10, 2))fig, ax1 = plt.subplots() # 关键代码1 plt first data set using first (left) axisplt.plot(y[:,0], lw = 1.5,label = '1st')plt.plot(y[:,0], 'ro')
plt.grid(True)
plt.legend(loc = 0) #图例位置自动
plt.axis('tight')
plt.xlabel('index')
plt.ylabel('value')
plt.title('A simple plot')ax2 = ax1.twinx()  #关键代码2  plt second data set using second(right) axis
plt.plot(y[:,1],'g', lw = 1.5, label = '2nd')
plt.plot(y[:,1], 'ro')
plt.legend(loc = 0)
plt.ylabel('value 2nd')
plt.show()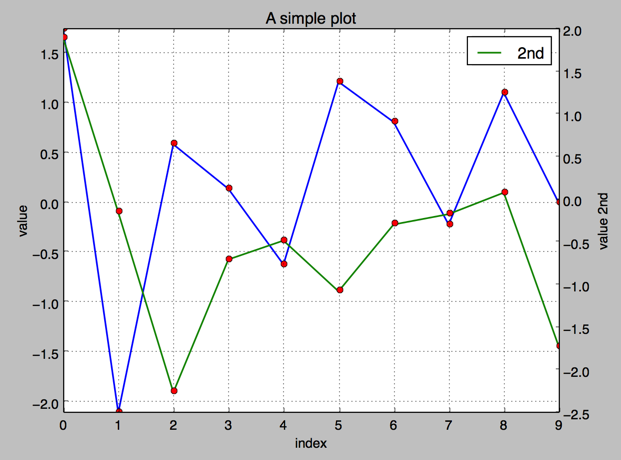
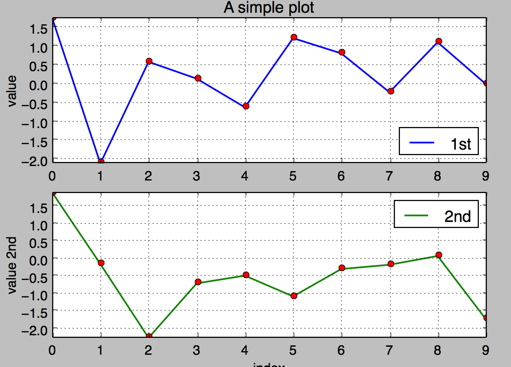
4.使用两个子图(上下,左右)plt.subplot(211)
通过使用 plt.subplots 函数,可以直接访问底层绘图对象,例如可以用它生成和第一个子图共享 x 轴的第二个子图.
#!/etc/bin/python
#coding=utf-8
import numpy as np
import matplotlib as mpl
import matplotlib.pyplot as pltnp.random.seed(2000)
y = np.random.standard_normal((10, 2))plt.figure(figsize=(7,5))
plt.subplot(211)  #两行一列,第一个图
plt.plot(y[:,0], lw = 1.5,label = '1st')
plt.plot(y[:,0], 'ro')
plt.grid(True)
plt.legend(loc = 0) #图例位置自动
plt.axis('tight')
plt.ylabel('value')
plt.title('A simple plot')plt.subplot(212) #两行一列.第二个图
plt.plot(y[:,1],'g', lw = 1.5, label = '2nd')
plt.plot(y[:,1], 'ro')
plt.grid(True)
plt.legend(loc = 0)
plt.xlabel('index')
plt.ylabel('value 2nd')
plt.axis('tight')
plt.show()
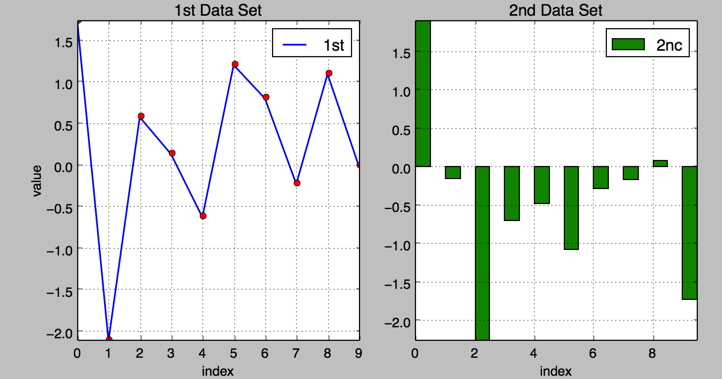
5.左右子图
有时候,选择两个不同的图标类型来可视化数据可能是必要的或者是理想的.利用子图方法:
#!/etc/bin/python
#coding=utf-8
import numpy as np
import matplotlib as mpl
import matplotlib.pyplot as pltnp.random.seed(2000)
y = np.random.standard_normal((10, 2))plt.figure(figsize=(10,5))
plt.subplot(121)  #两行一列,第一个图
plt.plot(y[:,0], lw = 1.5,label = '1st')
plt.plot(y[:,0], 'ro')
plt.grid(True)
plt.legend(loc = 0) #图例位置自动
plt.axis('tight')
plt.xlabel('index')
plt.ylabel('value')
plt.title('1st Data Set')plt.subplot(122)
plt.bar(np.arange(len(y)), y[:,1],width=0.5, color='g',label = '2nc')
plt.grid(True)
plt.legend(loc=0)
plt.axis('tight')
plt.xlabel('index')
plt.title('2nd Data Set')
plt.show()
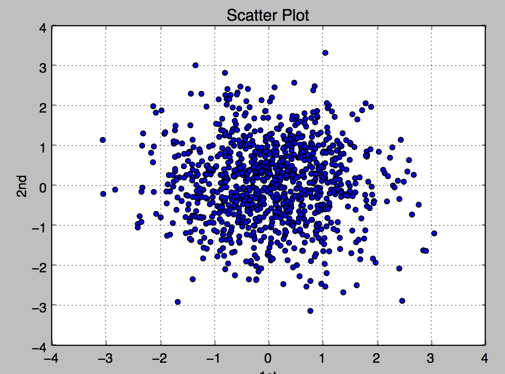
c.其他绘图样式,散点图,直方图等
1.散点图 scatter
#!/etc/bin/python
#coding=utf-8
import numpy as np
import matplotlib as mpl
import matplotlib.pyplot as pltnp.random.seed(2000)
y = np.random.standard_normal((1000, 2))
plt.figure(figsize=(7,5))
plt.scatter(y[:,0],y[:,1],marker='o')
plt.grid(True)
plt.xlabel('1st')
plt.ylabel('2nd')
plt.title('Scatter Plot')
plt.show()
2.直方图 plt.hist
#!/etc/bin/python
#coding=utf-8
import numpy as np
import matplotlib as mpl
import matplotlib.pyplot as pltnp.random.seed(2000)
y = np.random.standard_normal((1000, 2))
plt.figure(figsize=(7,5))
plt.hist(y,label=['1st','2nd'],bins=25)
plt.grid(True)
plt.xlabel('value')
plt.ylabel('frequency')
plt.title('Histogram')
plt.show()
3.直方图 同一个图中堆叠
#!/etc/bin/python
#coding=utf-8
import numpy as np
import matplotlib as mpl
import matplotlib.pyplot as pltnp.random.seed(2000)
y = np.random.standard_normal((1000, 2))
plt.figure(figsize=(7,5))
plt.hist(y,label=['1st','2nd'],color=['b','g'],stacked=True,bins=20)
plt.grid(True)
plt.xlabel('value')
plt.ylabel('frequency')
plt.title('Histogram')
plt.show()

4.箱型图 boxplot
#!/etc/bin/python
#coding=utf-8
import numpy as np
import matplotlib as mpl
import matplotlib.pyplot as pltnp.random.seed(2000)
y = np.random.standard_normal((1000, 2))
fig, ax = plt.subplots(figsize=(7,4))
plt.boxplot(y)plt.grid(True)
plt.setp(ax,xticklabels=['1st' , '2nd'])
plt.xlabel('value')
plt.ylabel('frequency')
plt.title('Histogram')
plt.show()

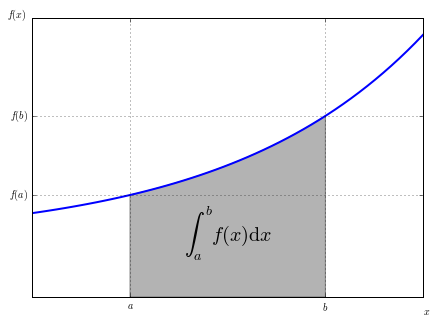
5.绘制函数
from matplotlib.patches import Polygon
import numpy as np
import matplotlib.pyplot as plt#1. 定义积分函数
def func(x):return 0.5 * np.exp(x)+1#2.定义积分区间
a,b = 0.5, 1.5
x = np.linspace(0, 2 )
y = func(x)
#3.绘制函数图形
fig, ax = plt.subplots(figsize=(7,5))
plt.plot(x,y, 'b',linewidth=2)
plt.ylim(ymin=0)
#4.核心, 我们使用Polygon函数生成阴影部分,表示积分面积:
Ix = np.linspace(a,b)
Iy = func(Ix)
verts = [(a,0)] + list(zip(Ix, Iy))+[(b,0)]
poly = Polygon(verts,facecolor='0.7',edgecolor = '0.5')
ax.add_patch(poly)
#5.用plt.text和plt.figtext在图表上添加数学公式和一些坐标轴标签。
plt.text(0.5 *(a+b),1,r"$\int_a^b f(x)\mathrm{d}x$", horizontalalignment ='center',fontsize=20)
plt.figtext(0.9, 0.075,'$x$')
plt.figtext(0.075, 0.9, '$f(x)$')
#6. 分别设置x,y刻度标签的位置。
ax.set_xticks((a,b))
ax.set_xticklabels(('$a$','$b$'))
ax.set_yticks([func(a),func(b)])
ax.set_yticklabels(('$f(a)$','$f(b)$'))
plt.grid(True)
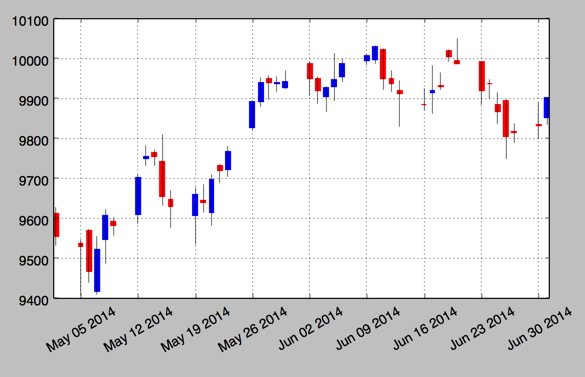
2.金融学图表 matplotlib.finance
1.烛柱图 candlestick
#!/etc/bin/python
#coding=utf-8
import matplotlib.pyplot as plt
import matplotlib.finance as mpf
start = (2014, 5,1)
end = (2014, 7,1)
quotes = mpf.quotes_historical_yahoo('^GDAXI',start,end)
# print quotes[:2]fig, ax = plt.subplots(figsize=(8,5))
fig.subplots_adjust(bottom = 0.2)
mpf.candlestick(ax, quotes, width=0.6, colorup='b',colordown='r')
plt.grid(True)
ax.xaxis_date() #x轴上的日期
ax.autoscale_view()
plt.setp(plt.gca().get_xticklabels(),rotation=30) #日期倾斜
plt.show()
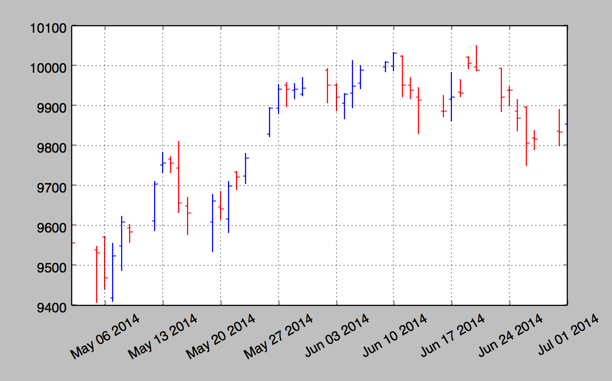
2. plot_day_summary
该函数提供了一个相当类似的图标类型,使用方法和 candlestick 函数相同,使用类似的参数. 这里开盘价和收盘价不是由彩色矩形表示,而是由两条短水平线表示.
#!/etc/bin/python
#coding=utf-8
import matplotlib.pyplot as plt
import matplotlib.finance as mpf
start = (2014, 5,1)
end = (2014, 7,1)
quotes = mpf.quotes_historical_yahoo('^GDAXI',start,end)
# print quotes[:2]fig, ax = plt.subplots(figsize=(8,5))
fig.subplots_adjust(bottom = 0.2)
mpf.plot_day_summary(ax, quotes,  colorup='b',colordown='r')
plt.grid(True)
ax.xaxis_date() #x轴上的日期
ax.autoscale_view()
plt.setp(plt.gca().get_xticklabels(),rotation=30) #日期倾斜
plt.show()
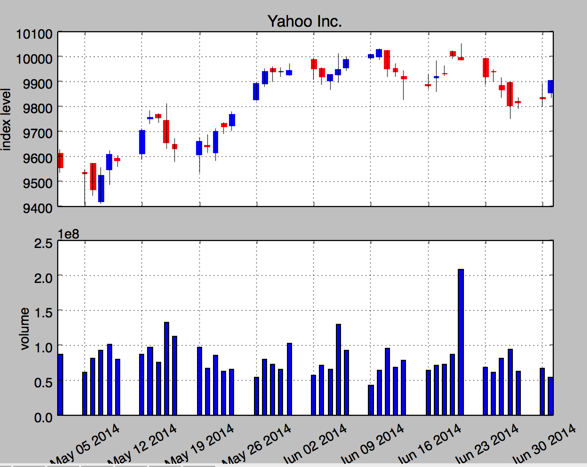
3.股价数据和成交量
#!/etc/bin/python
#coding=utf-8
import matplotlib.pyplot as plt
import numpy as np
import matplotlib.finance as mpf
start = (2014, 5,1)
end = (2014, 7,1)
quotes = mpf.quotes_historical_yahoo('^GDAXI',start,end)
# print quotes[:2]quotes = np.array(quotes)
fig, (ax1, ax2) = plt.subplots(2, sharex=True, figsize=(8,6))
mpf.candlestick(ax1, quotes, width=0.6,colorup='b',colordown='r')
ax1.set_title('Yahoo Inc.')
ax1.set_ylabel('index level')
ax1.grid(True)
ax1.xaxis_date()
plt.bar(quotes[:,0] - 0.25, quotes[:, 5], width=0.5)ax2.set_ylabel('volume')
ax2.grid(True)
ax2.autoscale_view()
plt.setp(plt.gca().get_xticklabels(),rotation=30)
plt.show()
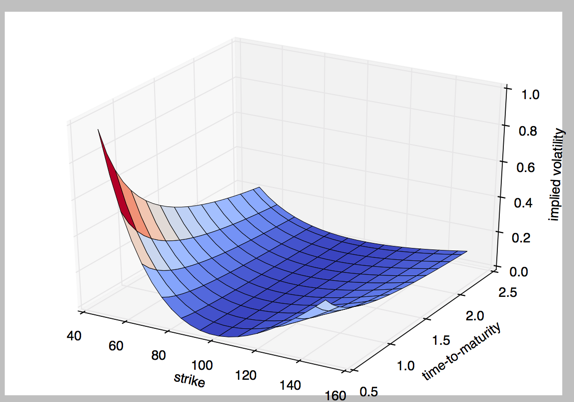
3.3D 绘图
#!/etc/bin/python
#coding=utf-8
import numpy as np
import matplotlib.pyplot as pltstike = np.linspace(50, 150, 24)
ttm = np.linspace(0.5, 2.5, 24)
stike, ttm = np.meshgrid(stike, ttm)
print  stike[:2]iv = (stike - 100) ** 2 / (100 * stike) /ttm
from mpl_toolkits.mplot3d import Axes3D
fig = plt.figure(figsize=(9,6))
ax = fig.gca(projection='3d')
surf = ax.plot_surface(stike, ttm, iv, rstride=2, cstride=2, cmap=plt.cm.coolwarm, linewidth=0.5, antialiased=True)
ax.set_xlabel('strike')
ax.set_ylabel('time-to-maturity')
ax.set_zlabel('implied volatility')plt.show()
岁
相关文章:
Python绘图
1.二维绘图 a. 一维数据集 用 Numpy ndarray 作为数据传入 ply 1. import numpy as np import matplotlib as mpl import matplotlib.pyplot as pltnp.random.seed(1000) y np.random.standard_normal(10) print "y %s"% y x range(len(y)) print "x%s&q…...
)
【独家】华为OD机试 - 第K个最小码值的字母(C 语言解题)
最近更新的博客 华为od 2023 | 什么是华为od,od 薪资待遇,od机试题清单华为OD机试真题大全,用 Python 解华为机试题 | 机试宝典【华为OD机试】全流程解析经验分享,题型分享,防作弊指南)华为od机试,独家整理 已参加机试…...
)
整数反转(python)
题目链接: https://leetcode.cn/problems/reverse-integer/ 题目描述: 给你一个 32 位的有符号整数 x ,返回将 x 中的数字部分反转后的结果。 如果反转后整数超过 32 位的有符号整数的范围 [−231,231−1][−2^{31}, 2^{31} − 1][−231,231…...
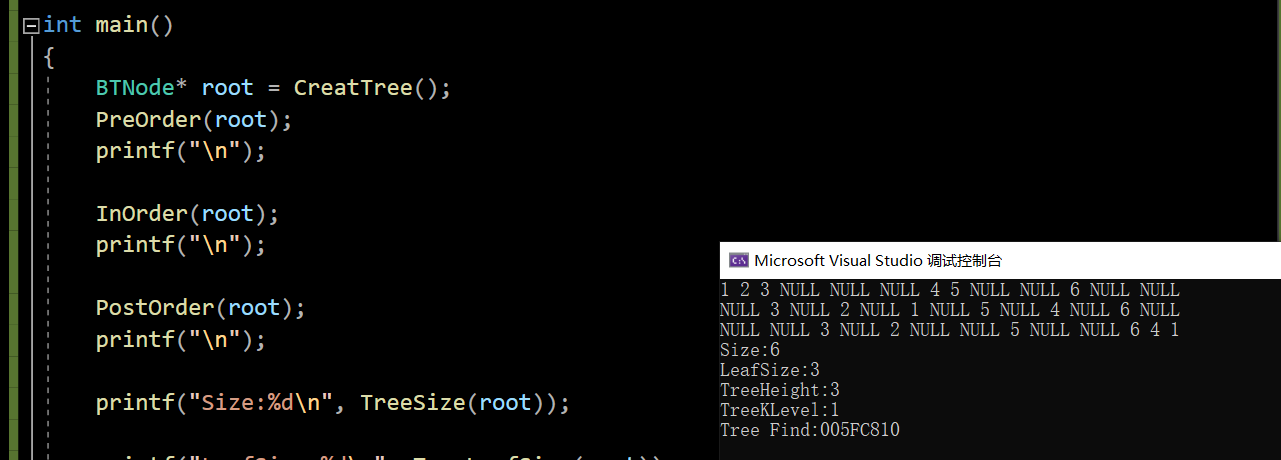
【数据结构】二叉树与堆
文章目录1.树概念及结构1.1树的相关概念1.2树的结构2.二叉树概念及结构2.1相关概念2.2特殊的二叉树2.3二叉树的性质2.4二叉树的存储结构3.二叉树的顺序结构及实现3.1二叉树的顺序结构3.2堆的概念3.3堆的实现Heap.hHeap.c3.4堆的应用3.4.1 堆排序3.4.2 TOP-KOJ题最小K个数4.二叉…...
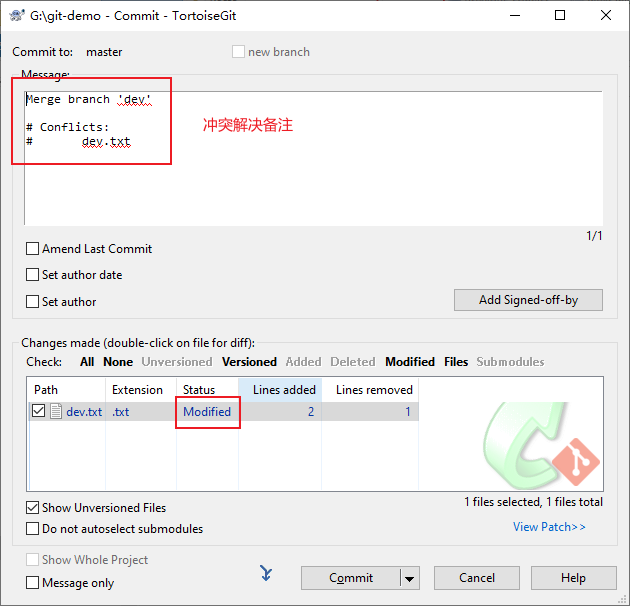
Git图解-常用命令操作-可视化
目录 一、前言 二、初始化仓库 2.1 设置用户名与邮箱 2.2 初始化仓库 三、添加文件 四、查看文件状态 五、查看提交日志 六、查看差异 七、版本回退 八、删除文件 九、分支管理 9.1 创建分支 9.2 切换分支 9.3 查看分支 9.4 合并分支 十、文件冲突 十一、转视…...

C语言-基础了解-20-typedef
typedef 一、typedef C 语言提供了 typedef 关键字,您可以使用它来为类型取一个新的名字。下面的实例为单字节数字定义了一个术语 BYTE: typedef unsigned char BYTE; 在这个类型定义之后,标识符 BYTE 可作为类型 unsigned char 的缩写&…...
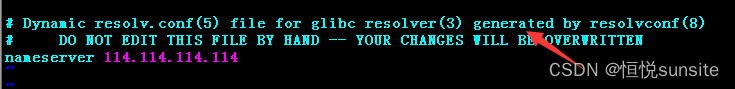
Ubuntu系统升级16.04升级18.04
一、需求说明 作为Linux发行版中的后起之秀,Ubuntu 在短短几年时间里便迅速成长为从Linux初学者到实验室用计算机/服务器都适合使用的发行版,目前官网最新版本是22.04。Ubuntu16.04是2016年4月发行的版本,于2019年4月停止更新维护。很多软件支…...
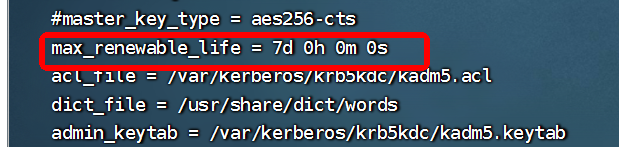
CM6.3.2启用Kerberos(附问题解决)
基础准备支持JCE的jdk重新安装JCE的jdk(已正确配置跳过)删除/usr/java/下面的jdk,然后通过CM->管理->安全->安装Java无限制...重新安装后,配置Java(可选)主机->主机配置->搜java->Java主目录 配置路径主机->所有主机->设置->高级:Java配置Kerberos安…...
)
QML 动画(组合动画)
在QML中,可以把多个动画组合成一个单一的动画。 组合动画的类型: ParallelAnimation 动画同时进行(并行)SequentialAnimation 动画按照顺序执行(顺序执行)注意:将动画分组为“顺序动画”或“…...
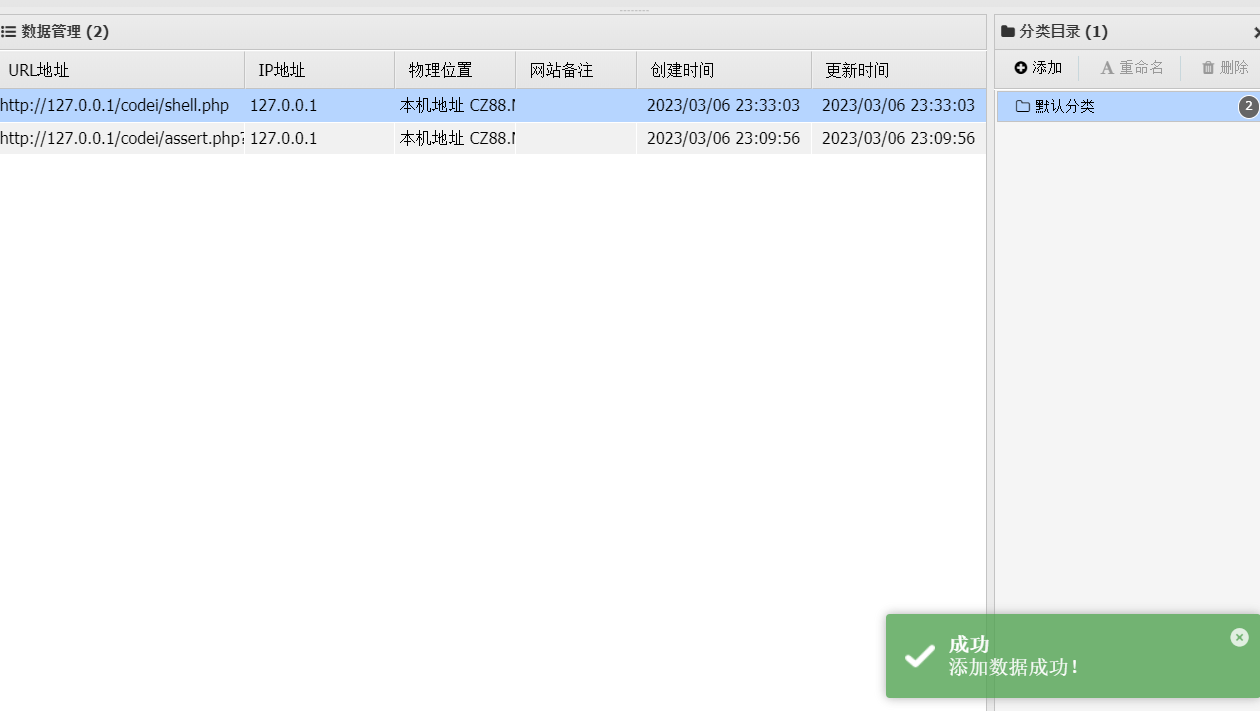
【PHP代码注入】PHP代码注入漏洞
漏洞原理RCE为两种漏洞的缩写,分别为Remote Command/Code Execute,远程命令/代码执行PHP代码注入也叫PHP代码执行(Code Execute)(Web方面),是指应用程序过滤不严,用户可以通过HTTP请求将代码注入到应用中执行。代码注入(代码执行)…...

Python 常用语句同C/C++、Java的不同
文章目录前言1. 数字 int2. 字符 string3. 列表 List4. 元组 tuple5. 字典 dictionary6. 集合 set7. 值类型变量与引用类型变量8. if elif else9. >、<、>、<、、!10. while11. for前言 本篇为本人前段时间的一个简单汇总,这里可能并不齐全,…...

一把火烧掉了苹果摆脱中国制造的幻想,印度制造难担重任
这几年苹果不断推动印度制造,希望摆脱对中国制造的依赖,然而近期苹果在印度的一家代工厂发生大火却证明了苹果的这一计划遭受重大打击,印度制造根本就无法中国制造。一、印度制造屡屡发生幺蛾子苹果推动印度制造已有多年了,然而印…...

常用的 JavaScript 数组 API
以下是一些常用的 JavaScript 数组 API 的代码示例: 1、push() push(): 在数组末尾添加一个或多个元素,返回新的数组长度 const arr [1, 2, 3]; const newLength arr.push(4, 5); console.log(arr); // [1, 2, 3, 4, 5] console.log(newLength); //…...
海思3531a pjsip交叉编译
学习文档: PJSUA2 Documentation — PJSUA2 Documentation 1.0-alpha documentationhttps://www.pjsip.org/docs/book-latest/html/index.html ./configure --prefix/opensource/pjproject-2.12/build3531a \ --host/opt/hisi-linux/x86-arm/arm-hisi…...
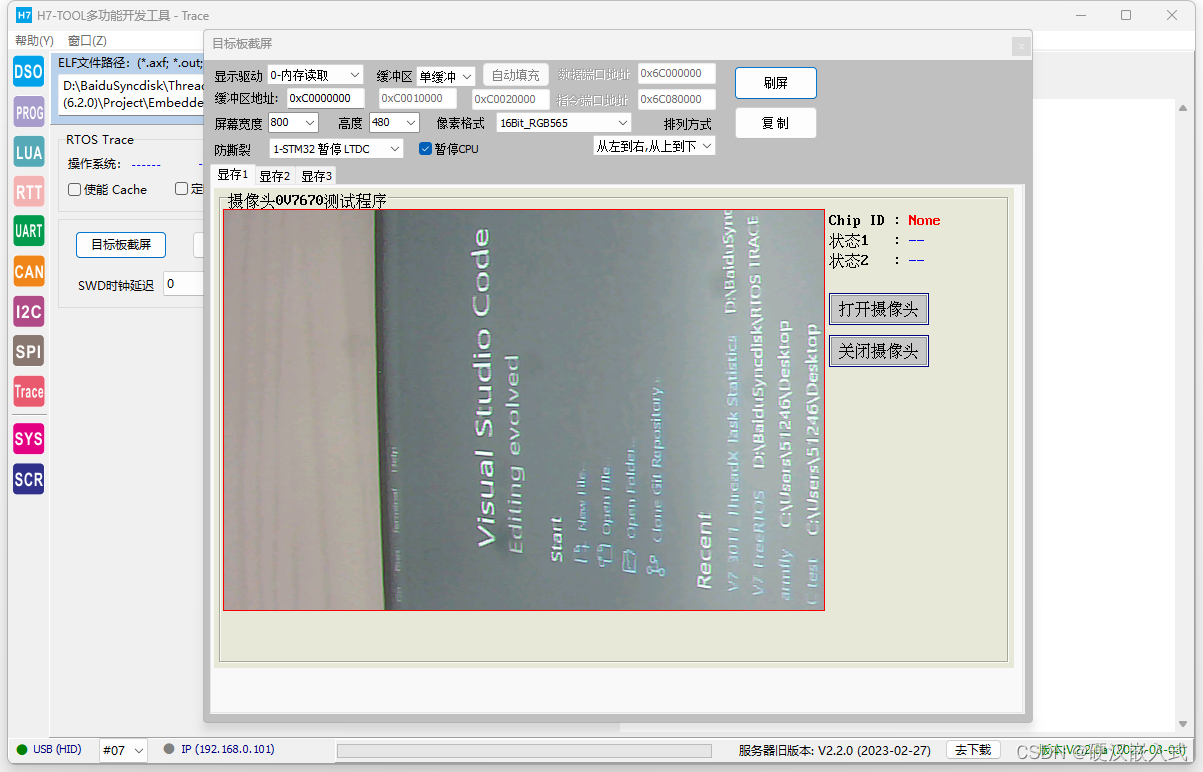
《安富莱嵌入式周报》第305期:超级震撼数码管瀑布,使用OpenAI生成单片机游戏代码的可玩性,120通道逻辑分析仪,复古电子设计,各种运动轨迹函数源码实现
往期周报汇总地址:嵌入式周报 - uCOS & uCGUI & emWin & embOS & TouchGFX & ThreadX - 硬汉嵌入式论坛 - Powered by Discuz! 说明: 谢谢大家的关注,继续为大家盘点上周精彩内容。 视频版: https://www.bi…...
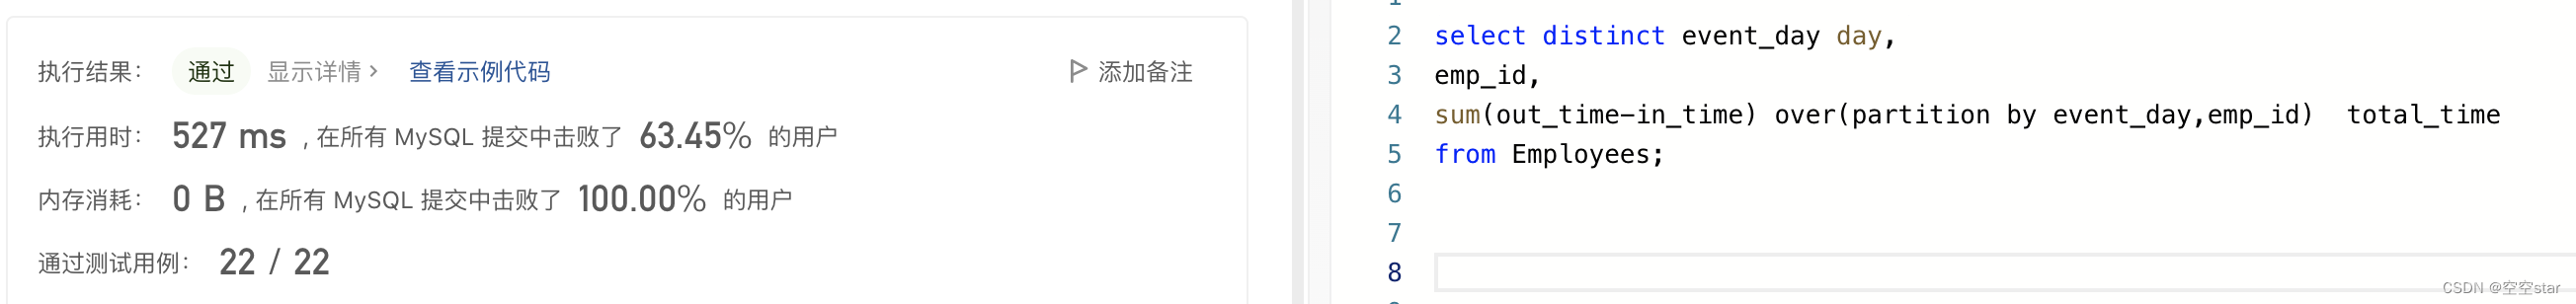
力扣-查找每个员工花费的总时间
大家好,我是空空star,本篇带大家了解一道简单的力扣sql练习题。 文章目录前言一、题目:1741. 查找每个员工花费的总时间二、解题1.正确示范①提交SQL运行结果2.正确示范②提交SQL运行结果3.正确示范③提交SQL运行结果4.正确示范④提交SQL运行…...

企业级信息系统开发学习笔记1.8 基于Java配置方式使用Spring MVC
文章目录零、本节学习目标一、基于Java配置与注解的方式使用Spring MVC1、创建Maven项目 - SpringMVCDemo20202、在pom.xml文件里添加相关依赖3、创建日志属性文件 - log4j.properties4、创建首页文件 - index.jsp5、创建Spring MVC配置类 - SpringMvcConfig6、创建Web应用初始…...

【C语言复习】C语言中的文件操作
C语言中的文件操作写在前面文件操作什么是文件文件的分类文件名文件的操作文件指针文件的打开和关闭文件的顺序读写文件的随机读写fseekftellrewindfeof写在前面 文件操作在C语言部分只是属于了解内容,但是因为它可能会应用在项目中,所以我把它单独写成…...
00后整顿职场,当摸鱼测试员遇上了内卷00后。
在程序员职场上,什么样的人最让人反感呢? 是技术不好的人吗?并不是。技术不好的同事,我们可以帮他。 是技术太强的人吗?也不是。技术很强的同事,可遇不可求,向他学习还来不及呢。 真正让人反感的,是技术平平&…...
程序员的上帝视角(4)——视角
对于开发人员来说,工作都是从评估一个需求开始。我们第一个要解决的问题就是看待需求的视角。视角的不同,得到的设计方案可能是完全不同的。作为一个程序员,不能单单从个人视角来看待问题。而是要尝试从不同角色出发,不停思考。上…...

Lumi Diary:基于OpenClaw Skill的本地AI记忆伴侣设计与实践
1. 项目概述:一个住在你设备里的记忆精灵如果你和我一样,对把生活点滴交给云端总有点不放心,但又渴望有一个能懂你、能帮你把碎片记忆编织成故事的伙伴,那么 Lumi Diary 的出现,可能正是时候。这不是又一个需要你手动打…...

Taotoken如何助力AIGC内容创作团队平衡效果与成本
🚀 告别海外账号与网络限制!稳定直连全球优质大模型,限时半价接入中。 👉 点击领取海量免费额度 Taotoken如何助力AIGC内容创作团队平衡效果与成本 对于专注于短视频脚本、营销文案等AIGC内容生产的团队而言,频繁调用…...

游戏平台硬件开发:定制化与长期稳定的挑战
1. 游戏平台硬件开发的特殊挑战在游戏平台开发领域,硬件选型往往面临着一个两难选择:是采用现成的通用组件(Off The Shelf Components),还是投入高昂成本进行完全定制化开发?过去十年间,我参与过…...

为OpenClaw智能体工作流配置Taotoken作为统一的模型调用后端
🚀 告别海外账号与网络限制!稳定直连全球优质大模型,限时半价接入中。 👉 点击领取海量免费额度 为OpenClaw智能体工作流配置Taotoken作为统一的模型调用后端 对于使用OpenClaw框架构建AI智能体的开发者而言,一个稳定…...

构建个人技能库:从代码片段到可复用技能单元的设计与实践
1. 项目概述:当代码遇上魔法,技能库的构建哲学在软件开发的日常里,我们常常会羡慕那些“魔法师”般的同事:他们似乎总能信手拈来一段代码,优雅地解决一个棘手问题;或者拥有一个私人的“百宝箱”,…...
)
斐讯K3从梅林‘变砖’到官复原职:一个手残党的硬核救砖全记录(附TTL/编程器操作避坑点)
斐讯K3救砖实战:从梅林固件崩溃到完美恢复的完整指南 1. 当路由器变成"砖头":一个普通用户的崩溃瞬间 那是一个普通的周末下午,我正兴冲冲地准备给我的斐讯K3刷上梅林固件,幻想着能获得更强大的功能和更稳定的性能。按照…...

Baetyl开源社区贡献指南:如何参与边缘计算框架的代码与文档开发
Baetyl开源社区贡献指南:如何参与边缘计算框架的代码与文档开发 【免费下载链接】baetyl Extend cloud computing, data and service seamlessly to edge devices. 项目地址: https://gitcode.com/gh_mirrors/ba/baetyl 欢迎来到Baetyl开源边缘计算框架的贡献…...

从平面到立体:ImageToSTL如何让任何图片在3分钟内变成立体可打印模型
从平面到立体:ImageToSTL如何让任何图片在3分钟内变成立体可打印模型 【免费下载链接】ImageToSTL This tool allows you to easily convert any image into a 3D print-ready STL model. The surface of the model will display the image when illuminated from t…...

高性能ai编程工具zed配置deepseek 开启ai agent对话及代码补全
配置ai助手 进入设置页配置deepseek apikey配置代码补全 进入setting->edit pridic -> config.json文件。替换下面内容{"show_edit_predictions": true,// ✅ 代码补全核心配置(关键修改)"edit_predictions": {"provide…...

浏览器扩展革命:5分钟解锁微信网页版全功能访问
浏览器扩展革命:5分钟解锁微信网页版全功能访问 【免费下载链接】wechat-need-web 让微信网页版可用 / Allow the use of WeChat via webpage access 项目地址: https://gitcode.com/gh_mirrors/we/wechat-need-web 还在为微信网页版的各种限制而烦恼吗&…...