如何使用gprof对程序进行性能分析
如何使用gprof对程序进行性能分析
目录
1 gprof概述
2 gprof原理简述
3 gprof使用
3.1 gprof使用简述
3.2 gprof使用示例
4 小结
1 gprof概述
gprof 是 一个 GNU 的程序性能分析工具,可以用于分析C\C++程序的执行性能。gprof工具可以统计出各个函数的调用次数、执行时间、函数调用关系,具体功能可以通过 man gprof进一步了解。通常该工具在大多数linux内核的发行版本中会在你安装C/C++编译器的同时默认安装上。
2 gprof原理简述
通过在编译、链接的时候使用 -pg 选项,就能够控制gcc/g++ 编译器在程序的每个函数中插入插桩函数,从而跟踪目标函数的执行时间、调用关系(通过函数调用堆栈查找)、执行次数等信息,并将相关数据保存到 gmon.out 文件中。
【注意】: 必须是编译和链接的时候都要添加 -pg 参数。并且目标程序不能使用 strip 命令去除符号表,否则 gprof 工具无法正常处理 gmon.out 到 profile.txt文件。
3 gprof使用
3.1 gprof使用简述
使用cmake,在CMakeList.txt中添加
SET(CMAKE_CXX_FLAGS "${CMAKE_CXX_FLAGS} -pg")
SET(CMAKE_C_FLAGS "${CMAKE_C_FLAGS} -pg")
SET(CMAKE_EXE_LINKER_FLAGS "${CMAKE_EXE_LINKER_FLAGS} -pg")
SET(CMAKE_SHARED_LINKER_FLAGS "${CMAKE_SHARED_LINKER_FLAGS} -pg")
使用make,在Makefile中设置
CFLAGS += -pg
CPPFLAGS += -pg
LDFLAGS += -pg
b、 编译后正常运行程序
.testApp arg1 arg2
【注意】 运行程序后,要程序正常退出,才能正常生成 gmon.out 文件;在此步骤中程序是可以带命令行参数执行的。
c、 分析、收集数据
gprof testApp gmon.out > profile.txt
【注意】 在此步骤中,目标程序如果是带参的,此步骤不可以填入命令行参数。
d、 分析数据图形化
gprof2dot -e0 -n0 profile.txt > profile.dot
dot profile.dot -Tpng -o profile.png
【说明】 在此步骤中,需要通过 gprof2dot 和 dot工具将结果图形化,方便查看。
3.2 gprof使用示例
a、 clone s_log_safe项目源码
git clone https://github.com/smallerxuan/s_log_safe.gitcd s_log_safetree
clone完成后进入路径,能看到如下的目录结构:

b、 修改Makefile文件
gedit ./Makefile
用编辑器打开 Makefile文件,修改 FLAGS_BASE 关闭O2优化,添加 -pg 选项;给 LDFLAGS 追加 -pg;注释 strip 调用。


c、 调整测试用例并编译项目
gedit ./main.c
用编辑器打开 main.c 文件,对测试程序进行简单修改,不然测试程序不会自然结束。
#include <stdio.h>
#include "s_log_safe.h"static int test_mark = 8;void* thread_1_exec(void* arg)
{int* count =  (int*)arg;s_safe_tag("thread_1", S_LOG_SAFE_OPT_DEBUG);do {s_log_safe_a("%s %d","测试1",*count);usleep(5000);} while (*count -= 1);test_mark -= 1;return s_log_safe_null;
}void* thread_2_exec(void* arg)
{int* count =  (int*)arg;s_safe_tag("thread_2", S_LOG_SAFE_OPT_DEBUG);do {s_log_safe_v("%s %d","测试2",*count);usleep(5000);} while (*count -= 1);test_mark -= 1;return s_log_safe_null;
}void* thread_3_exec(void* arg)
{int* count =  (int*)arg;s_safe_tag("thread_3", S_LOG_SAFE_OPT_DEBUG);do {s_log_safe_e("%s %d","测试3",*count);usleep(5000);} while (*count -= 1);test_mark -= 1;return s_log_safe_null;
}void* thread_4_exec(void* arg)
{int* count =  (int*)arg;s_safe_tag("thread_4", S_LOG_SAFE_OPT_DEBUG);do {s_log_safe_w("%s %d","测试4",*count);usleep(5000);} while (*count -= 1);test_mark -= 1;return s_log_safe_null;
}void* thread_5_exec(void* arg)
{int* count =  (int*)arg;s_safe_tag("thread_5", S_LOG_SAFE_OPT_DEBUG);do {s_log_safe_t("%s %d","测试5",*count);usleep(5000);} while (*count -= 1);test_mark -= 1;return s_log_safe_null;
}void* thread_6_exec(void* arg)
{int* count =  (int*)arg;s_safe_tag("thread_6", S_LOG_SAFE_OPT_DEBUG);do {s_log_safe_i("%s %d","测试6",*count);usleep(5000);} while (*count -= 1);test_mark -= 1;return s_log_safe_null;
}void* thread_7_exec(void* arg)
{int* count =  (int*)arg;s_safe_tag("thread_7", S_LOG_SAFE_OPT_TRACE);do {s_log_safe_d("%s %d","测试7",*count);if((*count)%8 == 0) {s_safe_tag_log_level_limit_set(S_LOG_SAFE_OPT_DEBUG);} else {s_safe_tag_log_level_limit_set(S_LOG_SAFE_OPT_TRACE);}usleep(5000);} while (*count -= 1);test_mark -= 1;return s_log_safe_null;
}void* thread_main_exec(void* arg)
{int count = 0;unsigned int log_safe_pool_cap = 0;unsigned int log_safe_pool_used = 0;s_safe_tag("main", S_LOG_SAFE_OPT_DEBUG);log_safe_pool_cap = s_log_safe_output_pool_cap_get();while(test_mark > 1) {log_safe_pool_used = s_log_safe_output_pool_used_get();s_log_safe_i("%s log_safe_pool_cap:%d log_safe_pool_used:%d count:%d","main", log_safe_pool_cap, log_safe_pool_used, count++);usleep(5000);}test_mark -= 1;return s_log_safe_null;
}int main(void)
{int                  ret = 0;s_log_safe_thread_t* s_log_safe_thread_1_p;s_log_safe_thread_t* s_log_safe_thread_2_p;s_log_safe_thread_t* s_log_safe_thread_3_p;s_log_safe_thread_t* s_log_safe_thread_4_p;s_log_safe_thread_t* s_log_safe_thread_5_p;s_log_safe_thread_t* s_log_safe_thread_6_p;s_log_safe_thread_t* s_log_safe_thread_7_p;s_log_safe_thread_t* s_log_safe_thread_main_p;int                  count_1 = 77;int                  count_2 = 66;int                  count_3 = 55;int                  count_4 = 44;int                  count_5 = 33;int                  count_6 = 22;int                  count_7 = 11;ret = s_log_safe_init();if(ret != 0) {return 0;}s_log_safe_thread_7_p = s_log_safe_thread_create(thread_main_exec, (void*)s_log_safe_null, "", S_LOG_SAFE_THREAD_PRIORITY, 1024);s_log_safe_thread_1_p = s_log_safe_thread_create(thread_1_exec, (void*)&count_1, "", 10, 1024);s_log_safe_thread_2_p = s_log_safe_thread_create(thread_2_exec, (void*)&count_2, "", 10, 1024);s_log_safe_thread_3_p = s_log_safe_thread_create(thread_3_exec, (void*)&count_3, "", 12, 1024);s_log_safe_thread_4_p = s_log_safe_thread_create(thread_4_exec, (void*)&count_4, "", 12, 1024);s_log_safe_thread_5_p = s_log_safe_thread_create(thread_5_exec, (void*)&count_5, "", 11, 1024);s_log_safe_thread_6_p = s_log_safe_thread_create(thread_6_exec, (void*)&count_6, "", 11, 1024);s_log_safe_thread_7_p = s_log_safe_thread_create(thread_7_exec, (void*)&count_7, "", 10, 1024);while(test_mark != 0) {sleep(1);}return 0;
}
修改完成后运行make命令编译测试程序。
make
运行 make 命令后,会在 ./buld 路径生成目标测试程序。

d、 运测试程序
cd ./build/./s_log_safe_test
切换到 ./build 路径后执行测试程序,通过 ls 会在路径下发现新生成了一个 gmon.out 文件。

e、 分析、收集数据
gprof s_log_safe_test gmon.out > profile.txt
通过该命令,可以在路径下看见导出的分析结果文件 profile.txt。在该文件中,详细的记录了 函数的执行时间、调用关系、执行次数等信息。但是还不是特别方便查看,毕竟看图会更直观。

profile.txt文件的内容如下:
Flat profile:Each sample counts as 0.01 seconds.no time accumulated%   cumulative   self              self     total           time   seconds   seconds    calls  Ts/call  Ts/call  name    0.00      0.00     0.00     2048     0.00     0.00  s_log_safe_mutex_unlock0.00      0.00     0.00     2048     0.00     0.00  s_ring_buffer_unlock0.00      0.00     0.00     1294     0.00     0.00  s_log_safe_mutex_lock0.00      0.00     0.00     1294     0.00     0.00  s_ring_buffer_lock0.00      0.00     0.00      752     0.00     0.00  s_log_safe_mutex_try_lock0.00      0.00     0.00      752     0.00     0.00  s_log_strrchr0.00      0.00     0.00      751     0.00     0.00  s_ring_buffer_try_lock0.00      0.00     0.00      544     0.00     0.00  s_ring_buffer_could_read_num_get0.00      0.00     0.00      383     0.00     0.00  s_log_safe_out0.00      0.00     0.00      376     0.00     0.00  s_log_out_by_printf0.00      0.00     0.00      376     0.00     0.00  s_log_print0.00      0.00     0.00      376     0.00     0.00  s_log_safe_output0.00      0.00     0.00      376     0.00     0.00  s_ring_buffer_read_elements0.00      0.00     0.00      374     0.00     0.00  s_ring_buffer_write_elements0.00      0.00     0.00       78     0.00     0.00  s_log_safe_output_pool_used_get0.00      0.00     0.00        9     0.00     0.00  get_thread_policy0.00      0.00     0.00        9     0.00     0.00  s_log_safe_thread_create0.00      0.00     0.00        2     0.00     0.00  s_log_safe_mutex_create0.00      0.00     0.00        2     0.00     0.00  s_ring_buffer_lock_create0.00      0.00     0.00        1     0.00     0.00  s_log_safe_constructor0.00      0.00     0.00        1     0.00     0.00  s_log_safe_init0.00      0.00     0.00        1     0.00     0.00  s_log_safe_output_pool_cap_get0.00      0.00     0.00        1     0.00     0.00  s_ring_buffer_constructor0.00      0.00     0.00        1     0.00     0.00  s_ring_buffer_element_pool_constructor_malloc%         the percentage of the total running time of the
time       program used by this function.cumulative a running sum of the number of seconds accountedseconds   for by this function and those listed above it.self      the number of seconds accounted for by this
seconds    function alone.  This is the major sort for thislisting.calls      the number of times this function was invoked, ifthis function is profiled, else blank.self      the average number of milliseconds spent in this
ms/call    function per call, if this function is profiled,else blank.total     the average number of milliseconds spent in this
ms/call    function and its descendents per call, if thisfunction is profiled, else blank.name       the name of the function.  This is the minor sortfor this listing. The index shows the location ofthe function in the gprof listing. If the index isin parenthesis it shows where it would appear inthe gprof listing if it were to be printed.Copyright (C) 2012-2015 Free Software Foundation, Inc.Copying and distribution of this file, with or without modification,
are permitted in any medium without royalty provided the copyright
notice and this notice are preserved.Call graph (explanation follows)granularity: each sample hit covers 2 byte(s) no time propagatedindex % time    self  children    called     name0.00    0.00    2048/2048        s_ring_buffer_unlock [2]
[1]      0.0    0.00    0.00    2048         s_log_safe_mutex_unlock [1]
-----------------------------------------------0.00    0.00       2/2048        s_ring_buffer_constructor [23]0.00    0.00     544/2048        s_ring_buffer_could_read_num_get [8]0.00    0.00     750/2048        s_ring_buffer_write_elements [14]0.00    0.00     752/2048        s_ring_buffer_read_elements [13]
[2]      0.0    0.00    0.00    2048         s_ring_buffer_unlock [2]0.00    0.00    2048/2048        s_log_safe_mutex_unlock [1]
-----------------------------------------------0.00    0.00    1294/1294        s_ring_buffer_lock [4]
[3]      0.0    0.00    0.00    1294         s_log_safe_mutex_lock [3]
-----------------------------------------------0.00    0.00     374/1294        s_ring_buffer_write_elements [14]0.00    0.00     376/1294        s_ring_buffer_read_elements [13]0.00    0.00     544/1294        s_ring_buffer_could_read_num_get [8]
[4]      0.0    0.00    0.00    1294         s_ring_buffer_lock [4]0.00    0.00    1294/1294        s_log_safe_mutex_lock [3]
-----------------------------------------------0.00    0.00     752/752         s_ring_buffer_try_lock [7]
[5]      0.0    0.00    0.00     752         s_log_safe_mutex_try_lock [5]
-----------------------------------------------0.00    0.00     752/752         s_log_safe_output [12]
[6]      0.0    0.00    0.00     752         s_log_strrchr [6]
-----------------------------------------------0.00    0.00     375/751         s_ring_buffer_write_elements [14]0.00    0.00     376/751         s_ring_buffer_read_elements [13]
[7]      0.0    0.00    0.00     751         s_ring_buffer_try_lock [7]0.00    0.00     752/752         s_log_safe_mutex_try_lock [5]
-----------------------------------------------0.00    0.00      78/544         s_log_safe_output_pool_used_get [15]0.00    0.00     466/544         s_log_safe_thread_exec_func [36]
[8]      0.0    0.00    0.00     544         s_ring_buffer_could_read_num_get [8]0.00    0.00     544/1294        s_ring_buffer_lock [4]0.00    0.00     544/2048        s_ring_buffer_unlock [2]
-----------------------------------------------0.00    0.00      11/383         thread_7_exec [50]0.00    0.00      22/383         thread_6_exec [49]0.00    0.00      33/383         thread_5_exec [48]0.00    0.00      43/383         thread_4_exec [47]0.00    0.00      55/383         thread_3_exec [46]0.00    0.00      66/383         thread_2_exec [45]0.00    0.00      76/383         thread_1_exec [44]0.00    0.00      77/383         thread_main_exec [51]
[9]      0.0    0.00    0.00     383         s_log_safe_out [9]0.00    0.00     374/374         s_ring_buffer_write_elements [14]
-----------------------------------------------0.00    0.00     376/376         s_log_print [11]
[10]     0.0    0.00    0.00     376         s_log_out_by_printf [10]
-----------------------------------------------0.00    0.00     376/376         s_log_safe_output [12]
[11]     0.0    0.00    0.00     376         s_log_print [11]0.00    0.00     376/376         s_log_out_by_printf [10]
-----------------------------------------------0.00    0.00     376/376         s_log_safe_thread_exec_func [36]
[12]     0.0    0.00    0.00     376         s_log_safe_output [12]0.00    0.00     752/752         s_log_strrchr [6]0.00    0.00     376/376         s_ring_buffer_read_elements [13]0.00    0.00     376/376         s_log_print [11]
-----------------------------------------------0.00    0.00     376/376         s_log_safe_output [12]
[13]     0.0    0.00    0.00     376         s_ring_buffer_read_elements [13]0.00    0.00     752/2048        s_ring_buffer_unlock [2]0.00    0.00     376/751         s_ring_buffer_try_lock [7]0.00    0.00     376/1294        s_ring_buffer_lock [4]
-----------------------------------------------0.00    0.00     374/374         s_log_safe_out [9]
[14]     0.0    0.00    0.00     374         s_ring_buffer_write_elements [14]0.00    0.00     750/2048        s_ring_buffer_unlock [2]0.00    0.00     375/751         s_ring_buffer_try_lock [7]0.00    0.00     374/1294        s_ring_buffer_lock [4]
-----------------------------------------------0.00    0.00      78/78          thread_main_exec [51]
[15]     0.0    0.00    0.00      78         s_log_safe_output_pool_used_get [15]0.00    0.00      78/544         s_ring_buffer_could_read_num_get [8]
-----------------------------------------------0.00    0.00       9/9           s_log_safe_thread_create [17]
[16]     0.0    0.00    0.00       9         get_thread_policy [16]
-----------------------------------------------0.00    0.00       1/9           s_log_safe_init [21]0.00    0.00       8/9           main [30]
[17]     0.0    0.00    0.00       9         s_log_safe_thread_create [17]0.00    0.00       9/9           get_thread_policy [16]
-----------------------------------------------0.00    0.00       2/2           s_ring_buffer_lock_create [19]
[18]     0.0    0.00    0.00       2         s_log_safe_mutex_create [18]
-----------------------------------------------0.00    0.00       2/2           s_ring_buffer_constructor [23]
[19]     0.0    0.00    0.00       2         s_ring_buffer_lock_create [19]0.00    0.00       2/2           s_log_safe_mutex_create [18]
-----------------------------------------------0.00    0.00       1/1           s_log_safe_init [21]
[20]     0.0    0.00    0.00       1         s_log_safe_constructor [20]0.00    0.00       1/1           s_ring_buffer_constructor [23]
-----------------------------------------------0.00    0.00       1/1           main [30]
[21]     0.0    0.00    0.00       1         s_log_safe_init [21]0.00    0.00       1/1           s_log_safe_constructor [20]0.00    0.00       1/9           s_log_safe_thread_create [17]
-----------------------------------------------0.00    0.00       1/1           thread_main_exec [51]
[22]     0.0    0.00    0.00       1         s_log_safe_output_pool_cap_get [22]
-----------------------------------------------0.00    0.00       1/1           s_log_safe_constructor [20]
[23]     0.0    0.00    0.00       1         s_ring_buffer_constructor [23]0.00    0.00       2/2           s_ring_buffer_lock_create [19]0.00    0.00       2/2048        s_ring_buffer_unlock [2]0.00    0.00       1/1           s_ring_buffer_element_pool_constructor_malloc [24]
-----------------------------------------------0.00    0.00       1/1           s_ring_buffer_constructor [23]
[24]     0.0    0.00    0.00       1         s_ring_buffer_element_pool_constructor_malloc [24]
-----------------------------------------------This table describes the call tree of the program, and was sorted bythe total amount of time spent in each function and its children.Each entry in this table consists of several lines.  The line with theindex number at the left hand margin lists the current function.The lines above it list the functions that called this function,and the lines below it list the functions this one called.This line lists:index	A unique number given to each element of the table.Index numbers are sorted numerically.The index number is printed next to every function name soit is easier to look up where the function is in the table.% time	This is the percentage of the `total' time that was spentin this function and its children.  Note that due todifferent viewpoints, functions excluded by options, etc,these numbers will NOT add up to 100%.self	This is the total amount of time spent in this function.children	This is the total amount of time propagated into thisfunction by its children.called	This is the number of times the function was called.If the function called itself recursively, the numberonly includes non-recursive calls, and is followed bya `+' and the number of recursive calls.name	The name of the current function.  The index number isprinted after it.  If the function is a member of acycle, the cycle number is printed between thefunction's name and the index number.For the function's parents, the fields have the following meanings:self	This is the amount of time that was propagated directlyfrom the function into this parent.children	This is the amount of time that was propagated fromthe function's children into this parent.called	This is the number of times this parent called thefunction `/' the total number of times the functionwas called.  Recursive calls to the function are notincluded in the number after the `/'.name	This is the name of the parent.  The parent's indexnumber is printed after it.  If the parent is amember of a cycle, the cycle number is printed betweenthe name and the index number.If the parents of the function cannot be determined, the word`<spontaneous>' is printed in the `name' field, and all the otherfields are blank.For the function's children, the fields have the following meanings:self	This is the amount of time that was propagated directlyfrom the child into the function.children	This is the amount of time that was propagated from thechild's children to the function.called	This is the number of times the function calledthis child `/' the total number of times the childwas called.  Recursive calls by the child are notlisted in the number after the `/'.name	This is the name of the child.  The child's indexnumber is printed after it.  If the child is amember of a cycle, the cycle number is printedbetween the name and the index number.If there are any cycles (circles) in the call graph, there is anentry for the cycle-as-a-whole.  This entry shows who called thecycle (as parents) and the members of the cycle (as children.)The `+' recursive calls entry shows the number of function calls thatwere internal to the cycle, and the calls entry for each member shows,for that member, how many times it was called from other members ofthe cycle.Copyright (C) 2012-2015 Free Software Foundation, Inc.Copying and distribution of this file, with or without modification,
are permitted in any medium without royalty provided the copyright
notice and this notice are preserved.Index by function name[16] get_thread_policy (s_log_safe_platform.c) [1] s_log_safe_mutex_unlock [8] s_ring_buffer_could_read_num_get[10] s_log_out_by_printf     [9] s_log_safe_out         [24] s_ring_buffer_element_pool_constructor_malloc[11] s_log_print            [12] s_log_safe_output (s_log_safe.c) [4] s_ring_buffer_lock[20] s_log_safe_constructor (s_log_safe.c) [22] s_log_safe_output_pool_cap_get [19] s_ring_buffer_lock_create[21] s_log_safe_init        [15] s_log_safe_output_pool_used_get [13] s_ring_buffer_read_elements[18] s_log_safe_mutex_create [17] s_log_safe_thread_create [7] s_ring_buffer_try_lock[3] s_log_safe_mutex_lock   [6] s_log_strrchr           [2] s_ring_buffer_unlock[5] s_log_safe_mutex_try_lock [23] s_ring_buffer_constructor [14] s_ring_buffer_write_elements
f、 生成调用图
gprof2dot -e0 -n0 profile.txt > profile.dot
dot profile.dot -Tpng -o profile.png
通过 gprof2dot 和 dot 工具能够将 profile.txt 文件转换为 更直观的 图片。


如果没有安装 gprof2dot 和 dot 工具,可以通过以下命令进行安装:
sudo apt-get install graphvizpip3 install gprof2dot
g、 查看调用图
通过上述操作,最终生成了 profile.png 文件,最终的调用图如下图所示:

从该图中,就比较直观的看到了调用流程和调用次数
4 小结
相关文章:
如何使用gprof对程序进行性能分析
如何使用gprof对程序进行性能分析 目录 1 gprof概述 2 gprof原理简述 3 gprof使用 3.1 gprof使用简述 3.2 gprof使用示例 4 小结 1 gprof概述 gprof 是 一个 GNU 的程序性能分析工具,可以用于分析C\C程序的执行性能。gprof工具可以统计出各个函数的调用次数、执…...

四川汇聚荣科技有限公司靠谱吗?
在如今这个信息爆炸的时代,了解一家公司是否靠谱对于消费者和合作伙伴来说至关重要。四川汇聚荣科技有限公司作为一家位于中国西部地区的企业,自然也受到了人们的关注。那么,这家公司究竟如何呢?接下来,我们将从多个角度进行深入…...

可灵王炸更新,图生视频、视频续写,最长可达3分钟!Runway 不香了 ...
现在视频大模型有多卷? Runway 刚在6月17号 发布Gen3 ,坐上王座没几天; 可灵就在6月21日中午,重新夺回了王座!发布了图生视频功能,视频续写功能! 一张图概括: 二师兄和团队老师第一…...

oracle中使用临时表GLOBAL TEMPORARY TABLE
需要在存储过程中返回一个临时结果集,这个结果集又是多个语句通过循环查询出来的,这时候就想到了将结果插入到临时表中,然后返回临时表的数据的思路,于是有了以下操作: 1.创建临时表 -- Create table create global …...

Gradio入门—快速开始
目录 安装构建您的第一个演示分享您的演示核心 Gradio 课程聊天机器人gr.ChatInterface自定义演示gr.BlocksGradio Python 和 JavaScript 生态系统 Gradio 是一个开源 Python 软件包,可让您快速为机器学习模型、API 或任何任意 Python 函数构建演示或 Web 应用程序。…...
AOP应用之系统操作日志
本文演示下如何使用AOP,去实现系统操作日志功能。 实现步骤 引入AOP包 <dependency><groupId>org.springframework.boot</groupId><artifactId>spring-boot-starter-aop</artifactId><version>2.6.6</version></de…...

海外云手机自动化管理,高效省力解决方案
不论是企业还是个人,对于海外社媒的营销都是需要自动化管理的,因为自动化管理不仅省时省力,而且还节约成本; 海外云手机的自动化管理意味着什么?那就是企业无需再投入大量的人力和时间去逐一操作和监控每一台设备。 通…...
使用specify进行时序仿真)
后仿真中的 《specify/endspecify block》之(5)使用specify进行时序仿真
前面我们学习了specify...endspecify 具体是什么东西。今天,我们使用specify block 中定义的延时,来进行一次仿真。看看到底是背后如何运转的呢。 一 基本例子 一个用 specify 指定延迟的与门逻辑描述如下: module and_gate(output Z,input A, B);assign Z = A & …...

win10/11磁盘管理
win10/11磁盘管理 合并磁盘分区的前提是你的两个磁盘区域是相邻的,比如如下: 如果需要吧这个磁盘进行分解,你可以选择压缩一部分磁盘或者是直接删除卷 我这里的话,因为压缩出来的卷和C盘好像是不相邻的(我之前做过&…...

【昇思初学入门】第四天打卡
数据变换Transforms 心得体会 MindSpore提供了丰富的数据变换工具,针对图像数据可以使用如Rescale、Normalize和HWC2CHW等,且使用Compose类允许我们定义一个变换序列,并将它们作为一个整体应用到数据上。 composed transforms.Compose([v…...
禁用/屏蔽 Chrome 默认快捷键
Chrome 有一些内置的快捷键,但是它并没有像其他软件一样提供管理快捷键的界面。在某些时候,当我们因为个人需求希望禁用 Chrome 某些快捷键时,又无从下手。 好在有开发者开发了 Chrome 插件,可以禁用 Chrome 快捷键的插件&#x…...
移动端+PC端应用模式的智慧城管综合执法办案平台源码,案件在线办理、当事人信用管理、文书电子送达、沿街店铺分析
城市管理综合执法管理平台实现执法办案、业务全流程在线办理,依托移动端PC端的“两端”应用模式,保障能够通过信息化手段进行日常的执法办案工作,强化执法监督功能。提供了案件在线办理、当事人信用管理、文书电子送达、沿街店铺分析等功能&a…...

AI音乐大模型时代:版权归属与创意产业的新生长点
AI在创造还是毁掉音乐? 简介:最近一个月,轮番上线的音乐大模型,一举将素人生产音乐的门槛降到了最低,并掀起了音乐圈会不会被AI彻底颠覆的讨论。短暂的兴奋后,AI产品的版权归属于谁,创意产业要…...

C++函数作为参数
C++函数作为参数 在C++中,函数作为另一个函数的参数是非常常见的做法,特别是在处理回调函数和泛型编程时。我们展示了如何在C++中将函数作为参数传递给另一个函数,包括普通函数、std::function 和 std::bind、lambda表达式以及类成员函数。每种方法都有其独特的优势,可以根…...
考前刷题练手感(北航期末往年数据结构编程题)
本次因为是考前一天极速刷题,所以没有讲解,若有问题可私信。 目录 一、 查找同时空人员二、 老鼠回家-无回路三、函数调⽤关系四、东二食堂模拟五、栈帧 一、 查找同时空人员 【问题描述】 假设一共有6个手机基站,都具有记录手机连接基站状…...

Android记录9--实现转盘效果
自定义View /2013.10.16_TurnPlate_Demo/src/com/wwj/turnplate/TurnPlateView.java package com.wwj.turnplate; import android.content.Context; import android.content.res.Resources; import android.graphics.Bitmap; import android.graphics.BitmapFactory; im…...

【Oracle APEX开发小技巧1】转换类型实现显示小数点前的 0 以 及常见类型转换
在 apex 交互式式网格中,有一数值类型为 NUMBER,保留小数点后两位的项,在 展示时小数点前的 0 不显示。 效果如下: 转换前: m.WEIGHT_COEFFICIENT 解决方案: 将 NUMBER(20,2…...
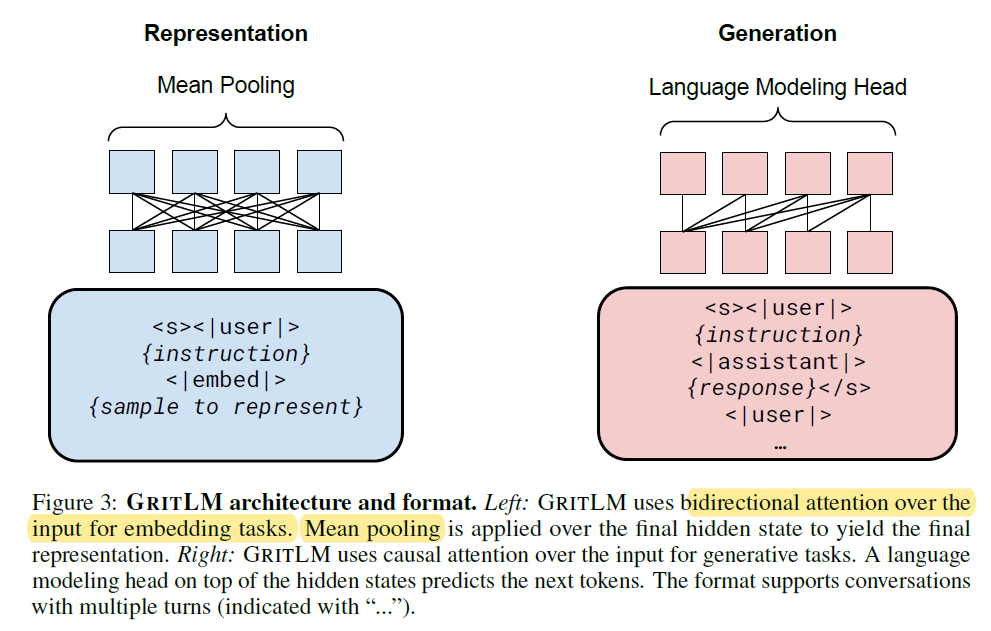
GRIT论文阅读笔记
一篇试图统一生成任务和编码任务的工作,就是把只能完成生成任务的GPT改成既能生成又能encode。思路其实很简单,就是在输入的时候添加instruction tokens来指引模型做representation还是generation,然后各自算损失。representation任务用的是d…...

1980python个性化电影推荐管理系统mysql数据库Django结构layUI布局elasticsearch存储计算机软件工程网页
一、源码特点 python Django个性化电影推荐管理系统是一套完善的web设计系统mysql数据库 利用elasticsearch存储浏览数据 ,对理解python编程开发语言有帮助,系统具有完整的源代码和数据库,系统主要采用B/S模式开发。 开发环境pycharm…...
基于IDEA的Maven(依赖介绍和引用)
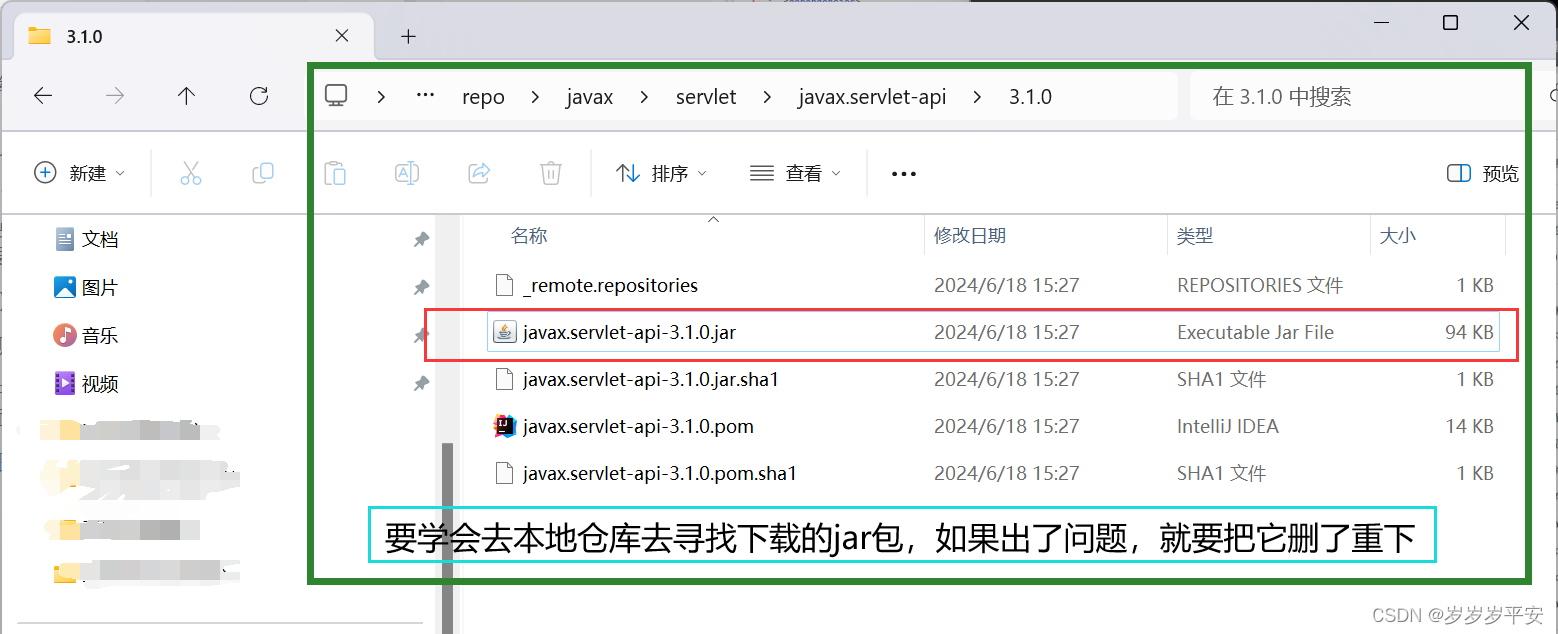
如何通过一个坐标信息(依赖)去引用 ,某个"jar 包" 会在这篇博客进行学习。 目录 一、学习开始 (0)项目的结构组成和 "pom.xml" 文件内容。 (1)首先需要一个标签…...

【Python内存管理终极指南】:20年专家亲授智能体内存优化的5大架构设计图与3个致命误区
第一章:Python智能体内存管理的核心原理与演进脉络 Python的内存管理并非由开发者手动控制,而是由解释器内置的“智能体”协同完成——它融合了引用计数、循环垃圾回收(GC)和内存池机制三重策略,在运行时动态权衡效率与…...

FedProto:跨异构客户端的原型联邦学习实践指南
1. 从零理解FedProto的核心思想 第一次听说FedProto时,我正被一个医疗影像分析项目搞得焦头烂额。五家医院的数据就像五个方言区——同样的病症在CT影像上呈现的特征分布天差地别。传统联邦学习就像让这些医院用各自的方言写报告,再强行翻译成标准语&…...

数据工程合规检查自动化:构建完整解决方案的10个关键步骤
数据工程合规检查自动化:构建完整解决方案的10个关键步骤 【免费下载链接】data-engineer-handbook Data Engineer Handbook 是一个收集数据工程师学习资料的项目。 - 提供数据工程师所需的知识、工具和资源,帮助数据工程师学习和成长。 - 特点ÿ…...

如何快速掌握React Email Editor:深入理解拖拽邮件编辑器的实现原理
如何快速掌握React Email Editor:深入理解拖拽邮件编辑器的实现原理 【免费下载链接】react-email-editor Drag-n-Drop Email Editor Component for React.js 项目地址: https://gitcode.com/gh_mirrors/re/react-email-editor React Email Editor是一个功能…...

AnotherRedisDesktopManager:让Redis管理变得简单高效的5个理由
AnotherRedisDesktopManager:让Redis管理变得简单高效的5个理由 【免费下载链接】AnotherRedisDesktopManager qishibo/AnotherRedisDesktopManager: Another Redis Desktop Manager 是一款跨平台的Redis桌面管理工具,提供图形用户界面,支持连…...
)
避免踩坑:Unity中Resources.LoadAll的正确使用姿势(含multiple模式Sprite处理)
Unity资源加载进阶:Resources.LoadAll与Sprite图集高效处理指南 在Unity开发中,资源加载是每个项目都无法绕开的核心环节。特别是当处理包含多张小图的Sprite图集时,很多开发者会陷入性能陷阱和功能误区。本文将深入剖析Resources.LoadAll的正…...

告别代码噩梦:用Awesome-Dify-Workflow零代码30分钟实现企业级登录系统
告别代码噩梦:用Awesome-Dify-Workflow零代码30分钟实现企业级登录系统 【免费下载链接】Awesome-Dify-Workflow 分享一些好用的 Dify DSL 工作流程,自用、学习两相宜。 Sharing some Dify workflows. 项目地址: https://gitcode.com/GitHub_Trending/…...
Pixel Fashion Atelier企业应用:支持Webhook回调的自动化素材生成流水线搭建
Pixel Fashion Atelier企业应用:支持Webhook回调的自动化素材生成流水线搭建 1. 项目背景与价值 Pixel Fashion Atelier是一款基于Stable Diffusion与Anything-v5的图像生成工作站,专为企业级素材生产需求设计。传统AI工具往往面临两大挑战:…...

ReAct Agent:新手程序员必看!收藏这款融合推理与行动的AI智能体框架,轻松入门大模型应用开发
ReAct框架通过结合推理与行动,解决了传统提示工程的局限性,构建出能主动思考、决策并执行复杂任务的智能体。本文详细介绍了ReAct的核心设计思想,包括推理模块的动态思考链和错误回溯机制,以及行动模块的工具集成和环境状态感知。…...

高效管理惠普OMEN游戏本:OmenSuperHub全面解析与实战指南
高效管理惠普OMEN游戏本:OmenSuperHub全面解析与实战指南 【免费下载链接】OmenSuperHub 项目地址: https://gitcode.com/gh_mirrors/om/OmenSuperHub OmenSuperHub是一款专为惠普OMEN系列游戏本设计的轻量级系统管理工具,它通过替代原厂Omen Ga…...