How to Describe Figures in a Research Article
How to Describe Figures in a Research Article
| Date | Author | Version | Note |
|---|---|---|---|
| 2024.07.10 | Dog Tao | V1.0 | Finish the document. |
文章目录
- How to Describe Figures in a Research Article
- General Guidelines
- Detailed Descriptions
- Common Describing Phrases
Effective communication of data and results is crucial in research articles. Figures play a significant role in visually conveying complex information. To describe figures clearly and concisely, follow these guidelines and examples.
General Guidelines
-
Introduce the Figure: Always introduce the figure before referring to it.
- As depicted in Figure 1, the results of the simulation show a steady increase in temperature as the reaction proceeds.
- Figure 2 illustrates the distribution of particle sizes in the sample, revealing a bimodal pattern.
- As shown in Figure 3, the new algorithm significantly reduces processing time compared to the baseline method.
-
Be Specific: Describe what the figure shows specifically. Mention important details like axes, trends, and key data points.
- Figure 4 shows the stress-strain curve for the composite material. The curve highlights the material’s high tensile strength and ductility.
- As illustrated in Figure 5, the graph plots the monthly sales data for the past year, showing a peak in December.
- Figure 6 presents the absorption spectra of the synthesized nanoparticles, indicating strong absorption in the UV-visible range.
-
Relate to the Text: Connect the figure to the content of your text. Explain how the figure supports or contradicts your argument or findings.
- As shown in Figure 7, the increase in enzyme activity correlates with the rise in substrate concentration, supporting our hypothesis of substrate-induced activation.
- Figure 8 demonstrates the effect of different pH levels on cell viability, which aligns with our previous findings that cells thrive in slightly acidic conditions.
- As depicted in Figure 9, the data supports the theory that higher temperatures accelerate the reaction rate, consistent with the Arrhenius equation.
-
Use Consistent Terminology: Ensure that the terminology used in the figure description matches the terminology in the figure and throughout the text.
- Figure 10 shows the photocurrent response of the solar cells under different illumination intensities. (The term ‘photocurrent’ is consistently used throughout the text to describe the current generated by the cells when exposed to light)
- As shown in Figure 11, the XRD patterns of the samples match the expected peaks for TiO2. (The term ‘XRD patterns’ is used in both the figure and the text to maintain clarity)
- Figure 12 illustrates the growth curve of the bacteria. (Using the term ‘growth curve’ consistently in the discussion to describe the change in bacterial population over time)
-
Refer to Sub-figures Clearly: If a figure has multiple parts (e.g., Figure 3(a) and (b)), refer to each part clearly.
- As illustrated in Figure 13(a) and (b), the SEM images show the surface morphology of the untreated and treated samples, respectively. Figure 13(a) reveals a rough surface, while Figure 13(b) shows a smoother texture after treatment.
- Figure 14(a) displays the cyclic voltammogram of the electrode in the absence of analyte, and Figure 14(b) shows the voltammogram in the presence of analyte. The increase in peak current in Figure 14(b) indicates successful detection.
- As seen in Figure 15(a) and (b), the temperature profiles for both the control and experimental groups are plotted. Figure 15(a) depicts the control group, and Figure 15(b) shows the experimental group exposed to the new treatment.
Detailed Descriptions
-
Introducing a Simple Figure
Example:
As shown in Figure 1, the temperature variation over time indicates a clear seasonal pattern.
Description:
- Introduction: “As shown in Figure 1”
- Specific Detail: “the temperature variation over time”
- Key Point: “indicates a clear seasonal pattern”
-
Describing a Complex Figure
Example:
Figure 2 demonstrates the correlation between the concentration of hydrogen and the sensor’s response time. The linear trend observed suggests a strong positive correlation.
Description:
- Introduction: “Figure 2 demonstrates”
- Specific Detail: “the correlation between the concentration of hydrogen and the sensor’s response time”
- Key Point: “The linear trend observed suggests a strong positive correlation”
-
Describing Figures with Multiple Panels
Example:
As illustrated in Figure 3(a) and (b), the XRD patterns of the synthesized materials show distinct peaks, indicating successful formation of the desired phase. Figure 3(a) shows the pattern for TiO2, while Figure 3(b) displays the pattern for Ti3C2.
Description:
- Introduction: “As illustrated in Figure 3(a) and (b)”
- Specific Detail: “the XRD patterns of the synthesized materials show distinct peaks”
- Key Points:
- Figure 3(a): “shows the pattern for TiO2”
- Figure 3(b): “displays the pattern for Ti3C2”
-
Highlighting Key Data Points
Example:
As depicted in Figure 4, the efficiency of the perovskite solar cells increased significantly with the addition of the frictional electric nanogenerator, reaching a peak efficiency of 18%.
Description:
- Introduction: “As depicted in Figure 4”
- Specific Detail: “the efficiency of the perovskite solar cells increased significantly with the addition of the frictional electric nanogenerator”
- Key Point: “reaching a peak efficiency of 18%”
-
Comparing Data from Multiple Figures
Example:
Figure 5 and Figure 6 compare the response times of the sensor at different hydrogen concentrations and operating temperatures, respectively. While Figure 5 shows a decrease in response time with increasing hydrogen concentration, Figure 6 indicates an optimal operating temperature range between 200°C and 300°C for the best sensor performance.
Description:
- Introduction: “Figure 5 and Figure 6 compare”
- Specific Detail: “the response times of the sensor at different hydrogen concentrations and operating temperatures, respectively”
- Key Points:
- Figure 5: “shows a decrease in response time with increasing hydrogen concentration”
- Figure 6: “indicates an optimal operating temperature range between 200°C and 300°C for the best sensor performance”
Common Describing Phrases
- As shown in Figure X: Used to introduce a figure.
- Figure X illustrates: Indicates that the figure visually explains a concept or result.
- As depicted in Figure X: Highlights the visual representation.
- Figure X demonstrates: Used to show that the figure provides evidence for a specific point.
- As illustrated in Figure X(a) and (b): Refers to multiple panels or parts of a figure.
- Figure X compares: Used when the figure shows a comparison between different data sets or conditions.
- As seen in Figure X: Similar to “As shown in Figure X,” used to point out a visual feature.
相关文章:

How to Describe Figures in a Research Article
How to Describe Figures in a Research Article DateAuthorVersionNote2024.07.10Dog TaoV1.0Finish the document. 文章目录 How to Describe Figures in a Research ArticleGeneral GuidelinesDetailed DescriptionsCommon Describing Phrases Effective communication of …...

昇思MindSpore学习入门-CELL与参数一
Cell作为神经网络构造的基础单元,与神经网络层(Layer)的概念相对应,对Tensor计算操作的抽象封装,能够更准确清晰地对神经网络结构进行表示。除了基础的Tensor计算流程定义外,神经网络层还包含了参数管理、状态管理等功能。而参数(…...

【k8s中安装rabbitmq】k8s中安装rabbitmq并搭建镜像集群-hostpath版
文章目录 简介一.条件及环境说明二.需求说明三.实现原理及说明四.详细步骤4.1.规划节点标签4.2.创建configmap配置4.3.创建三个statefulset和service headless配置4.4.创建service配置 五.安装完后的配置六.安装说明 简介 k8s集群中搭建rabbitmq集群服务一般都会用到pvc&#x…...
 深入探索Python-Pandas库的核心数据结构:Series详解)
(5) 深入探索Python-Pandas库的核心数据结构:Series详解
目录 前言1. Series 简介2. Series的特点3. Series的创建3.1 使用列表创建Series3.2 使用字典创建Series3.3 使用列表和自定义索引创建Series3.4 指定数据类型和名称 4. Series的索引/切片4.1 下标索引:基于整数位置的索引4.2 基于标签的索引4.3 切片4.4 使用.loc[]…...

JAVA之开发神器——IntelliJ IDEA的下载与安装
一、IDEA是什么? IEAD是JetBrains公司开发的专用于java开发的一款集成开发环境。由于其功能强大且符合人体工程学(就是更懂你)的优点,深受java开发人员的喜爱。目前在java开发工具中占比3/4。如果你要走java开发方向,那…...

通过Umijs从0到1搭建一个React项目
有一阵时间没写react了,今天通过umi搭建一个demo项目复习一下react;umi是一个可扩展的企业级前端应用框架,在react市场中还是比较火的一个框架。 Umi官方文档:Umi 介绍 (umijs.org) 一、构建项目。 1、安装包管理工具。 官方推…...

Redis 数据过期及淘汰策略
Redis 数据过期及淘汰策略 过期策略 定时过期 在设置key的过期时间的同时,为该key创建一个定时器,让定时器在key的过期时间来临时,对key进行删除。到过期时间就会立即清除。该策略可以立即清除过期的数据,对内存很友好&a…...

vue vite+three在线编辑模型导入导出
文章目录 序一、1.0.0版本1.新增2.编辑3.导出4.导入 总结 序 要实现一个类似于数字孪生的场景 可以在线、新增、删除模型 、以及编辑模型的颜色、长宽高 然后还要实现 编辑完后 保存为json数据 记录模型数据 既可以导入也可以导出 一、1.0.0版本 1.新增 先拿建议的立方体来…...

去水印小程序源码修复版-前端后端内置接口+第三方接口
去水印小程序源码,前端后端,内置接口第三方接口, 修复数据库账号密码错误问题,内置接口支持替换第三方接口, 文件挺全的,可以添加流量主代码,搭建需要准备一台服务器,备案域名和http…...

机器学习:预测评估8类指标
机器学习:8类预测评估指标 R方值、平均值绝对误差值MAE、均方误差MSE、均方误差根EMSE、中位数绝对误差MAD、平均绝对百分误差MAPE、可解释方差分EVS、均方根对数误差MLSE。 一、R方值 1、说明: R方值,也称为确定系数或拟合优度ÿ…...

【深度学习基础】MAC pycharm 专业版安装与激活
文章目录 一、pycharm专业版安装二、激活 一、pycharm专业版安装 PyCharm是一款专为Python开发者设计的集成开发环境(IDE),旨在帮助用户在使用Python语言开发时提高效率。以下是对PyCharm软件的详细介绍,包括其作用和主要功能&…...

排序相关算法--1.插入排序+冒泡排序回顾
1.基本分类 2.插入排序 特点:有实践意义(例如后期快排的优化),适应性强,一般不会到时间复杂度最坏的情况。 将第一个元素视为已经排好序的序列。取出下一个元素,在已经排好序的序列中从后往前比较…...

变阻器的故障排除方法有哪些?
变阻器,特别是滑动变阻器,作为电子电路中的常见元件,其故障排除方法主要依据具体的故障现象来确定。以下是一些常见的故障现象及其排除方法: 一、接触不良 现象:电阻器不起作用或电压不稳定。 排除方法: …...

软考《信息系统运行管理员》-3.1信息系统设施运维的管理体系
3.1信息系统设施运维的管理体系 1 信息系统设施运维的对象 基础环境 主要包括信息系统运行环境(机房、设备间、配线室、基站、云计算中心 等)中的空调系统、供配电系统、通信应急设备系统、防护设备系统(如消防系统、安全系统) 等,能维持系统安全正常运转…...

Nginx重定向
Nginx重定向 location 匹配 location匹配的就是后面的URL /WordPress 192.168.118.10/wordpress location匹配的分类和优先级 1.精确匹配 location/对字符串进行完全匹配,必须完全符合2.正则匹配 ^~ 前缀匹配,以什么为开头~ 区分大小写的匹配~* 不区分大小写!~: 区分大小…...

私有化地图离线部署方案之高程检索服务
私有化地图离线部署整体解决方案,除硬件之外,一般主要由基础地图服务、查询定位服务、路径规划服务和高程检索服务构成。 我们已经分享过基础地图服务、查询定位服务和路径规划服务,现在再为你分享高程检索服务的方法。 私有化高程检索服务…...

PostgreSQL 中如何实现数据的增量更新和全量更新的平衡?
文章目录 一、增量更新与全量更新的概念增量更新全量更新 二、考虑的因素1. 数据量2. 数据更改的频率和规模3. 数据一致性要求4. 系统性能和资源利用5. 业务逻辑和流程 三、解决方案(一)混合使用增量更新和全量更新(二)使用临时表…...

数据结构--二叉树相关习题5(判断二叉树是否是完全二叉树 )
1.判断二叉树是否是完全二叉树 辨别: 不能使用递归或者算节点个数和高度来判断。 满二叉树可以用高度和节点来判断,因为是完整的。 但是完全二叉树前面是满的,但是最后一层是从左到右连续这种 如果仍然用这种方法的话,如下图…...

Python 轻松生成多种条形码、二维码 (Code 128、EAN-13、QR code等)
条形码和二维码是现代信息交换和数据存储的重要工具,它们将信息以图形的形式编码,便于机器识别和数据处理,被广泛应用于物流、零售、医疗、教育等各领域。 本文将介绍如何使用Python快速生成各种常见的条形码如Code 128、EAN-13,…...

Python: 分块读取文本文件
在处理大文件时,逐行或分块读取文件是很常见的需求。下面是几种常见的方法,用于在 Python 中分块读取文本文件: 1、问题背景 如何分块读取一个较大的文本文件,并提取出特定的信息? 问题描述: fopen(blank.txt,r) quot…...
)
浏览器访问 AWS ECS 上部署的 Docker 容器(监听 80 端口)
✅ 一、ECS 服务配置 Dockerfile 确保监听 80 端口 EXPOSE 80 CMD ["nginx", "-g", "daemon off;"]或 EXPOSE 80 CMD ["python3", "-m", "http.server", "80"]任务定义(Task Definition&…...

SpringBoot-17-MyBatis动态SQL标签之常用标签
文章目录 1 代码1.1 实体User.java1.2 接口UserMapper.java1.3 映射UserMapper.xml1.3.1 标签if1.3.2 标签if和where1.3.3 标签choose和when和otherwise1.4 UserController.java2 常用动态SQL标签2.1 标签set2.1.1 UserMapper.java2.1.2 UserMapper.xml2.1.3 UserController.ja…...

【Axure高保真原型】引导弹窗
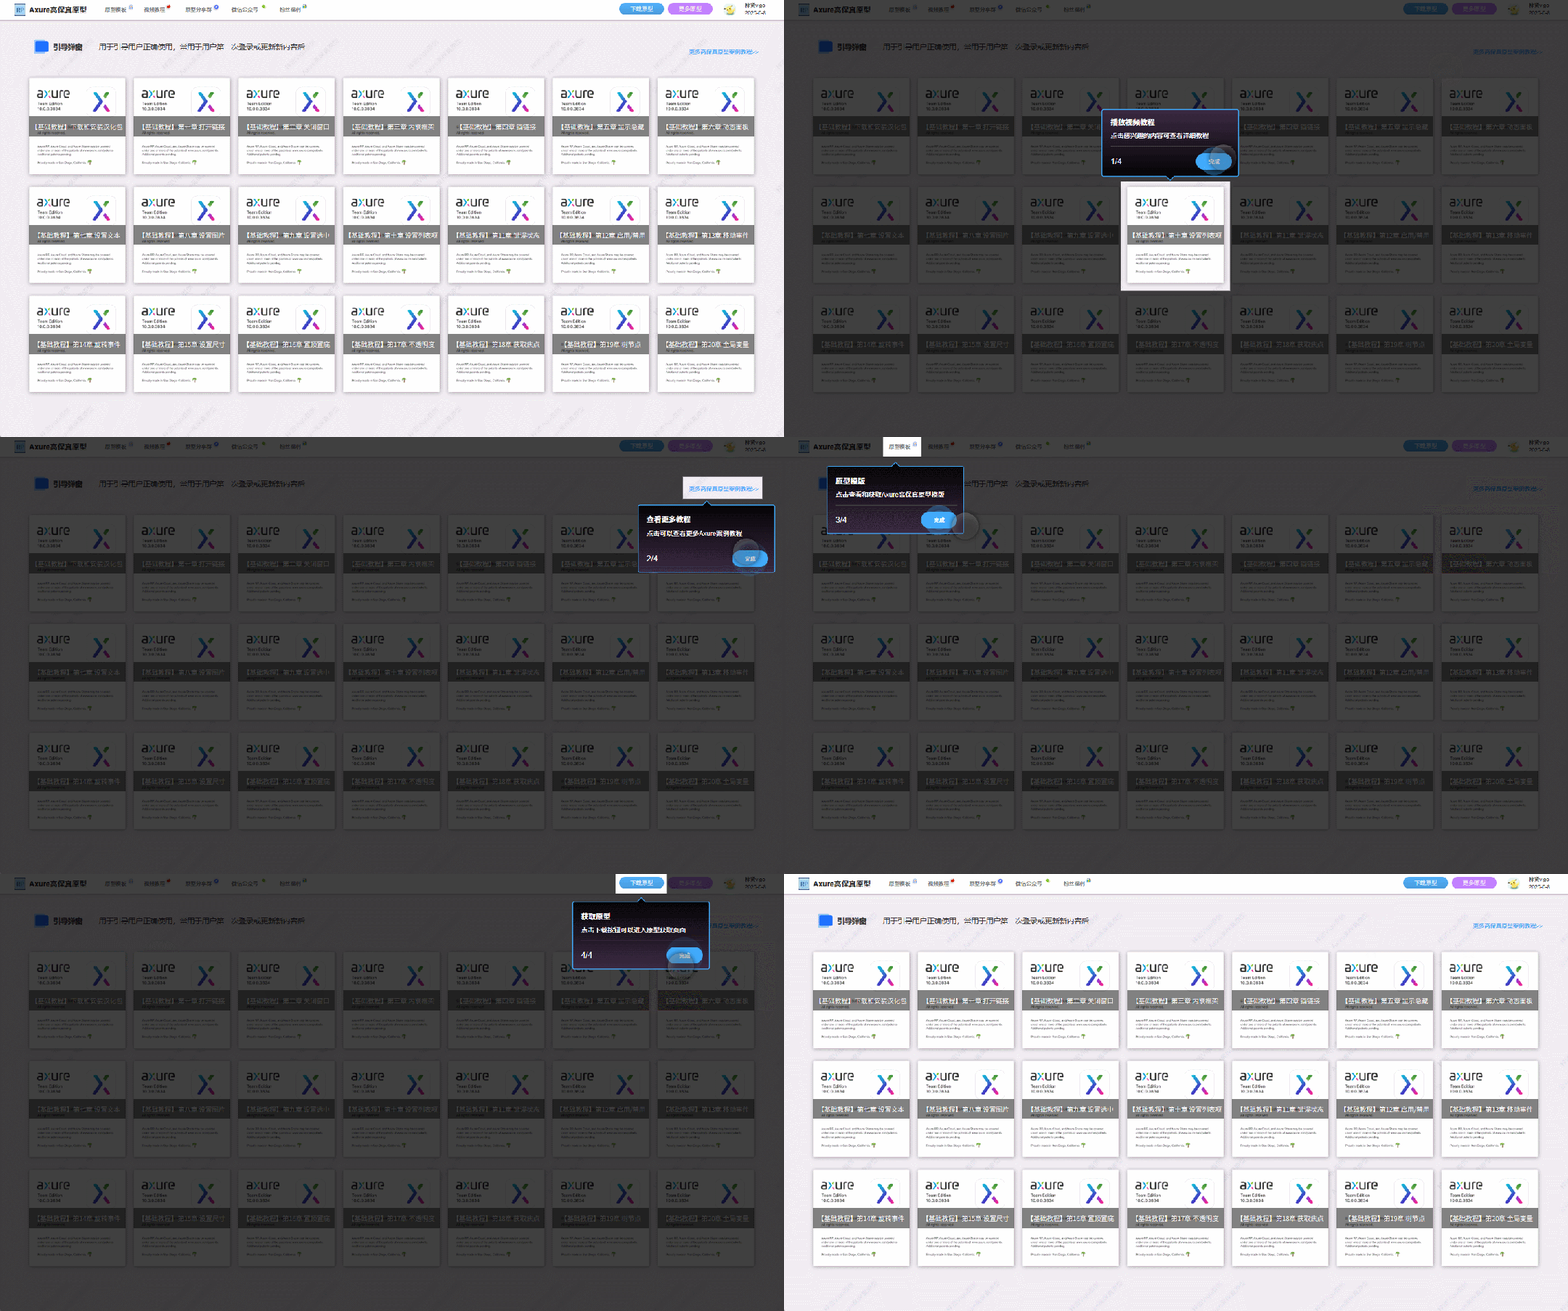
今天和大家中分享引导弹窗的原型模板,载入页面后,会显示引导弹窗,适用于引导用户使用页面,点击完成后,会显示下一个引导弹窗,直至最后一个引导弹窗完成后进入首页。具体效果可以点击下方视频观看或打开下方…...

【HarmonyOS 5.0】DevEco Testing:鸿蒙应用质量保障的终极武器
——全方位测试解决方案与代码实战 一、工具定位与核心能力 DevEco Testing是HarmonyOS官方推出的一体化测试平台,覆盖应用全生命周期测试需求,主要提供五大核心能力: 测试类型检测目标关键指标功能体验基…...

【解密LSTM、GRU如何解决传统RNN梯度消失问题】
解密LSTM与GRU:如何让RNN变得更聪明? 在深度学习的世界里,循环神经网络(RNN)以其卓越的序列数据处理能力广泛应用于自然语言处理、时间序列预测等领域。然而,传统RNN存在的一个严重问题——梯度消失&#…...

Java - Mysql数据类型对应
Mysql数据类型java数据类型备注整型INT/INTEGERint / java.lang.Integer–BIGINTlong/java.lang.Long–––浮点型FLOATfloat/java.lang.FloatDOUBLEdouble/java.lang.Double–DECIMAL/NUMERICjava.math.BigDecimal字符串型CHARjava.lang.String固定长度字符串VARCHARjava.lang…...

涂鸦T5AI手搓语音、emoji、otto机器人从入门到实战
“🤖手搓TuyaAI语音指令 😍秒变表情包大师,让萌系Otto机器人🔥玩出智能新花样!开整!” 🤖 Otto机器人 → 直接点明主体 手搓TuyaAI语音 → 强调 自主编程/自定义 语音控制(TuyaAI…...

鱼香ros docker配置镜像报错:https://registry-1.docker.io/v2/
使用鱼香ros一件安装docker时的https://registry-1.docker.io/v2/问题 一键安装指令 wget http://fishros.com/install -O fishros && . fishros出现问题:docker pull 失败 网络不同,需要使用镜像源 按照如下步骤操作 sudo vi /etc/docker/dae…...

Spring Cloud Gateway 中自定义验证码接口返回 404 的排查与解决
Spring Cloud Gateway 中自定义验证码接口返回 404 的排查与解决 问题背景 在一个基于 Spring Cloud Gateway WebFlux 构建的微服务项目中,新增了一个本地验证码接口 /code,使用函数式路由(RouterFunction)和 Hutool 的 Circle…...

嵌入式学习笔记DAY33(网络编程——TCP)
一、网络架构 C/S (client/server 客户端/服务器):由客户端和服务器端两个部分组成。客户端通常是用户使用的应用程序,负责提供用户界面和交互逻辑 ,接收用户输入,向服务器发送请求,并展示服务…...
