K8S 上部署 Prometheus + Grafana
文章目录
- 一、使用 Helm 安装 Prometheus
- 1. 配置源
- 2. 下载 prometheus 包
- 3. 安装 prometheus
- 4. 卸载
- 二、使用 Helm 安装 Grafana
- 1. 配置源
- 2. 安装 grafana
- 3. 访问
- 4. 卸载
一、使用 Helm 安装 Prometheus
1. 配置源
地址:https://artifacthub.io/packages/helm/prometheus-community/prometheus
# 添加repo
$ helm repo add prometheus-community https://prometheus-community.github.io/helm-charts
"prometheus-community" has been added to your repositories$ helm repo update prometheus-community
Hang tight while we grab the latest from your chart repositories...
...Successfully got an update from the "prometheus-community" chart repository
Update Complete. ⎈Happy Helming!⎈$ helm search repo prometheus-community/prometheus
NAME                                              	CHART VERSION	APP VERSION	DESCRIPTION
prometheus-community/prometheus                   	25.24.0      	v2.53.1    	Prometheus is a monitoring system and time seri...
prometheus-community/prometheus-adapter           	4.10.0       	v0.11.2    	A Helm chart for k8s prometheus adapter
prometheus-community/prometheus-blackbox-exporter 	8.17.0       	v0.25.0    	Prometheus Blackbox Exporter
prometheus-community/prometheus-cloudwatch-expo...	0.25.3       	0.15.5     	A Helm chart for prometheus cloudwatch-exporter
prometheus-community/prometheus-conntrack-stats...	0.5.10       	v0.4.18    	A Helm chart for conntrack-stats-exporter
prometheus-community/prometheus-consul-exporter   	1.0.0        	0.4.0      	A Helm chart for the Prometheus Consul Exporter
prometheus-community/prometheus-couchdb-exporter  	1.0.0        	1.0        	A Helm chart to export the metrics from couchdb...
prometheus-community/prometheus-druid-exporter    	1.1.0        	v0.11.0    	Druid exporter to monitor druid metrics with Pr...
prometheus-community/prometheus-elasticsearch-e...	6.0.0        	v1.7.0     	Elasticsearch stats exporter for Prometheus
prometheus-community/prometheus-fastly-exporter   	0.4.0        	v8.1.0     	A Helm chart for the Prometheus Fastly Exporter
prometheus-community/prometheus-ipmi-exporter     	0.4.0        	v1.8.0     	This is an IPMI exporter for Prometheus.
prometheus-community/prometheus-json-exporter     	0.13.0       	v0.6.0     	Install prometheus-json-exporter
prometheus-community/prometheus-kafka-exporter    	2.10.0       	v1.7.0     	A Helm chart to export the metrics from Kafka i...
prometheus-community/prometheus-memcached-exporter	0.3.3        	v0.14.4    	Prometheus exporter for Memcached metrics
prometheus-community/prometheus-modbus-exporter   	0.1.2        	0.4.1      	A Helm chart for prometheus-modbus-exporter
prometheus-community/prometheus-mongodb-exporter  	3.5.0        	0.40.0     	A Prometheus exporter for MongoDB metrics
prometheus-community/prometheus-mysql-exporter    	2.5.3        	v0.15.1    	A Helm chart for prometheus mysql exporter with...
prometheus-community/prometheus-nats-exporter     	2.17.0       	0.15.0     	A Helm chart for prometheus-nats-exporter
prometheus-community/prometheus-nginx-exporter    	0.2.1        	0.11.0     	A Helm chart for the Prometheus NGINX Exporter
prometheus-community/prometheus-node-exporter     	4.37.0       	1.8.1      	A Helm chart for prometheus node-exporter
prometheus-community/prometheus-opencost-exporter 	0.1.1        	1.108.0    	Prometheus OpenCost Exporter
prometheus-community/prometheus-operator          	9.3.2        	0.38.1     	DEPRECATED - This chart will be renamed. See ht...
prometheus-community/prometheus-operator-admiss...	0.14.0       	0.75.1     	Prometheus Operator Admission Webhook
prometheus-community/prometheus-operator-crds     	13.0.1       	v0.75.0    	A Helm chart that collects custom resource defi...
prometheus-community/prometheus-pgbouncer-exporter	0.3.0        	v0.8.0     	A Helm chart for prometheus pgbouncer-exporter
prometheus-community/prometheus-pingdom-exporter  	2.5.0        	20190610-1 	A Helm chart for Prometheus Pingdom Exporter
prometheus-community/prometheus-pingmesh-exporter 	0.4.0        	v1.2.1     	Prometheus Pingmesh Exporter
prometheus-community/prometheus-postgres-exporter 	6.0.1        	v0.15.0    	A Helm chart for prometheus postgres-exporter
prometheus-community/prometheus-pushgateway       	2.14.0       	v1.9.0     	A Helm chart for prometheus pushgateway
prometheus-community/prometheus-rabbitmq-exporter 	1.12.0       	v0.29.0    	Rabbitmq metrics exporter for prometheus
prometheus-community/prometheus-redis-exporter    	6.3.0        	v1.61.0    	Prometheus exporter for Redis metrics
prometheus-community/prometheus-smartctl-exporter 	0.10.0       	v0.12.0    	A Helm chart for Kubernetes
prometheus-community/prometheus-snmp-exporter     	5.5.0        	v0.26.0    	Prometheus SNMP Exporter
prometheus-community/prometheus-sql-exporter      	0.1.0        	v0.5.4     	Prometheus SQL Exporter
prometheus-community/prometheus-stackdriver-exp...	4.5.1        	v0.15.1    	Stackdriver exporter for Prometheus
prometheus-community/prometheus-statsd-exporter   	0.13.1       	v0.26.1    	A Helm chart for prometheus stats-exporter
prometheus-community/prometheus-systemd-exporter  	0.3.0        	0.6.0      	A Helm chart for prometheus systemd-exporter
prometheus-community/prometheus-to-sd             	0.4.2        	0.5.2      	Scrape metrics stored in prometheus format and ...
prometheus-community/prometheus-windows-exporter  	0.3.1        	0.25.1     	A Helm chart for prometheus windows-exporter
2. 下载 prometheus 包
# 拉包
$ helm pull prometheus-community/prometheus$ ll
total 88
drwxr-xr-x 2 root   root    4096 Jul 16 03:12 ./
drwxrwxr-x 9 ubuntu ubuntu  4096 Jul 16 03:10 ../
-rw-r--r-- 1 root   root   80137 Jul 16 03:12 prometheus-25.24.0.tgz# 解包
$ tar -zxvf prometheus-25.24.0.tgz
prometheus/Chart.yaml
prometheus/Chart.lock
prometheus/values.yaml
prometheus/values.schema.json
prometheus/templates/NOTES.txt
prometheus/templates/_helpers.tpl
prometheus/templates/clusterrole.yaml
prometheus/templates/clusterrolebinding.yaml
prometheus/templates/cm.yaml
prometheus/templates/deploy.yaml
prometheus/templates/extra-manifests.yaml
prometheus/templates/headless-svc.yaml
prometheus/templates/ingress.yaml
prometheus/templates/network-policy.yaml
prometheus/templates/pdb.yaml
prometheus/templates/psp.yaml
prometheus/templates/pvc.yaml
prometheus/templates/rolebinding.yaml
prometheus/templates/service.yaml
prometheus/templates/serviceaccount.yaml
prometheus/templates/sts.yaml
prometheus/templates/vpa.yaml
prometheus/.helmignore
prometheus/README.md
prometheus/ci/01-automount-sa-token-values.yaml
prometheus/ci/02-config-reloader-deployment-values.yaml
prometheus/ci/03-config-reloader-sts-values.yaml
prometheus/ci/04-extra-manifest-values.yaml
prometheus/ci/05-server-deployment-values.yaml
prometheus/ci/06-server-sts-values.yaml
prometheus/ci/07-meta-labels-values.yaml
prometheus/ci/08-sts-pvc-retention-policy-values.yaml
prometheus/ci/09-standalone-deployment-values.yaml
prometheus/ci/10-namespaced-sd-values.yaml
prometheus/ci/11-default-values.yaml
prometheus/charts/alertmanager/Chart.yaml
prometheus/charts/alertmanager/values.yaml
prometheus/charts/alertmanager/values.schema.json
prometheus/charts/alertmanager/templates/NOTES.txt
prometheus/charts/alertmanager/templates/_helpers.tpl
prometheus/charts/alertmanager/templates/configmap.yaml
prometheus/charts/alertmanager/templates/ingress.yaml
prometheus/charts/alertmanager/templates/ingressperreplica.yaml
prometheus/charts/alertmanager/templates/pdb.yaml
prometheus/charts/alertmanager/templates/serviceaccount.yaml
prometheus/charts/alertmanager/templates/serviceperreplica.yaml
prometheus/charts/alertmanager/templates/services.yaml
prometheus/charts/alertmanager/templates/statefulset.yaml
prometheus/charts/alertmanager/templates/tests/test-connection.yaml
prometheus/charts/alertmanager/.helmignore
prometheus/charts/alertmanager/README.md
prometheus/charts/alertmanager/ci/config-reload-values.yaml
prometheus/charts/kube-state-metrics/Chart.yaml
prometheus/charts/kube-state-metrics/values.yaml
prometheus/charts/kube-state-metrics/templates/NOTES.txt
prometheus/charts/kube-state-metrics/templates/_helpers.tpl
prometheus/charts/kube-state-metrics/templates/ciliumnetworkpolicy.yaml
prometheus/charts/kube-state-metrics/templates/clusterrolebinding.yaml
prometheus/charts/kube-state-metrics/templates/crs-configmap.yaml
prometheus/charts/kube-state-metrics/templates/deployment.yaml
prometheus/charts/kube-state-metrics/templates/extra-manifests.yaml
prometheus/charts/kube-state-metrics/templates/kubeconfig-secret.yaml
prometheus/charts/kube-state-metrics/templates/networkpolicy.yaml
prometheus/charts/kube-state-metrics/templates/pdb.yaml
prometheus/charts/kube-state-metrics/templates/podsecuritypolicy.yaml
prometheus/charts/kube-state-metrics/templates/psp-clusterrole.yaml
prometheus/charts/kube-state-metrics/templates/psp-clusterrolebinding.yaml
prometheus/charts/kube-state-metrics/templates/rbac-configmap.yaml
prometheus/charts/kube-state-metrics/templates/role.yaml
prometheus/charts/kube-state-metrics/templates/rolebinding.yaml
prometheus/charts/kube-state-metrics/templates/service.yaml
prometheus/charts/kube-state-metrics/templates/serviceaccount.yaml
prometheus/charts/kube-state-metrics/templates/servicemonitor.yaml
prometheus/charts/kube-state-metrics/templates/stsdiscovery-role.yaml
prometheus/charts/kube-state-metrics/templates/stsdiscovery-rolebinding.yaml
prometheus/charts/kube-state-metrics/templates/verticalpodautoscaler.yaml
prometheus/charts/kube-state-metrics/.helmignore
prometheus/charts/kube-state-metrics/README.md
prometheus/charts/prometheus-node-exporter/Chart.yaml
prometheus/charts/prometheus-node-exporter/values.yaml
prometheus/charts/prometheus-node-exporter/templates/NOTES.txt
prometheus/charts/prometheus-node-exporter/templates/_helpers.tpl
prometheus/charts/prometheus-node-exporter/templates/clusterrole.yaml
prometheus/charts/prometheus-node-exporter/templates/clusterrolebinding.yaml
prometheus/charts/prometheus-node-exporter/templates/daemonset.yaml
prometheus/charts/prometheus-node-exporter/templates/endpoints.yaml
prometheus/charts/prometheus-node-exporter/templates/extra-manifests.yaml
prometheus/charts/prometheus-node-exporter/templates/networkpolicy.yaml
prometheus/charts/prometheus-node-exporter/templates/podmonitor.yaml
prometheus/charts/prometheus-node-exporter/templates/psp-clusterrole.yaml
prometheus/charts/prometheus-node-exporter/templates/psp-clusterrolebinding.yaml
prometheus/charts/prometheus-node-exporter/templates/psp.yaml
prometheus/charts/prometheus-node-exporter/templates/rbac-configmap.yaml
prometheus/charts/prometheus-node-exporter/templates/service.yaml
prometheus/charts/prometheus-node-exporter/templates/serviceaccount.yaml
prometheus/charts/prometheus-node-exporter/templates/servicemonitor.yaml
prometheus/charts/prometheus-node-exporter/templates/verticalpodautoscaler.yaml
prometheus/charts/prometheus-node-exporter/.helmignore
prometheus/charts/prometheus-node-exporter/README.md
prometheus/charts/prometheus-node-exporter/ci/port-values.yaml
prometheus/charts/prometheus-pushgateway/Chart.yaml
prometheus/charts/prometheus-pushgateway/values.yaml
prometheus/charts/prometheus-pushgateway/templates/NOTES.txt
prometheus/charts/prometheus-pushgateway/templates/_helpers.tpl
prometheus/charts/prometheus-pushgateway/templates/deployment.yaml
prometheus/charts/prometheus-pushgateway/templates/extra-manifests.yaml
prometheus/charts/prometheus-pushgateway/templates/ingress.yaml
prometheus/charts/prometheus-pushgateway/templates/networkpolicy.yaml
prometheus/charts/prometheus-pushgateway/templates/pdb.yaml
prometheus/charts/prometheus-pushgateway/templates/pushgateway-pvc.yaml
prometheus/charts/prometheus-pushgateway/templates/secret.yaml
prometheus/charts/prometheus-pushgateway/templates/service.yaml
prometheus/charts/prometheus-pushgateway/templates/serviceaccount.yaml
prometheus/charts/prometheus-pushgateway/templates/servicemonitor.yaml
prometheus/charts/prometheus-pushgateway/templates/statefulset.yaml
prometheus/charts/prometheus-pushgateway/.helmignore
prometheus/charts/prometheus-pushgateway/README.md
3. 安装 prometheus
$ helm install prometheus ./ \-n prometheus \--create-namespace \--set server.ingress.enabled=true \--set server.ingress.hosts='{prometheus.k8s.local}' \--set server.ingress.paths='{/}' \--set server.ingress.pathType=Prefix \--set alertmanager.ingress.enabled=true \--set alertmanager.ingress.hosts='{alertmanager.k8s.local}' \--set alertmanager.ingress.paths='{/}' \--set alertmanager.ingress.pathType=Prefix \--set grafana.ingress.enabled=true \--set grafana.ingress.hosts='{grafana.k8s.local}' \--set grafana.ingress.paths='{/}' \--set grafana.ingress.pathType=Prefix
Error: INSTALLATION FAILED: values don't meet the specifications of the schema(s) in the following chart(s):
alertmanager:
- ingress.hosts.0: Invalid type. Expected: object, given: string# 原因:上面的参数有问题
$ helm install prometheus ./ \-n prometheus \--create-namespace
NAME: prometheus
LAST DEPLOYED: Tue Jul 16 03:55:13 2024
NAMESPACE: prometheus
STATUS: deployed
REVISION: 1
TEST SUITE: None
NOTES:
The Prometheus server can be accessed via port 80 on the following DNS name from within your cluster:
prometheus-server.prometheus.svc.cluster.localGet the Prometheus server URL by running these commands in the same shell:export POD_NAME=$(kubectl get pods --namespace prometheus -l "app.kubernetes.io/name=prometheus,app.kubernetes.io/instance=prometheus" -o jsonpath="{.items[0].metadata.name}")kubectl --namespace prometheus port-forward $POD_NAME 9090The Prometheus alertmanager can be accessed via port 9093 on the following DNS name from within your cluster:
prometheus-alertmanager.prometheus.svc.cluster.localGet the Alertmanager URL by running these commands in the same shell:export POD_NAME=$(kubectl get pods --namespace prometheus -l "app.kubernetes.io/name=alertmanager,app.kubernetes.io/instance=prometheus" -o jsonpath="{.items[0].metadata.name}")kubectl --namespace prometheus port-forward $POD_NAME 9093
#################################################################################
######   WARNING: Pod Security Policy has been disabled by default since    #####
######            it deprecated after k8s 1.25+. use                        #####
######            (index .Values "prometheus-node-exporter" "rbac"          #####
###### .          "pspEnabled") with (index .Values                         #####
######            "prometheus-node-exporter" "rbac" "pspAnnotations")       #####
######            in case you still need it.                                #####
#################################################################################The Prometheus PushGateway can be accessed via port 9091 on the following DNS name from within your cluster:
prometheus-prometheus-pushgateway.prometheus.svc.cluster.localGet the PushGateway URL by running these commands in the same shell:export POD_NAME=$(kubectl get pods --namespace prometheus -l "app=prometheus-pushgateway,component=pushgateway" -o jsonpath="{.items[0].metadata.name}")kubectl --namespace prometheus port-forward $POD_NAME 9091For more information on running Prometheus, visit:
https://prometheus.io/$ kubectl get pods,svc,ingress -n prometheus
NAME                                                    READY   STATUS    RESTARTS   AGE
pod/prometheus-alertmanager-0                           0/1     Pending   0          90s
pod/prometheus-kube-state-metrics-649c959fbc-rjq5v      1/1     Running   0          90s
pod/prometheus-prometheus-node-exporter-7jdb2           1/1     Running   0          90s
pod/prometheus-prometheus-node-exporter-p6lm4           1/1     Running   0          90s
pod/prometheus-prometheus-node-exporter-t4hcn           1/1     Running   0          90s
pod/prometheus-prometheus-pushgateway-879d6dd6c-wh7x5   1/1     Running   0          90s
pod/prometheus-server-75d49659f-krzp9                   0/2     Pending   0          90sNAME                                          TYPE        CLUSTER-IP      EXTERNAL-IP   PORT(S)    AGE
service/prometheus-alertmanager               ClusterIP   10.68.34.56     <none>        9093/TCP   90s
service/prometheus-alertmanager-headless      ClusterIP   None            <none>        9093/TCP   90s
service/prometheus-kube-state-metrics         ClusterIP   10.68.156.120   <none>        8080/TCP   90s
service/prometheus-prometheus-node-exporter   ClusterIP   10.68.161.251   <none>        9100/TCP   90s
service/prometheus-prometheus-pushgateway     ClusterIP   10.68.229.83    <none>        9091/TCP   90s
service/prometheus-server                     ClusterIP   10.68.120.158   <none>        80/TCP     90s$ kubectl get pvc -n prometheus
NAME                                STATUS    VOLUME   CAPACITY   ACCESS MODES   STORAGECLASS   AGE
prometheus-server                   Pending                                                     8m57s
storage-prometheus-alertmanager-0   Pending                                                     8m57s# 有些服务一直处在 Pending,原因是存储卷的问题,改为 nfs 就好使
$ helm install prometheus prometheus-community/prometheus -n prometheus --create-namespace --set server.persistentVolume.storageClass=nfs --set alertmanager.persistence.storageClass=nfs$ kubectl get pods,svc,ingress -n prometheus
NAME                                                    READY   STATUS    RESTARTS   AGE
pod/prometheus-alertmanager-0                           1/1     Running   0          55s
pod/prometheus-kube-state-metrics-649c959fbc-zf9zw      1/1     Running   0          55s
pod/prometheus-prometheus-node-exporter-9mz4q           1/1     Running   0          55s
pod/prometheus-prometheus-node-exporter-cpz26           1/1     Running   0          55s
pod/prometheus-prometheus-node-exporter-h2w68           1/1     Running   0          55s
pod/prometheus-prometheus-pushgateway-879d6dd6c-qqr4z   1/1     Running   0          55s
pod/prometheus-server-75d49659f-s624q                   2/2     Running   0          55sNAME                                          TYPE        CLUSTER-IP      EXTERNAL-IP   PORT(S)    AGE
service/prometheus-alertmanager               ClusterIP   10.68.150.157   <none>        9093/TCP   55s
service/prometheus-alertmanager-headless      ClusterIP   None            <none>        9093/TCP   55s
service/prometheus-kube-state-metrics         ClusterIP   10.68.130.219   <none>        8080/TCP   55s
service/prometheus-prometheus-node-exporter   ClusterIP   10.68.199.239   <none>        9100/TCP   55s
service/prometheus-prometheus-pushgateway     ClusterIP   10.68.171.40    <none>        9091/TCP   55s
service/prometheus-server                     ClusterIP   10.68.196.144   <none>        80/TCP     55s
$ kubectl get pvc -n prometheus
NAME                                STATUS   VOLUME                                     CAPACITY   ACCESS MODES   STORAGECLASS   AGE
prometheus-server                   Bound    pvc-570e1a01-aecc-4d03-82fd-ed195a1266df   8Gi        RWO            nfs            58s
storage-prometheus-alertmanager-0   Bound    pvc-8c19e194-ff8c-4cc7-8bea-142b1adce5ac   2Gi        RWO            nfs            58s
最终自定义的参数执行:
$ helm install prometheus prometheus-community/prometheus -n prometheus --create-namespace --set server.persistentVolume.storageClass=nfs --set alertmanager.persistence.storageClass=nfs --set server.service.type=NodePort --set alertmanager.service.type=NodePort --set server.service.nodePort=31203 --set alertmanager.service.nodePort=31757root@k8s-master01:/home/ubuntu# kubectl get svc -n prometheus
NAME                                  TYPE        CLUSTER-IP      EXTERNAL-IP   PORT(S)          AGE
prometheus-alertmanager               NodePort    10.68.18.91     <none>        9093:31757/TCP   21s
prometheus-alertmanager-headless      ClusterIP   None            <none>        9093/TCP         21s
prometheus-kube-state-metrics         ClusterIP   10.68.181.212   <none>        8080/TCP         21s
prometheus-prometheus-node-exporter   ClusterIP   10.68.215.203   <none>        9100/TCP         21s
prometheus-prometheus-pushgateway     ClusterIP   10.68.69.2      <none>        9091/TCP         21s
prometheus-server                     NodePort    10.68.254.104   <none>        80:31203/TCP     21s
4. 卸载
$ helm uninstall prometheus -n prometheus
release "prometheus" uninstalledkubectl delete pod -n prometheus `kubectl get pod -n prometheus |awk 'NR>1{print $1}'` --force
kubectl patch ns prometheus -p '{"metadata":{"finalizers":null}}'$ kubectl delete ns prometheus --force
Warning: Immediate deletion does not wait for confirmation that the running resource has been terminated. The resource may continue to run on the cluster indefinitely.
namespace "prometheus" force deleted
二、使用 Helm 安装 Grafana
1. 配置源
地址:https://artifacthub.io/packages/helm/grafana/grafana
$ helm repo add grafana https://grafana.github.io/helm-charts
"grafana" has been added to your repositories$ helm repo update grafana
Hang tight while we grab the latest from your chart repositories...
...Successfully got an update from the "grafana" chart repository
Update Complete. ⎈Happy Helming!⎈$ helm search repo grafana/grafana
NAME                          	CHART VERSION	APP VERSION	DESCRIPTION
grafana/grafana               	8.3.4        	11.1.0     	The leading tool for querying and visualizing t...
grafana/grafana-agent         	0.41.0       	v0.41.1    	Grafana Agent
grafana/grafana-agent-operator	0.4.0        	0.41.1     	A Helm chart for Grafana Agent Operator
grafana/grafana-sampling      	0.1.1        	v0.40.2    	A Helm chart for a layered OTLP tail sampling a...
2. 安装 grafana
$ helm install grafana grafana/grafana -n grafana --create-namespace
NAME: grafana
LAST DEPLOYED: Tue Jul 16 06:01:14 2024
NAMESPACE: grafana
STATUS: deployed
REVISION: 1
NOTES:
1. Get your 'admin' user password by running:kubectl get secret --namespace grafana grafana -o jsonpath="{.data.admin-password}" | base64 --decode ; echo2. The Grafana server can be accessed via port 80 on the following DNS name from within your cluster:grafana.grafana.svc.cluster.localGet the Grafana URL to visit by running these commands in the same shell:export POD_NAME=$(kubectl get pods --namespace grafana -l "app.kubernetes.io/name=grafana,app.kubernetes.io/instance=grafana" -o jsonpath="{.items[0].metadata.name}")kubectl --namespace grafana port-forward $POD_NAME 30003. Login with the password from step 1 and the username: admin
#################################################################################
######   WARNING: Persistence is disabled!!! You will lose your data when   #####
######            the Grafana pod is terminated.                            #####
#################################################################################$ kubectl get all -o wide -n grafana
NAME                           READY   STATUS    RESTARTS   AGE     IP              NODE        NOMINATED NODE   READINESS GATES
pod/grafana-5b6798c77d-jlkvt   1/1     Running   0          2m37s   172.20.58.239   worker-02   <none>           <none>NAME              TYPE        CLUSTER-IP     EXTERNAL-IP   PORT(S)   AGE     SELECTOR
service/grafana   ClusterIP   10.68.48.202   <none>        80/TCP    2m37s   app.kubernetes.io/instance=grafana,app.kubernetes.io/name=grafanaNAME                      READY   UP-TO-DATE   AVAILABLE   AGE     CONTAINERS   IMAGES                             SELECTOR
deployment.apps/grafana   1/1     1            1           2m37s   grafana      docker.io/grafana/grafana:11.1.0   app.kubernetes.io/instance=grafana,app.kubernetes.io/name=grafanaNAME                                 DESIRED   CURRENT   READY   AGE     CONTAINERS   IMAGES                             SELECTOR
replicaset.apps/grafana-5b6798c77d   1         1         1       2m37s   grafana      docker.io/grafana/grafana:11.1.0   app.kubernetes.io/instance=grafana,app.kubernetes.io/name=grafana,pod-template-hash=5b6798c77d
最终自定义的参数执行:
$ helm install grafana grafana/grafana -n grafana --create-namespace --set service.type=NodePort --set service.nodePort=31830$ kubectl get svc -n grafana
NAME      TYPE       CLUSTER-IP    EXTERNAL-IP   PORT(S)        AGE
grafana   NodePort   10.68.140.2   <none>        80:31830/TCP   40s
3. 访问
web 访问:https://yourIp:31830
账号:admin,密码通过下面命令获取 0D0NfEWWFx9qsBiKR8PuFVxf6PPa9o8YGhZZaNXY
$ kubectl get secret --namespace grafana grafana -o jsonpath="{.data.admin-password}" | base64 --decode ; echo
0D0NfEWWFx9qsBiKR8PuFVxf6PPa9o8YGhZZaNXY


4. 卸载
$ helm uninstall grafana -n grafana
release "grafana" uninstalledkubectl delete pod -n grafana `kubectl get pod -n grafana|awk 'NR>1{print $1}'` --force
kubectl patch ns grafana -p '{"metadata":{"finalizers":null}}'
kubectl delete ns grafana --force
参考:【云原生】Prometheus+Grafana on K8s 环境部署
相关文章:
K8S 上部署 Prometheus + Grafana
文章目录 一、使用 Helm 安装 Prometheus1. 配置源2. 下载 prometheus 包3. 安装 prometheus4. 卸载 二、使用 Helm 安装 Grafana1. 配置源2. 安装 grafana3. 访问4. 卸载 一、使用 Helm 安装 Prometheus 1. 配置源 地址:https://artifacthub.io/packages/helm/pro…...

雷军的逆天改命与顺势而为
雷军年度演讲前,朋友李翔提了一个问题:雷军造车是属于顺势而为还是逆势而为?评论互动区有一个总结,很有意思,叫“顺势逆袭”。 大致意思是产业趋势下小米从手机到IOT再切入汽车,是战略的必然,不…...

Leetcode 11. 盛最多水的容器
Leetcode 11. 盛最多水的容器 Leetcode 11. 盛最多水的容器 一、题目描述二、我的想法 一、题目描述 给定一个长度为 n 的整数数组 height 。有 n 条垂线,第 i 条线的两个端点是 (i, 0) 和 (i, height[i]) 。 找出其中的两条线,使得它们与 x 轴共同构成…...

Java笔试分享
1、设计模式(写>3种常用的设计模式) 设计模式是在软件工程中解决常见问题的经验性解决方案。以下是一些常用的设计模式: 单例模式(Singleton): 意图:确保一个类只有一个实例,并…...
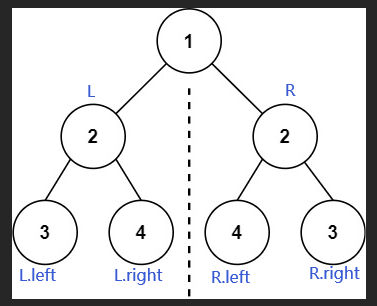
LeetCode:对称的二叉树(C语言)
1、问题概述:给一个二叉树,看是否按轴对称 2、示例 示例 1: 输入:root [1,2,2,3,4,4,3] 输出:true 示例 2: 输入:root [1,2,2,null,3,null,3] 输出:false 3、分析 (1&a…...

Postman中的API Schema验证:确保响应精准无误
Postman中的API Schema验证:确保响应精准无误 在API开发和测试过程中,验证响应数据的准确性和一致性是至关重要的。Postman提供了一个强大的功能——API Schema验证,它允许开发者根据预定义的JSON Schema来检查API响应。本文将详细介绍如何在…...

深入浅出WebRTC—GCC
GoogCcNetworkController 是 GCC 的控制中心,它由 RtpTransportControllerSend 通过定时器和 TransportFeedback 来驱动。GoogCcNetworkController 不断更新内部各个组件的状态,并协调组件之间相互配合,向外输出目标码率等重要参数࿰…...

leetcode日记(49)旋转链表
其实不难,就是根据kk%len判断需要旋转的位置,再将后半段接在前半段前面就行。 /*** Definition for singly-linked list.* struct ListNode {* int val;* ListNode *next;* ListNode() : val(0), next(nullptr) {}* ListNode(int x) : …...

InteliJ IDEA最新2024版下载安装与快速配置激活使用教程+jdk下载配置
第一步:下载ideaIC-2024.1.4 方法1:在线链接 IntelliJ IDEA – the Leading Java and Kotlin IDE (jetbrains.com) 选择社区版进行下载 方法2:百度网盘 链接:https://pan.baidu.com/s/1ydS6krUX6eE_AdW4uGV_6w?pwdsbfm 提取…...

【23】Android高级知识之Window(四) - ThreadedRenderer
一、概述 在上一篇文章中已经讲了setView整个流程中,最开始的addToDisplay和WMS跨进程通信的整个过程做了什么。继文章Android基础知识之Window(二),这算是另外一个分支了,接着讲分析在performTraversals的三个操作中,最后触发pe…...

Java-根据前缀-日期-数字-生成流水号(不重复)
🎈边走、边悟🎈迟早会好 小伙伴们在日常开发时可能会遇到的业务-生成流水号,在企业中可以说是比较常见的需求, 可以采用"前缀日期数字"的方式(ps:此方式是需要用到缓存的)前缀:为了…...
跟李沐学AI:卷积层
从全连接层到卷积 多层感知机十分适合处理表格数据,其中行对应样本,列对应特征。但对于图片等数据,全连接层会导致参数过多。卷积神经网络(convolutional neural networks,CNN)是机器学习利用自然图像中一…...

使用RedisTemplate操作executePipelined
前言 RedisTemplate 是 Spring 提供的用于操作 Redis 的模板类,它封装了 Redis 的连接、连接池等管理,并提供了一系列的操作方法来简化 Redis 的使用。其中,executePipelined 方法是 RedisTemplate 中的一个高级特性,用于支持 Re…...

react-native从入门到实战系列教程一环境安装篇
充分阅读官网的环境配置指南,严格按照他的指导作业,不然你一直只能在web或沙箱环境下玩玩 极快的网络和科学上网,必备其中的一个较好的心理忍受能力,因为上面一点就可以让你放弃坚持不懈,努力尝试 成功效果 三大件 …...

【Gin】精准应用:Gin框架中工厂模式的现代软件开发策略与实施技巧(下)
【Gin】精准应用:Gin框架中工厂模式的现代软件开发策略与实施技巧(下) 大家好 我是寸铁👊 【Gin】精准应用:Gin框架中工厂模式的现代软件开发策略与实施技巧(下)✨ 喜欢的小伙伴可以点点关注 💝 前言 本次文章分为上下两部分&…...

国科大作业考试资料-人工智能原理与算法-2024新编-第十二次作业整理
袋子里面有3个有偏差的硬币a、b和c,抛掷硬币正面朝上的概率分别是20%、60%和80%。从袋子里随机取出一个硬币(3个硬币被取出的概率是相等的),并把取出的硬币抛掷3次,得到抛掷结果依次是X1 , X2和 X3。 a. 画出对应的贝叶斯网络并定义必要的CPT表。 b. 如果抛掷结果是2次正…...

《0基础》学习Python——第二十一讲__网络爬虫/<4>爬取豆瓣电影电影信息
爬取网页数据(获取网页信息全过程) 1、爬取豆瓣电影的电影名称、导演、主演、年份、国家、评价 2、首先我们先爬取页面然后再获取信息 1、爬取网页源码 import requests from lxml import etree if __name__ __main__:#UA伪装head{User-Agent:Mozilla/…...

【C++初阶】string类
【C初阶】string类 🥕个人主页:开敲🍉 🔥所属专栏:C🥭 🌼文章目录🌼 1. 为什么学习string类? 1.1 C语言中的字符串 1.2 实际中 2. 标准库中的string类 2.1 string类 2.…...

RAS--APEI 报错解析流程(2)
RAS--APEI 报错解析流程(1) 除了APEI 中除了GHES会记录错误,在Post过程中的错误通常是通过BERT Table汇报 1.BERT Boot Error Record Table is used to report unhandled errors that occurred in a previous boot,it is reported as a ‘one-time polle…...
微软蓝屏事件对企业数字化转型有什么影响?
引言:从北京时间2024年7月19日(周五)下午2点多开始,全球大量Windows用户出现电脑崩溃、蓝屏死机、无法重启等情况。事发后,网络安全公司CrowdStrike称,收到大量关于Windows电脑出现蓝屏报告,公司…...

四旋翼变形控制:RL与MPC在混合动力学中的对比
1. 四旋翼变形控制的技术挑战与解决方案四旋翼变形控制(Quadrotor Morpho-Transition)是当前机器人领域最具挑战性的前沿技术之一。这项技术使机器人能够在空中完成形态变换,实现从飞行模式到地面模式的平滑切换。想象一下,一架四…...

DeepSeek代码质量评估实战手册:7步完成从混沌到可度量的质变跃迁
更多请点击: https://kaifayun.com 第一章:DeepSeek代码质量评估的底层逻辑与核心价值 DeepSeek代码质量评估并非简单地统计行数或检测语法错误,而是基于多维语义理解构建的推理系统。其底层逻辑融合了静态分析、符号执行与大语言模型生成式…...

C语言双端队列完整实现:一行代码吃透头尾操作,算法效率拉满
一、为什么C语言实现双端队列,是数据结构的必学天花板?在C语言数据结构里,队列、栈都是基础中的基础,但真正能把灵活度、效率、内存管理三者揉到一起的,还得是双端队列(deque)。普通队列只能一头…...

从Office功能区的“局外人“到“掌控者“:Office RibbonX Editor深度指南
从Office功能区的"局外人"到"掌控者":Office RibbonX Editor深度指南 【免费下载链接】office-ribbonx-editor An overhauled fork of the original Custom UI Editor for Microsoft Office, built with WPF 项目地址: https://gitcode.com/g…...

3PEAK思瑞浦 TPA6531-S5TR SOT23-5 运算放大器
特性 供电电压:1.75V至5.5V 偏移电压:1.5mV(最大值) 最大可调工作频率:300kHz,斜率:0.15V/us 轨到轨输入和输出 0.1赫兹至10赫兹电压噪声:1伏峰值 开关电源时无显著输出抖动 低功耗:每通道最大25安培 工作温度范围:-40C至125C...

TII投稿避坑指南:LaTeX模板编译报错‘xxx-eps-converted-to.pdf not found’的终极解决方案
TII投稿LaTeX避坑实战:从编译报错到完美PDF生成的终极指南 凌晨三点的实验室,屏幕上闪烁的xxx-eps-converted-to.pdf not found错误提示仿佛在嘲笑你连续八小时的徒劳尝试。这不是科幻场景,而是每位用LaTeX撰写TII论文的研究者都可能遭遇的真…...
:从MMLU到GPQA、从AIME到LiveCodeBench,一表看透真实能力边界)
DeepSeek模型选型终极指南(附完整Benchmark Excel模板):从MMLU到GPQA、从AIME到LiveCodeBench,一表看透真实能力边界
更多请点击: https://intelliparadigm.com 第一章:DeepSeek模型选型终极指南(附完整Benchmark Excel模板):从MMLU到GPQA、从AIME到LiveCodeBench,一表看透真实能力边界 选择适配业务场景的DeepSeek模型&am…...
:openclaw agent 如何触发一次 Agent 运行?)
OpenClaw 源码解析(六):openclaw agent 如何触发一次 Agent 运行?
1. 本期要解决的问题 前几期我们已经从项目整体结构、CLI 命令体系、配置加载、Gateway 运行机制等角度理解了 OpenClaw 的基础框架。到了这一期,可以进一步进入 OpenClaw 最核心的使用动作:用户在终端中执行一条 openclaw agent --message "...&q…...

WSABuilds安装挑战:从“包注册失败“到“架构不匹配“的完整解决指南
WSABuilds安装挑战:从"包注册失败"到"架构不匹配"的完整解决指南 【免费下载链接】WSABuilds Run Windows Subsystem For Android on your Windows 10 and Windows 11 PC using prebuilt binaries with Google Play Store (MindTheGapps) and/o…...

5.18~5.24补题
牛客周赛Round 144 A.我是谁?牛客周赛Round 144 B.我是清楚姐姐牛客周赛Round 144 C.其实我是小苯 牛客周赛Round 144 D.骗你的,其实我是小红牛客周赛Round 144 E.好吧,我是BingbongSMU Spring 2026 Round 4 ASMU Spring 2026 Round 4 BSMU S…...