RTX3060 FP64测试与猜想
RTX3060 FP64测试与猜想
- 一.小结
- 二.查看FP64的峰值性能
- 三.打满FP64、FP32的利用率,对比差异
- 四.进一步证明pipe_fp64_cycles_active并不是2个fp64 core的metrics
RTX3060 FP64测试与猜想
一.小结
- RTX3060 compute capability为8.6,每个SM有2个FP64 core。每个cycle可输出2个fp64的结果
- RTX3060 有4个subcore,这2个core怎么给4个sub_core分呢
- 执行FP64 DADD指令时,MIO PQ利用率超20%(FADD指令不存在该现象),且fp64 pipe的利用率最多为84%
- 每个smsp 执行一条DADD warp指令 pipe_fp64_cycles_active 增加16个cycle,4个smsp一起运行一条DADD warp指令仍是16个cycle
- 猜测:
- smsp按 1DADD/cycle 交替发送给2个FP64 core,一个warp需要16个cycle(32inst/16cycle->2inst/cycle)
- 如果4个sub core同时按这个速度发,则超过了FP64的处理能力(8inst/cycle > 2inst/cycle),但pipe_fp64_cycles_active没有增加
- 说明,在发射FP64指令之前会检测资源的可用性,如果不足,则不发射,pipe_fp64_cycles_active也就不会增加
- 也就解释了4个sub core一起执行时,pipe_fp64_cycles_active.max还是16个cycle
- 执行FP64指令时,4个subcore通过MIO共享FP64实际的执行单元
二.查看FP64的峰值性能
tee fp64_peak_sustained.cu<<-'EOF'
#include <cuda_runtime.h>
#include <cuda.h>
__global__ void fake_kernel(){}
int main(int argc,char *argv[])
{fake_kernel<<<1, 1>>>();cudaDeviceSynchronize();
}
EOF
/usr/local/cuda/bin/nvcc -std=c++17 -arch=sm_86 -lineinfo  -o fp64_peak_sustained fp64_peak_sustained.cu \-I /usr/local/cuda/include -L /usr/local/cuda/lib64 -lcuda
/usr/local/NVIDIA-Nsight-Compute/ncu --metrics \
sm__sass_thread_inst_executed_op_fp64_pred_on.avg.peak_sustained,\
sm__sass_thread_inst_executed_op_fp64_pred_on.sum.peak_sustained ./fp64_peak_sustained
输出
fake_kernel() (1, 1, 1)x(1, 1, 1), Context 1, Stream 7, Device 0, CC 8.6
Section: Command line profiler metrics
---------------------------------------------------------------- ----------- ------------
Metric Name                                                      Metric Unit Metric Value
---------------------------------------------------------------- ----------- ------------
sm__sass_thread_inst_executed_op_fp64_pred_on.avg.peak_sustained  inst/cycle            2  #每个sm的峰值性能
sm__sass_thread_inst_executed_op_fp64_pred_on.sum.peak_sustained  inst/cycle           56  #28个sm
---------------------------------------------------------------- ----------- ------------
- 2 FP64 cores in devices of compute capability 8.6, 8.7 and 8.9
- 问题:这2个core怎么给4个sub_core分呢?
三.打满FP64、FP32的利用率,对比差异
tee fp64_test.cu<<-'EOF'
#include <iostream>
#include <cuda_runtime.h>
#include <iostream>
#include <vector>
#include <stdio.h>
#include <assert.h>
#include <cstdio>
#include <cuda.h>__global__ void kernel_add_float(volatile float *input,volatile float *output)
{unsigned int tid  = threadIdx.x + blockIdx.x * blockDim.x;float l=input[tid];float r=output[tid];for(int i=0;i<256;i++){l-=r;} input[tid]=l;
}
__global__ void kernel_add_double(volatile double *input,volatile double *output)
{unsigned int tid  = threadIdx.x + blockIdx.x * blockDim.x;double left=input[tid];double right=output[tid];for(int i=0;i<256;i++){left+=right;}       output[tid]=left;
}
EOF/usr/local/cuda/bin/nvcc -std=c++17 -dc -lineinfo -arch=sm_86 -ptx fp64_test.cu -o fp64_test.ptx
/usr/local/cuda/bin/nvcc -arch=sm_86 fp64_test.ptx -cubin -o fp64_test.cubin
/usr/local/cuda/bin/nvcc -arch=sm_86 fp64_test.cubin -fatbin -o fp64_test.fatbin
cat fp64_test.ptx
/usr/local/cuda/bin/cuobjdump --dump-sass fp64_test.fatbin# 删掉除DADD、FADD以外的指令
cuasm.py fp64_test.cubin fp64_test.cuasm
sed '/MOV/d' -i fp64_test.cuasm
sed '/S2R/d' -i fp64_test.cuasm
sed '/ULDC/d' -i fp64_test.cuasm
sed '/IMAD/d' -i fp64_test.cuasm
sed '/LDG/d' -i fp64_test.cuasm
sed '/STG/d' -i fp64_test.cuasm
sed '/F2F/d' -i fp64_test.cuasmcuasm.py fp64_test.cuasm
/usr/local/cuda/bin/nvcc -arch=sm_86 fp64_test.cubin -fatbin -o fp64_test.fatbin
/usr/local/cuda/bin/cuobjdump --dump-sass fp64_test.fatbin
/usr/local/cuda/bin/cuobjdump --dump-resource-usage fp64_test.fatbintee fp64_test_main.cpp<<-'EOF'
#include <stdio.h>
#include <string.h>
#include <cuda_runtime.h>
#include <cuda.h>int main(int argc,char *argv[])
{CUresult error;CUdevice cuDevice;cuInit(0);int deviceCount = 0;error = cuDeviceGetCount(&deviceCount);error = cuDeviceGet(&cuDevice, 0);if(error!=CUDA_SUCCESS){printf("Error happened in get device!\n");}CUcontext cuContext;error = cuCtxCreate(&cuContext, 0, cuDevice);if(error!=CUDA_SUCCESS){printf("Error happened in create context!\n");}int block_count=28*1000;int block_size=32*4*4;int thread_size=block_count*block_size;int data_size=sizeof(double)*thread_size;double *output_ptr=nullptr;double *input_ptr=nullptr;int cudaStatus=0;cudaStatus = cudaMalloc((void**)&input_ptr, data_size);cudaStatus = cudaMalloc((void**)&output_ptr, data_size);void *kernelParams[]= {(void*)&output_ptr, (void*)&input_ptr};CUmodule module;CUfunction double_function;CUfunction float_function;const char* module_file = "fp64_test.fatbin";const char* double_kernel_name = "_Z17kernel_add_doublePVdS0_";const char* float_kernel_name = "_Z16kernel_add_floatPVfS0_";error = cuModuleLoad(&module, module_file);if(error!=CUDA_SUCCESS){printf("Error happened in load moudle %d!\n",error);}error = cuModuleGetFunction(&double_function, module, double_kernel_name);if(error!=CUDA_SUCCESS){printf("get double_function error!\n");}error = cuModuleGetFunction(&float_function, module, float_kernel_name);if(error!=CUDA_SUCCESS){printf("get float_kernel_name error!\n");}    cuLaunchKernel(double_function,block_count, 1, 1,block_size, 1, 1,0,0,kernelParams, 0);cuLaunchKernel(float_function,block_count, 1, 1,block_size, 1, 1,0,0,kernelParams, 0);cudaFree(output_ptr);cudaFree(input_ptr);cuModuleUnload(module);cuCtxDestroy(cuContext);return 0;
}
EOF
g++ fp64_test_main.cpp -o fp64_test_main -I /usr/local/cuda/include -L /usr/local/cuda/lib64 -lcudart -lcuda
/usr/local/NVIDIA-Nsight-Compute/ncu --metrics \
sm__inst_executed.avg.pct_of_peak_sustained_elapsed,\
smsp__inst_issued.sum,\
sm__issue_active.avg.pct_of_peak_sustained_elapsed,\
sm__pipe_fma_cycles_active.avg.pct_of_peak_sustained_elapsed,\
sm__pipe_fmaheavy_cycles_active.avg.pct_of_peak_sustained_elapsed,\
sm__inst_executed_pipe_cbu_pred_on_any.avg.pct_of_peak_sustained_elapsed,\
sm__mio_inst_issued.avg.pct_of_peak_sustained_elapsed,\
sm__mio_pq_read_cycles_active.avg.pct_of_peak_sustained_elapsed,\
sm__mio_pq_write_cycles_active.avg.pct_of_peak_sustained_elapsed,\
sm__mio_pq_write_cycles_active_pipe_lsu.avg.pct_of_peak_sustained_elapsed,\
sm__mio_pq_write_cycles_active_pipe_tex.avg.pct_of_peak_sustained_elapsed,\
sm__mioc_inst_issued.avg.pct_of_peak_sustained_elapsed,\
sm__mio_inst_issued.avg.pct_of_peak_sustained_elapsed,\
sm__pipe_fp64_cycles_active.avg.pct_of_peak_sustained_elapsed ./fp64_test_main
输出
kernel_add_double(volatile double *, volatile double *) (28000, 1, 1)x(512, 1, 1), Context 1, Stream 7, Device 0, CC 8.6
Section: Command line profiler metrics
------------------------------------------------------------------------- ----------- ------------
Metric Name                                                               Metric Unit Metric Value
------------------------------------------------------------------------- ----------- ------------
sm__inst_executed.avg.pct_of_peak_sustained_elapsed                                 %         1.32
sm__inst_executed_pipe_cbu_pred_on_any.avg.pct_of_peak_sustained_elapsed            %         0.02
sm__issue_active.avg.pct_of_peak_sustained_elapsed                                  %         1.32
sm__mio_inst_issued.avg.pct_of_peak_sustained_elapsed                               %         3.51
sm__mio_pq_read_cycles_active.avg.pct_of_peak_sustained_elapsed                     %            0
sm__mio_pq_write_cycles_active.avg.pct_of_peak_sustained_elapsed                    %        21.05
sm__mio_pq_write_cycles_active_pipe_lsu.avg.pct_of_peak_sustained_elapsed           %            0
sm__mio_pq_write_cycles_active_pipe_tex.avg.pct_of_peak_sustained_elapsed           %        21.05 # of cycles where register operands from the register file werewritten to MIO PQ, for the tex pipe
sm__mioc_inst_issued.avg.pct_of_peak_sustained_elapsed                              %         1.32
sm__pipe_fma_cycles_active.avg.pct_of_peak_sustained_elapsed                        %            0
sm__pipe_fmaheavy_cycles_active.avg.pct_of_peak_sustained_elapsed                   %            0
sm__pipe_fp64_cycles_active.avg.pct_of_peak_sustained_elapsed                       %        84.21  #利用率打不满
smsp__inst_issued.sum                                                            inst  115,136,000  #跟fp32相同的指令条数
------------------------------------------------------------------------- ----------- ------------kernel_add_float(volatile float *, volatile float *) (28000, 1, 1)x(512, 1, 1), Context 1, Stream 7, Device 0, CC 8.6
Section: Command line profiler metrics
------------------------------------------------------------------------- ----------- ------------
Metric Name                                                               Metric Unit Metric Value
------------------------------------------------------------------------- ----------- ------------
sm__inst_executed.avg.pct_of_peak_sustained_elapsed                                 %        99.76
sm__inst_executed_pipe_cbu_pred_on_any.avg.pct_of_peak_sustained_elapsed            %         1.55
sm__issue_active.avg.pct_of_peak_sustained_elapsed                                  %        99.76
sm__mio_inst_issued.avg.pct_of_peak_sustained_elapsed                               %            0
sm__mio_pq_read_cycles_active.avg.pct_of_peak_sustained_elapsed                     %            0
sm__mio_pq_write_cycles_active.avg.pct_of_peak_sustained_elapsed                    %            0
sm__mio_pq_write_cycles_active_pipe_lsu.avg.pct_of_peak_sustained_elapsed           %            0
sm__mio_pq_write_cycles_active_pipe_tex.avg.pct_of_peak_sustained_elapsed           %            0
sm__mioc_inst_issued.avg.pct_of_peak_sustained_elapsed                              %         0.39
sm__pipe_fma_cycles_active.avg.pct_of_peak_sustained_elapsed                        %        99.37
sm__pipe_fmaheavy_cycles_active.avg.pct_of_peak_sustained_elapsed                   %        99.37
sm__pipe_fp64_cycles_active.avg.pct_of_peak_sustained_elapsed                       %            0
smsp__inst_issued.sum                                                            inst  115,136,000
------------------------------------------------------------------------- ----------- ------------
*猜测,sm__pipe_fp64_cycles_active并不是那2个FP64 core的metrics,而是smsp里通往fp64 core的接口模块的活动cycle数
*4个subcore里的fp64接口模块,连接到2个fp64 core,并且经过了mio模块.因此,无法打满fp64的利用率
四.进一步证明pipe_fp64_cycles_active并不是2个fp64 core的metrics
tee fp64_test.cu<<-'EOF'
#include <iostream>
#include <cuda_runtime.h>
#include <iostream>
#include <vector>
#include <stdio.h>
#include <assert.h>
#include <cstdio>
#include <cuda.h>__global__ void kernel_add_double(volatile double *input,volatile double *output)
{unsigned int tid  = threadIdx.x + blockIdx.x * blockDim.x;double left=input[tid];double right=output[tid];for(int i=0;i<1;i++){left+=right;}       output[tid]=left;
}
EOF/usr/local/cuda/bin/nvcc -std=c++17 -dc -lineinfo -arch=sm_86 -ptx fp64_test.cu -o fp64_test.ptx
/usr/local/cuda/bin/nvcc -arch=sm_86 fp64_test.ptx -cubin -o fp64_test.cubin
/usr/local/cuda/bin/nvcc -arch=sm_86 fp64_test.cubin -fatbin -o fp64_test.fatbin
cat fp64_test.ptx
/usr/local/cuda/bin/cuobjdump --dump-sass fp64_test.fatbincuasm.py fp64_test.cubin fp64_test.cuasm
sed '/MOV/d' -i fp64_test.cuasm
sed '/S2R/d' -i fp64_test.cuasm
sed '/ULDC/d' -i fp64_test.cuasm
sed '/IMAD/d' -i fp64_test.cuasm
sed '/LDG/d' -i fp64_test.cuasm
sed '/STG/d' -i fp64_test.cuasm
sed '/F2F/d' -i fp64_test.cuasmcuasm.py fp64_test.cuasm
/usr/local/cuda/bin/nvcc -arch=sm_86 fp64_test.cubin -fatbin -o fp64_test.fatbin
/usr/local/cuda/bin/cuobjdump --dump-sass fp64_test.fatbin
/usr/local/cuda/bin/cuobjdump --dump-resource-usage fp64_test.fatbintee fp64_test_main.cpp<<-'EOF'
#include <stdio.h>
#include <string.h>
#include <cuda_runtime.h>
#include <cuda.h>int main(int argc,char *argv[])
{CUresult error;CUdevice cuDevice;cuInit(0);int deviceCount = 0;error = cuDeviceGetCount(&deviceCount);error = cuDeviceGet(&cuDevice, 0);if(error!=CUDA_SUCCESS){printf("Error happened in get device!\n");}CUcontext cuContext;error = cuCtxCreate(&cuContext, 0, cuDevice);if(error!=CUDA_SUCCESS){printf("Error happened in create context!\n");}int block_count=1;int block_size=32*4*4;int thread_size=block_count*block_size;int data_size=sizeof(double)*thread_size;double *output_ptr=nullptr;double *input_ptr=nullptr;int cudaStatus=0;cudaStatus = cudaMalloc((void**)&input_ptr, data_size);cudaStatus = cudaMalloc((void**)&output_ptr, data_size);void *kernelParams[]= {(void*)&output_ptr, (void*)&input_ptr};CUmodule module;CUfunction double_function;const char* module_file = "fp64_test.fatbin";const char* double_kernel_name = "_Z17kernel_add_doublePVdS0_";error = cuModuleLoad(&module, module_file);if(error!=CUDA_SUCCESS){printf("Error happened in load moudle %d!\n",error);}error = cuModuleGetFunction(&double_function, module, double_kernel_name);if(error!=CUDA_SUCCESS){printf("get float_kernel_name error!\n");}    cuLaunchKernel(double_function,block_count, 1, 1,8, 1, 1,0,0,kernelParams, 0);cuLaunchKernel(double_function,block_count, 1, 1,16, 1, 1,0,0,kernelParams, 0);cuLaunchKernel(double_function,block_count, 1, 1,32, 1, 1,0,0,kernelParams, 0);cuLaunchKernel(double_function,block_count, 1, 1,32*2, 1, 1,0,0,kernelParams, 0);cuLaunchKernel(double_function,block_count, 1, 1,32*4, 1, 1,0,0,kernelParams, 0);cuLaunchKernel(double_function,block_count, 1, 1,32*5, 1, 1,0,0,kernelParams, 0);cuLaunchKernel(double_function,block_count, 1, 1,32*4*8, 1, 1,0,0,kernelParams, 0);cudaFree(output_ptr);cudaFree(input_ptr);cuModuleUnload(module);cuCtxDestroy(cuContext);return 0;
}
EOF
g++ fp64_test_main.cpp -o fp64_test_main -I /usr/local/cuda/include -L /usr/local/cuda/lib64 -lcudart -lcuda/usr/local/NVIDIA-Nsight-Compute/ncu --metrics smsp__pipe_fp64_cycles_active ./fp64_test_main
输出
kernel_add_double(volatile double *, volatile double *) (1, 1, 1)x(8, 1, 1), Context 1, Stream 7, Device 0, CC 8.6
Section: Command line profiler metrics
--------------------------------- ----------- ------------
Metric Name                       Metric Unit Metric Value
--------------------------------- ----------- ------------
smsp__pipe_fp64_cycles_active.avg       cycle         0.14
smsp__pipe_fp64_cycles_active.max       cycle           16
smsp__pipe_fp64_cycles_active.min       cycle            0
smsp__pipe_fp64_cycles_active.sum       cycle           16
--------------------------------- ----------- ------------kernel_add_double(volatile double *, volatile double *) (1, 1, 1)x(16, 1, 1), Context 1, Stream 7, Device 0, CC 8.6
Section: Command line profiler metrics
--------------------------------- ----------- ------------
Metric Name                       Metric Unit Metric Value
--------------------------------- ----------- ------------
smsp__pipe_fp64_cycles_active.avg       cycle         0.14
smsp__pipe_fp64_cycles_active.max       cycle           16  #不足一个warp跟一个warp 的pipe_fp64_cycles_active一样,说明存在无效计算
smsp__pipe_fp64_cycles_active.min       cycle            0
smsp__pipe_fp64_cycles_active.sum       cycle           16
--------------------------------- ----------- ------------kernel_add_double(volatile double *, volatile double *) (1, 1, 1)x(32, 1, 1), Context 1, Stream 7, Device 0, CC 8.6
Section: Command line profiler metrics
--------------------------------- ----------- ------------
Metric Name                       Metric Unit Metric Value
--------------------------------- ----------- ------------
smsp__pipe_fp64_cycles_active.avg       cycle         0.14
smsp__pipe_fp64_cycles_active.max       cycle           16
smsp__pipe_fp64_cycles_active.min       cycle            0
smsp__pipe_fp64_cycles_active.sum       cycle           16
--------------------------------- ----------- ------------kernel_add_double(volatile double *, volatile double *) (1, 1, 1)x(64, 1, 1), Context 1, Stream 7, Device 0, CC 8.6
Section: Command line profiler metrics
--------------------------------- ----------- ------------
Metric Name                       Metric Unit Metric Value
--------------------------------- ----------- ------------
smsp__pipe_fp64_cycles_active.avg       cycle         0.29
smsp__pipe_fp64_cycles_active.max       cycle           16
smsp__pipe_fp64_cycles_active.min       cycle            0
smsp__pipe_fp64_cycles_active.sum       cycle           32
--------------------------------- ----------- ------------kernel_add_double(volatile double *, volatile double *) (1, 1, 1)x(128, 1, 1), Context 1, Stream 7, Device 0, CC 8.6
Section: Command line profiler metrics
--------------------------------- ----------- ------------
Metric Name                       Metric Unit Metric Value
--------------------------------- ----------- ------------
smsp__pipe_fp64_cycles_active.avg       cycle         0.57
smsp__pipe_fp64_cycles_active.max       cycle           16
smsp__pipe_fp64_cycles_active.min       cycle            0
smsp__pipe_fp64_cycles_active.sum       cycle           64
--------------------------------- ----------- ------------kernel_add_double(volatile double *, volatile double *) (1, 1, 1)x(160, 1, 1), Context 1, Stream 7, Device 0, CC 8.6
Section: Command line profiler metrics
--------------------------------- ----------- ------------
Metric Name                       Metric Unit Metric Value
--------------------------------- ----------- ------------
smsp__pipe_fp64_cycles_active.avg       cycle         0.71
smsp__pipe_fp64_cycles_active.max       cycle           32
smsp__pipe_fp64_cycles_active.min       cycle            0
smsp__pipe_fp64_cycles_active.sum       cycle           80
--------------------------------- ----------- ------------kernel_add_double(volatile double *, volatile double *) (1, 1, 1)x(1024, 1, 1), Context 1, Stream 7, Device 0, CC 8.6
Section: Command line profiler metrics
--------------------------------- ----------- ------------
Metric Name                       Metric Unit Metric Value
--------------------------------- ----------- ------------
smsp__pipe_fp64_cycles_active.avg       cycle         4.57
smsp__pipe_fp64_cycles_active.max       cycle          128
smsp__pipe_fp64_cycles_active.min       cycle            0
smsp__pipe_fp64_cycles_active.sum       cycle          512 #每个smsp 执行一个warp的fp64需要16个pipe_fp64_cycles_active
--------------------------------- ----------- ------------
- 如果是2个fp64 cores的metrics,不会出现这样的现象
相关文章:

RTX3060 FP64测试与猜想
RTX3060 FP64测试与猜想 一.小结二.查看FP64的峰值性能三.打满FP64、FP32的利用率,对比差异四.进一步证明pipe_fp64_cycles_active并不是2个fp64 core的metrics RTX3060 FP64测试与猜想 一.小结 RTX3060 compute capability为8.6,每个SM有2个FP64 core。每个cycle可输出2个fp…...

uniapp写移动端常见问题汇总
1. 手机顶部状态栏遮挡 写在需要的地方 <view class"status_bar" style"height: var(--status-bar-height); width: 100%;">2. 手机顶部状态栏字体颜色 // pages.json "statusBarStyle": "light",3. 背景覆盖全屏 page{widt…...
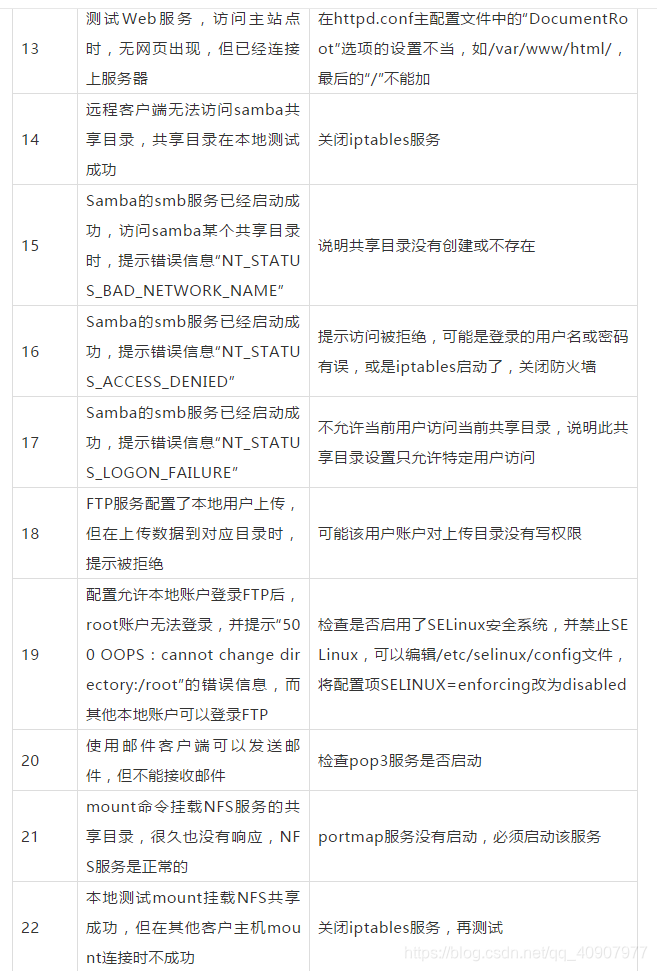
Linux运维排查常见故障_在tmp目录下有大量包含picture_ 的临时文件,每天晚上2 30需要对一天前的文件进行
echo“”>>/etc/security/limits.conf echo“*softnproc65535″>>/etc/security/limits.conf echo“*hardnproc65535″>>/etc/security/limits.conf echo“*softnofile65535″>>/etc/security/limits.conf echo“*hardnofile65535″>>/etc/secur…...
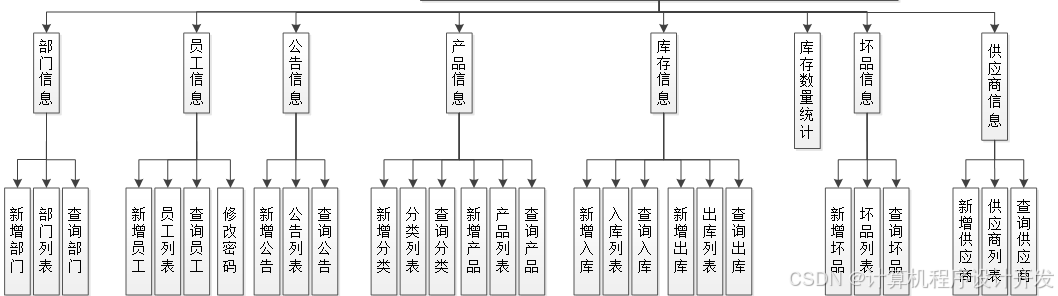
基于SpringBoot的智能制造云平台系统的设计与实现计算机毕设
一、选题背景与意义(300字左右) 根据工业4.0智能制造生态链中云工厂在实际生产当中的工作流程进行充分调研和整理出来的,描述最终用户在本系统中对于生产订单的处理、排产、以及生产的完整在线处理流程和业务需求的文档。 针对制造业而言&a…...
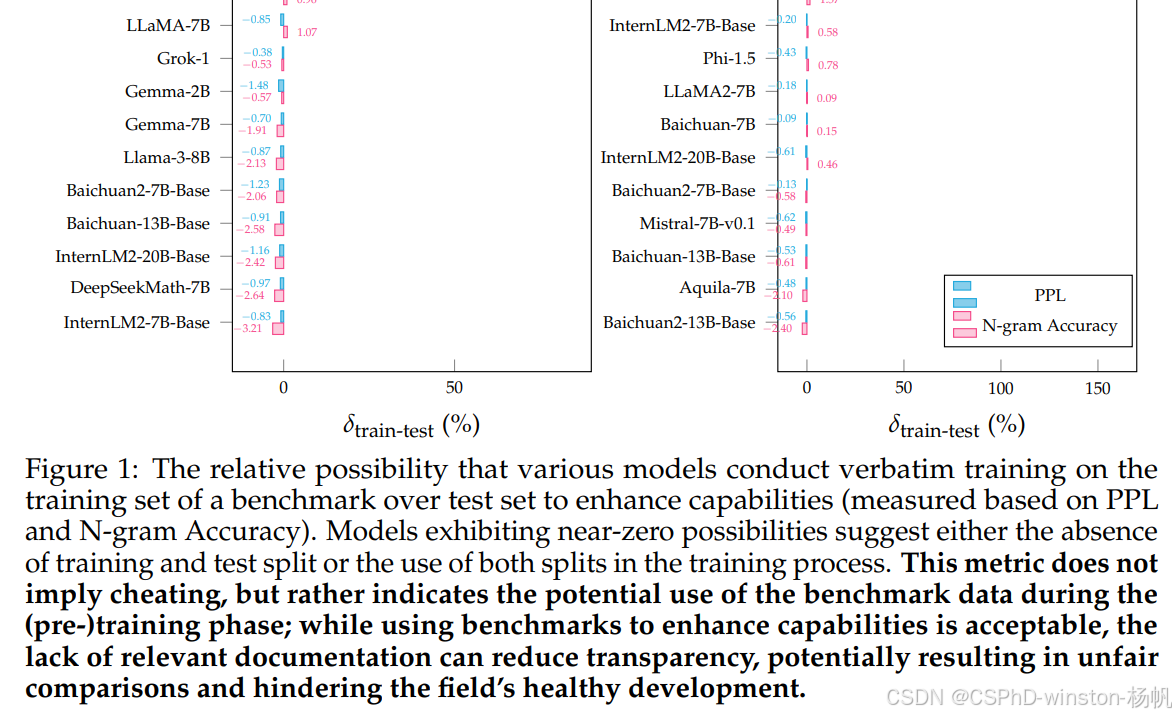
论文翻译:arxiv-2024 Benchmarking Benchmark Leakage in Large Language Models
Benchmarking Benchmark Leakage in Large Language Models https://arxiv.org/abs/2404.18824 在大型语言模型中基准测试泄露的基准测试 文章目录 在大型语言模型中基准测试泄露的基准测试摘要1 引言 图1:不同模型在基准测试的训练集上进行逐字训练相对于测试集以…...
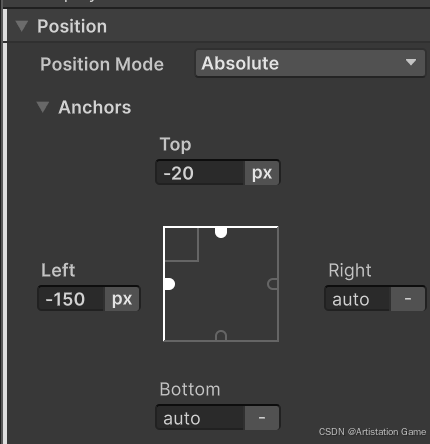
十二、新版UI
一、UI Toolkit 这个组件是新版的UI系统 创建了一个新的UIBuild,在单独的场景中打开 未来Unity会以这个为基准。 缺点:目前没有Animator,做不了动画;没法加shader...
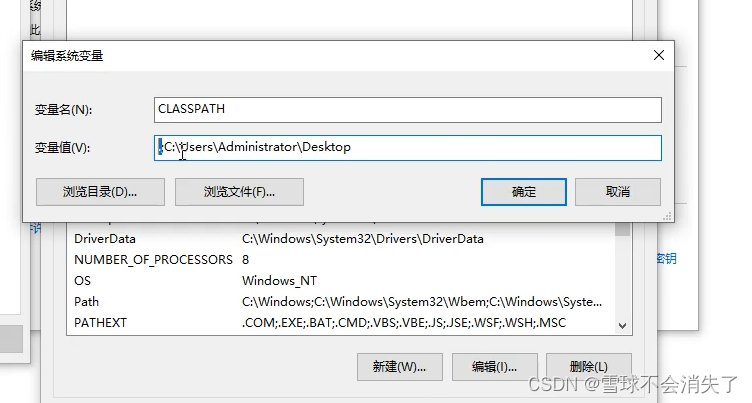
Path系统环境变量和CLASSPATH环境变量
Path系统环境变量 概述:Path环境变量不是java的,它隶属于windows操作系统 作用: PATH环境变量实际上就是给windows操作系统指路的。 在Path环境变量中有很多路径,路径和路径之间采用 分号(;) 隔开在DOS命令窗口中输入一条DOS命…...

自然语言处理系列六十六》对话机器人项目实战》对话机器人原理与介绍
注:此文章内容均节选自充电了么创始人,CEO兼CTO陈敬雷老师的新书《自然语言处理原理与实战》(人工智能科学与技术丛书)【陈敬雷编著】【清华大学出版社】 文章目录 自然语言处理系列六十六对话机器人项目实战》对话机器人原理与介…...
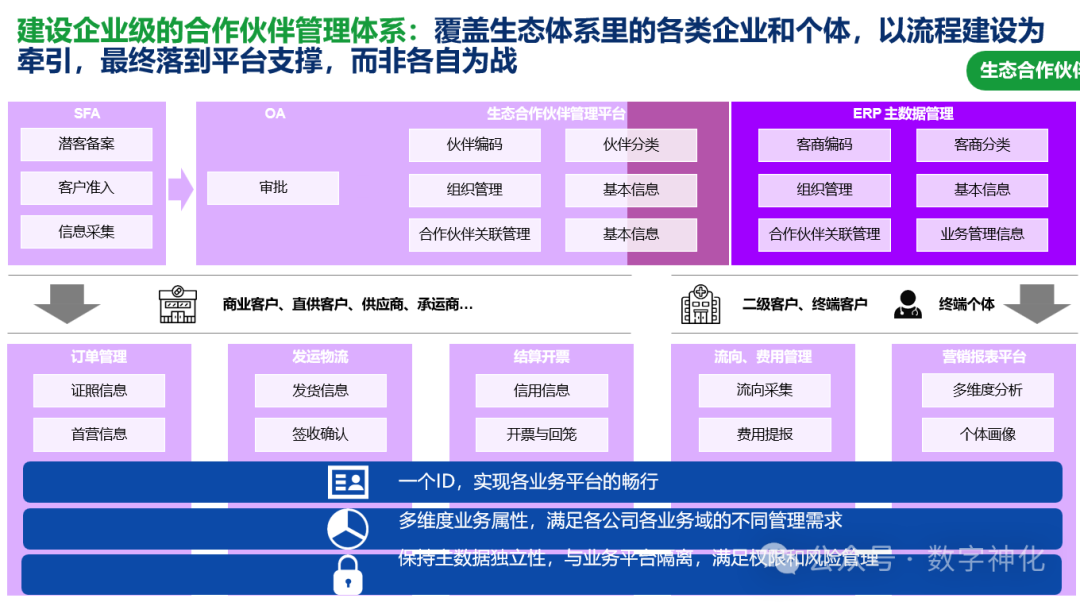
解码数字化转型顶层规划(附236页PPT:xx企业数字化转型项目顶层规划方案)
写在前面:PPT分享见后文~ 企业数字化转型顶层规划的制定是一个系统性的过程,需要综合考虑多个方面。以下是制定企业数字化转型顶层规划的一些关键步骤和要点,以供参考: 1、明确数字化转型战略定位: 将数字化转型作为…...

无需温度修正,测值准确可靠 GEO ACxxxx型振弦式锚索测力计
无需温度修正,测值准确可靠 GEO ACxxxx型振弦式锚索测力计 精准稳定的振弦式传感器,ACxxxx型振弦式锚索测力计,是长期监测预应力锚索压力的不二选择。采用特制应变计作为传感部件,无需温度修正,测值准确可靠。该传感器…...

shell脚本【一、 特殊变量/子串/特殊扩展变量/父子shell/内置命令、外置命令】
特殊变量 位置参数的获取 $0 获取shell脚本文件名,以及脚本路径;$n 获取shell脚本的第n个参数,n在1~9之间,如$1$2$9,大于9则需要写 ${10};$# 获取执行的shell脚本后面的参数总个数;$* 获取she…...
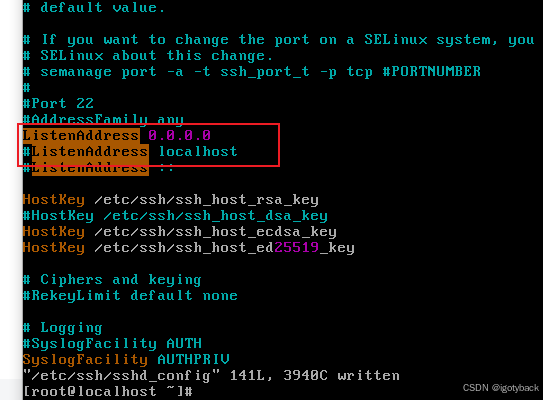
服务器禁用远程(22)
vim /etc/ssh/sshd_config 修改 ListenAddress 0.0.0.0 为ListenAddress localhost 修改完后 重启一下sshd systemctl restart sshd 修改就生效了...

Docker 进阶构建:镜像、网络与仓库管理
目录 三. docker镜像构建 1. docker镜像结构 2. 镜像运行的基本原理 3. 镜像获得方式 4. 镜像构建 5. Dockerfile实例 6. 镜像优化方案 6.1. 镜像优化策略 6.2. 镜像优化示例:缩减镜像层 6.3. 镜像优化示例:多阶段构建 6.4. 镜像优化示例:使用最精简镜像 四. docke…...

opencv学习:图像轮廓识别及代码实现
图像轮廓 1.获取图像轮廓 cv2.findContours() 函数是 OpenCV 库中用于检测图像中轮廓的函数。它可以检测到图像中所有连通区域的边界,并返回这些轮廓的列表。从 OpenCV 3.4 版本开始,这个函数的返回值和参数有所变化,以下是详细的参数说明&…...
)
存储课程学习笔记2_借助内核插入一个文件系统,用文件夹下测试文件系统(mount文件系统到目录下是入口)
裸盘是如何能达到我们日常操作目录那样,按目录依次访问文件等,实际上就是基于裸盘上,用文件系统进行控制。 0:总结。 0:mount是入口,一个裸盘先赋予文件系统,然后mount后才可以用。 1…...

chunk-vendors.js 文件过大导致页面加载缓慢解决方案
1、路由懒加载 在 Webpack 中,我们可以使用动态 import语法来定义代码分块点 (split point): import(./Foo.vue) // 返回 Promise如果您使用的是 Babel,你将需要添加 syntax-dynamic-import 插件,才能使 Babel 可以正确地解析语…...
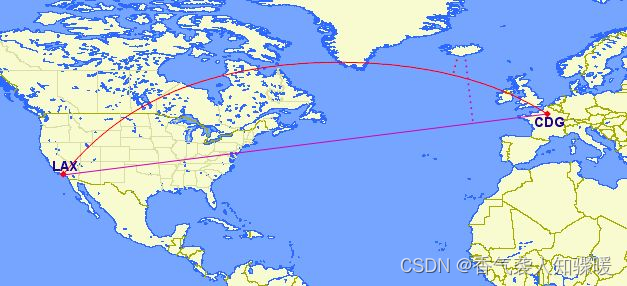
【Postgresql】地理空间数据的存储与查询,查询效率优化策略,数据类型与查询速度的影响
注:使用postgresql数据库会用到PostGIS 扩展。 一、安装PostGIS 扩展 在 PostgreSQL 中遇到错误 “type geography does not exist” 通常意味着你的 PostgreSQL 数据库还没有安装 PostGIS 扩展,或者 PostGIS 扩展没有被正确地安装在你的数据库中。geo…...

设计模式应用
单例模式 RunTime类是单例模式的体现,getRunTime()方法会返回一个唯一的实例。确保程序中只有一个唯一的RunTime类对象建造者模式 StringBuilder和StringBuffer是建造者模式的体现工厂模式 Calender类中Calender.getInstance()方法 DriverManager.getConnection()方…...

Android开机启动流程
Android开机启动流程 systemReady启动"added application" frameworks/base/services/java/com/android/server/SystemServer.java mainnew SystemServer().run();startBootstrapServicesmActivityManagerService ActivityManagerService.Lifecycle.startService(…...
数据结构基本知识
一、什么是数据结构 1.1、组织存储数据 ---------》内存(存储) 1.2、研究目的 如何存储数据(变量,数组....)程序数据结构算法 1.3、常见保存数据的方法 数组:保存自己的数据指针:是间接访问已经存在的…...

校园项目 / 课程设计:如何包装成求职加分项
前言:你的校园项目,是不是写得像“课程作业汇报”? “完成课程设计《图书管理系统》,使用Java+MySQL开发,实现增删改查功能”——如果你还在这么写校园项目,恭喜你!成功加入“HR扫一眼就划走”豪华套餐。 现在的求职市场卷成什么样?某互联网大厂HR透露:“每天收到50…...

DBSwitch迁移踩坑记:当PostgreSQL的TRUNCATE语法遇上openGauss,我这样改源码
DBSwitch迁移实战:从PostgreSQL到openGauss的TRUNCATE语法改造之旅 在异构数据库迁移领域,DBSwitch作为一款高效的工具,能够实现不同数据库之间的数据流转。然而,当我们将目光投向PostgreSQL与openGauss这两种看似同源却存在微妙差…...

黑苹果终极简化方案:OpCore Simplify 让你的OpenCore配置变得前所未有的简单
黑苹果终极简化方案:OpCore Simplify 让你的OpenCore配置变得前所未有的简单 【免费下载链接】OpCore-Simplify A tool designed to simplify the creation of OpenCore EFI 项目地址: https://gitcode.com/GitHub_Trending/op/OpCore-Simplify 还在为复杂的…...

华硕笔记本性能控制终极指南:用GHelper轻松管理硬件性能
华硕笔记本性能控制终极指南:用GHelper轻松管理硬件性能 【免费下载链接】g-helper Lightweight Armoury Crate alternative for Asus laptops with nearly the same functionality. Works with ROG Zephyrus, Flow, TUF, Strix, Scar, ProArt, Vivobook, Zenbook, …...

Ventoy终极指南:一键制作万能启动盘的完整教程
Ventoy终极指南:一键制作万能启动盘的完整教程 【免费下载链接】Ventoy A new bootable USB solution. 项目地址: https://gitcode.com/GitHub_Trending/ve/Ventoy 你是否厌倦了每次安装系统都要重新格式化U盘?Ventoy是一款革命性的开源启动盘制作…...

区块链与计算机视觉融合:构建可信机器感知系统的架构与实践
1. 项目概述:当计算机视觉遇见区块链在人工智能的浪潮中,计算机视觉(CV)无疑是那颗最耀眼的明星之一。它让机器拥有了“看”和理解世界的能力,从医疗影像中精准定位病灶,到自动驾驶汽车识别路况,…...

3分钟告别网页图片格式烦恼:一键转换PNG/JPG/WebP的完整指南
3分钟告别网页图片格式烦恼:一键转换PNG/JPG/WebP的完整指南 【免费下载链接】Save-Image-as-Type Save Image as Type is an chrome extension which add Save as PNG / JPG / WebP to the context menu of image. 项目地址: https://gitcode.com/gh_mirrors/sa/…...

微软下周更新 Office 应用:允许禁用 Copilot 浮动按钮,回应用户控制需求
Office 更新:禁用 Copilot 浮动按钮微软将于下周推出 Office 应用更新,此次更新允许用户禁用浮动的 Copilot 按钮。近几周,该按钮已出现在 Word、Excel 和 PowerPoint 中,悬浮在电子表格或文档的右下角,给用户带来了诸…...

如何高效实现Android Studio中文界面革命性升级
如何高效实现Android Studio中文界面革命性升级 【免费下载链接】AndroidStudioChineseLanguagePack AndroidStudio中文插件(官方修改版本) 项目地址: https://gitcode.com/gh_mirrors/an/AndroidStudioChineseLanguagePack 你是否曾经因为Android Studio的英…...

终极Python金融数据接口:3步掌握免费高效的A股数据获取方案
终极Python金融数据接口:3步掌握免费高效的A股数据获取方案 【免费下载链接】mootdx 通达信数据读取的一个简便使用封装 项目地址: https://gitcode.com/GitHub_Trending/mo/mootdx 在金融数据分析和量化交易领域,获取准确、及时且成本可控的市场…...