时序预测SARIMAX模型
1. 项目背景
本文基于kaggle平台相关竞赛项目,具体连接如下:
Time Series Forecasting With SARIMAX
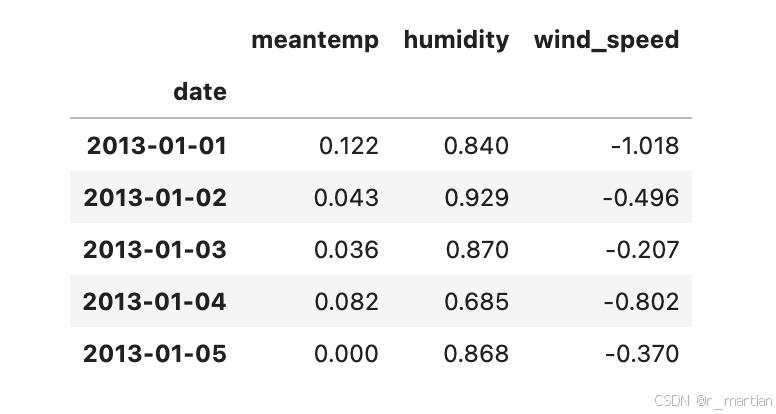
基本信息如内容说明、数据集、已提交代码、当前得分排名以及比赛规则等,如图【1】所示,可以认真阅读。
2. 数据读取
使用python得pandas包进行csv文件读取
# read train data
df = pd.read_csv("/kaggle/input/daily-climate-time-series-data/DailyDelhiClimateTrain.csv", parse_dates=['date'],  # change to date time formatindex_col="date")
df
2.1 数据信息图形化观测
定义图表模板,对不同维度的数据进行图形化分析。
# Get the 'xgridoff' template
grid_template = pio.templates['xgridoff']
grid_template.layout.font.color = 'black'  # Light gray font color# Adjust gridline color and width
grid_template.layout.xaxis.gridcolor = 'rgba(0, 0, 0, 0.3)'  # Light gray with transparency
grid_template.layout.yaxis.gridcolor = 'rgba(0, 0, 0, 0.3)'  # Light gray with transparency
grid_template.layout.xaxis.gridwidth = 1  # Set gridline width
grid_template.layout.yaxis.gridwidth = 1  # Set gridline width# Update Plotly templates with template
pio.templates['ts_template'] = grid_template# plot mean temperature, humidity, wind_speed, meanpressure for watch
fig_meantemp = px.line(df, x=df.index, y='meantemp', title='Mean Temperature Over Time')
fig_meantemp.update_layout(template='ts_template', title_x=0.5, xaxis_title="Date")
fig_meantemp.show()fig_humidity = px.line(df, x=df.index, y='humidity', title='Humidity Over Time')
fig_humidity.update_layout(template='ts_template', title_x=0.5, xaxis_title="Date")
fig_humidity.show()fig_wind_speed = px.line(df, x=df.index, y='wind_speed', title='Wind Speed Over Time')
fig_wind_speed.update_layout(template='ts_template', title_x=0.5, xaxis_title="Date")
fig_wind_speed.show()fig_meanpressure = px.line(df, x=df.index, y='meanpressure', title='Mean Pressure Over Time')
fig_meanpressure.update_layout(template='ts_template', title_x=0.5, xaxis_title="Date")
fig_meanpressure.show()

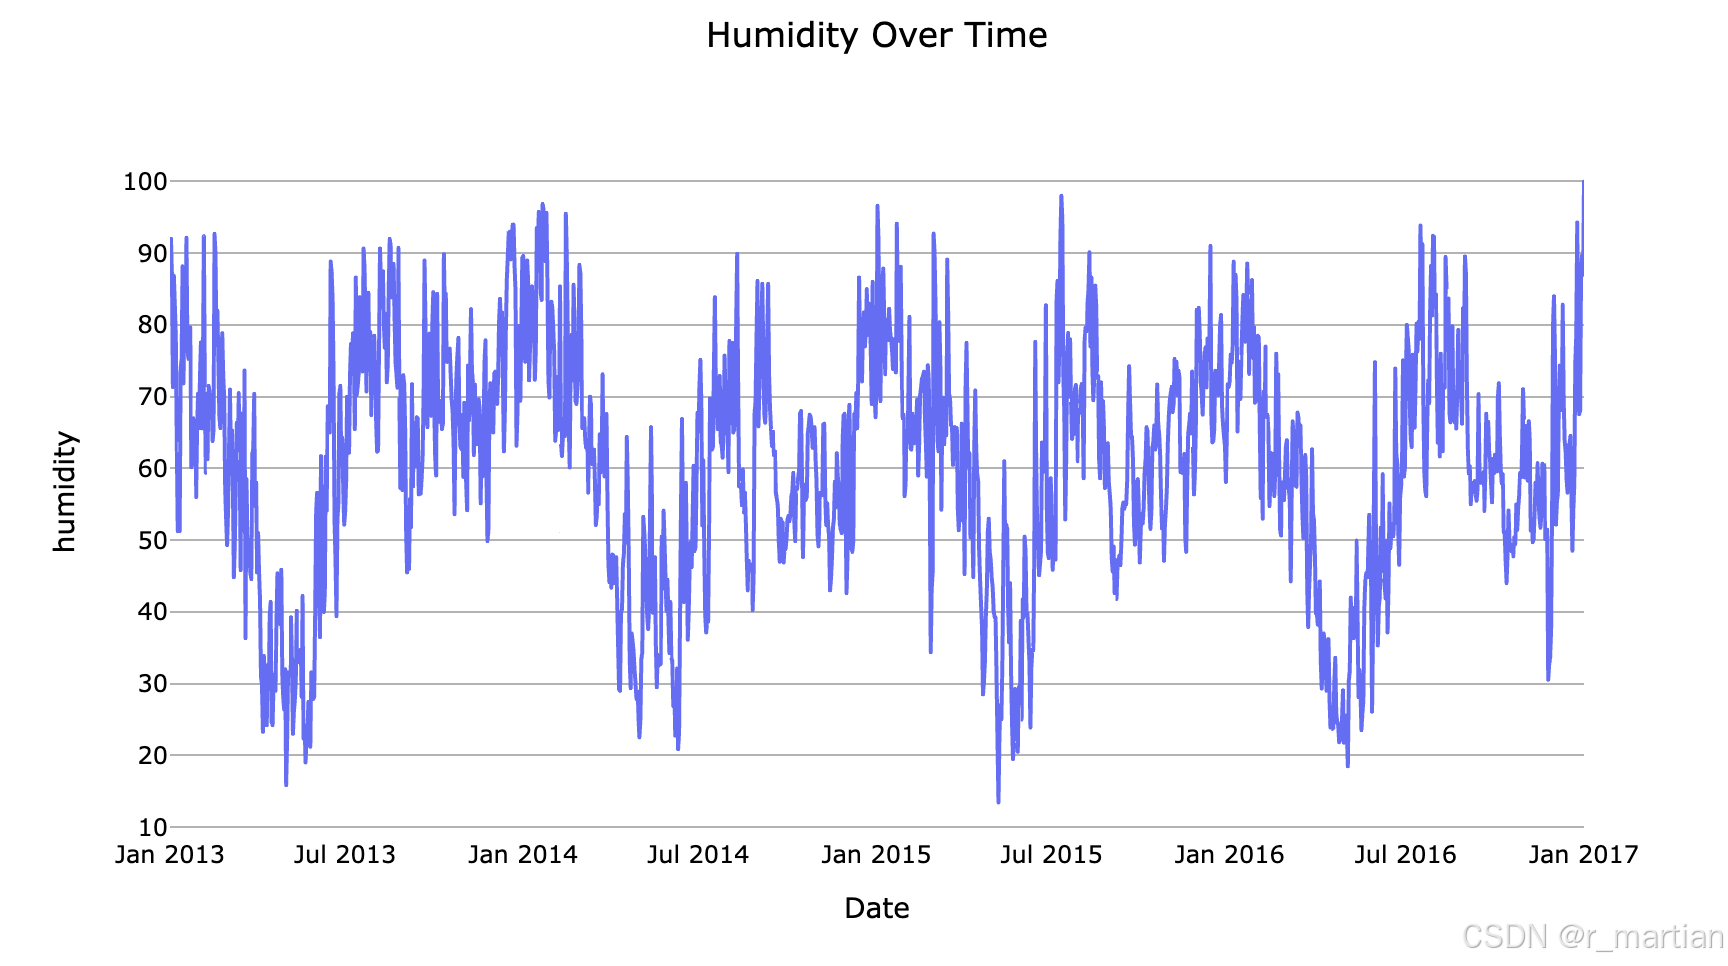
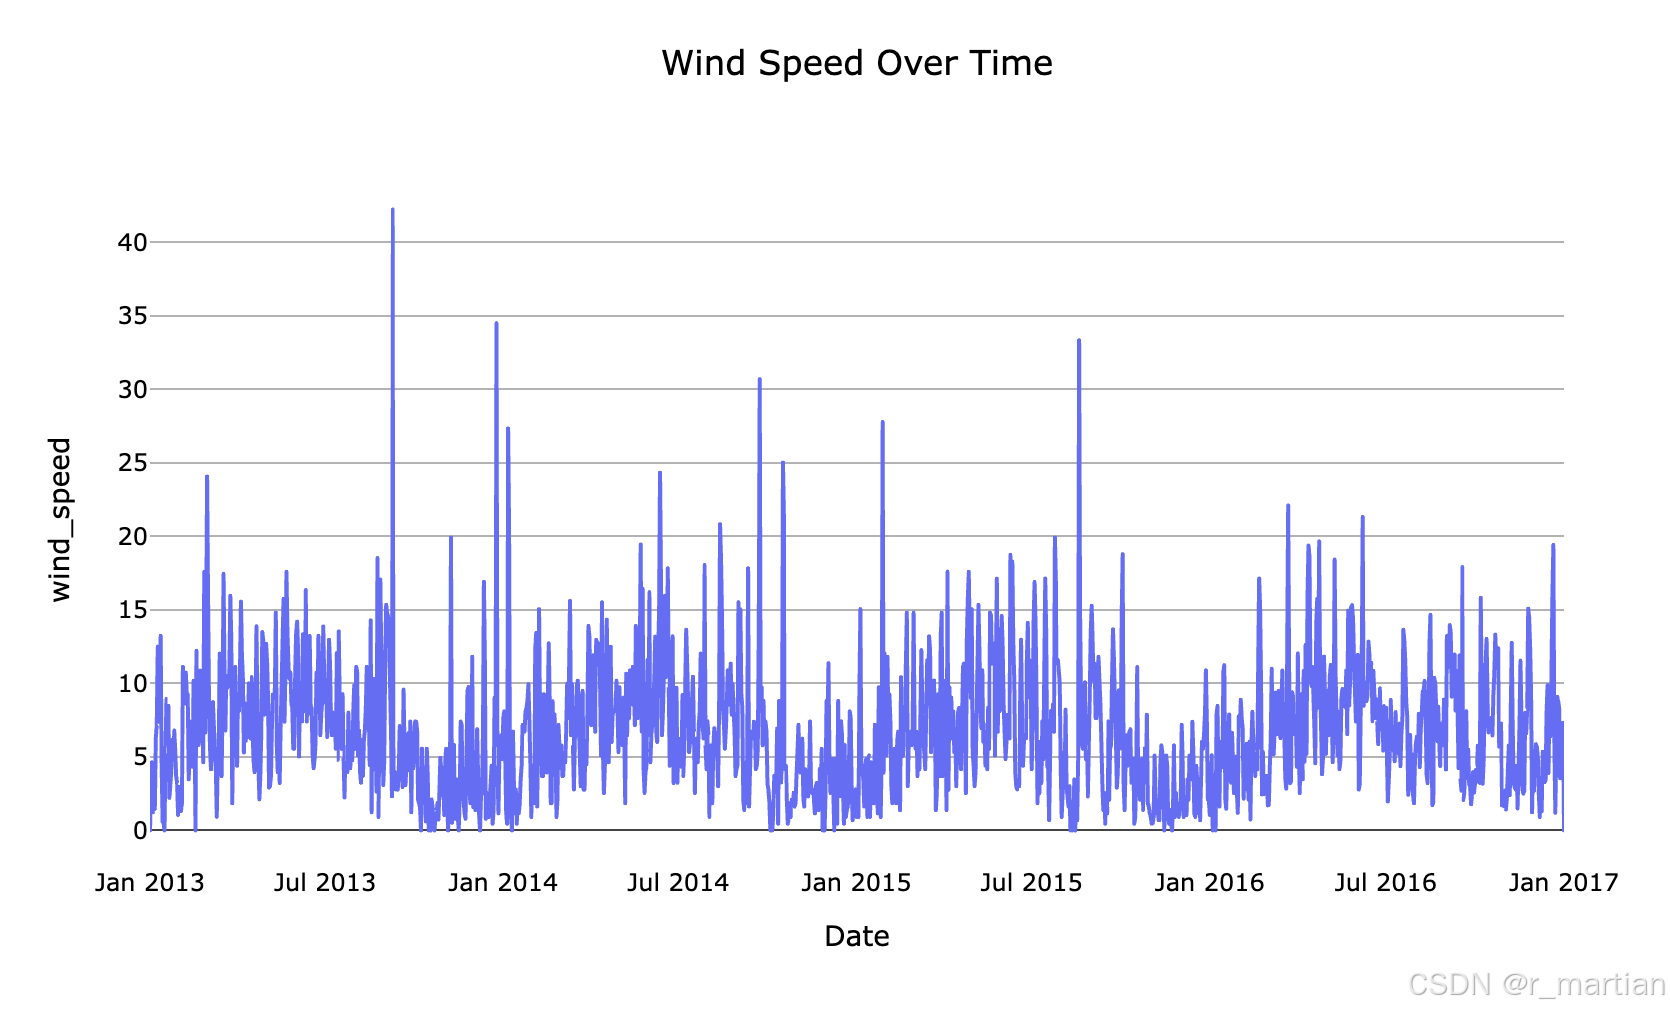
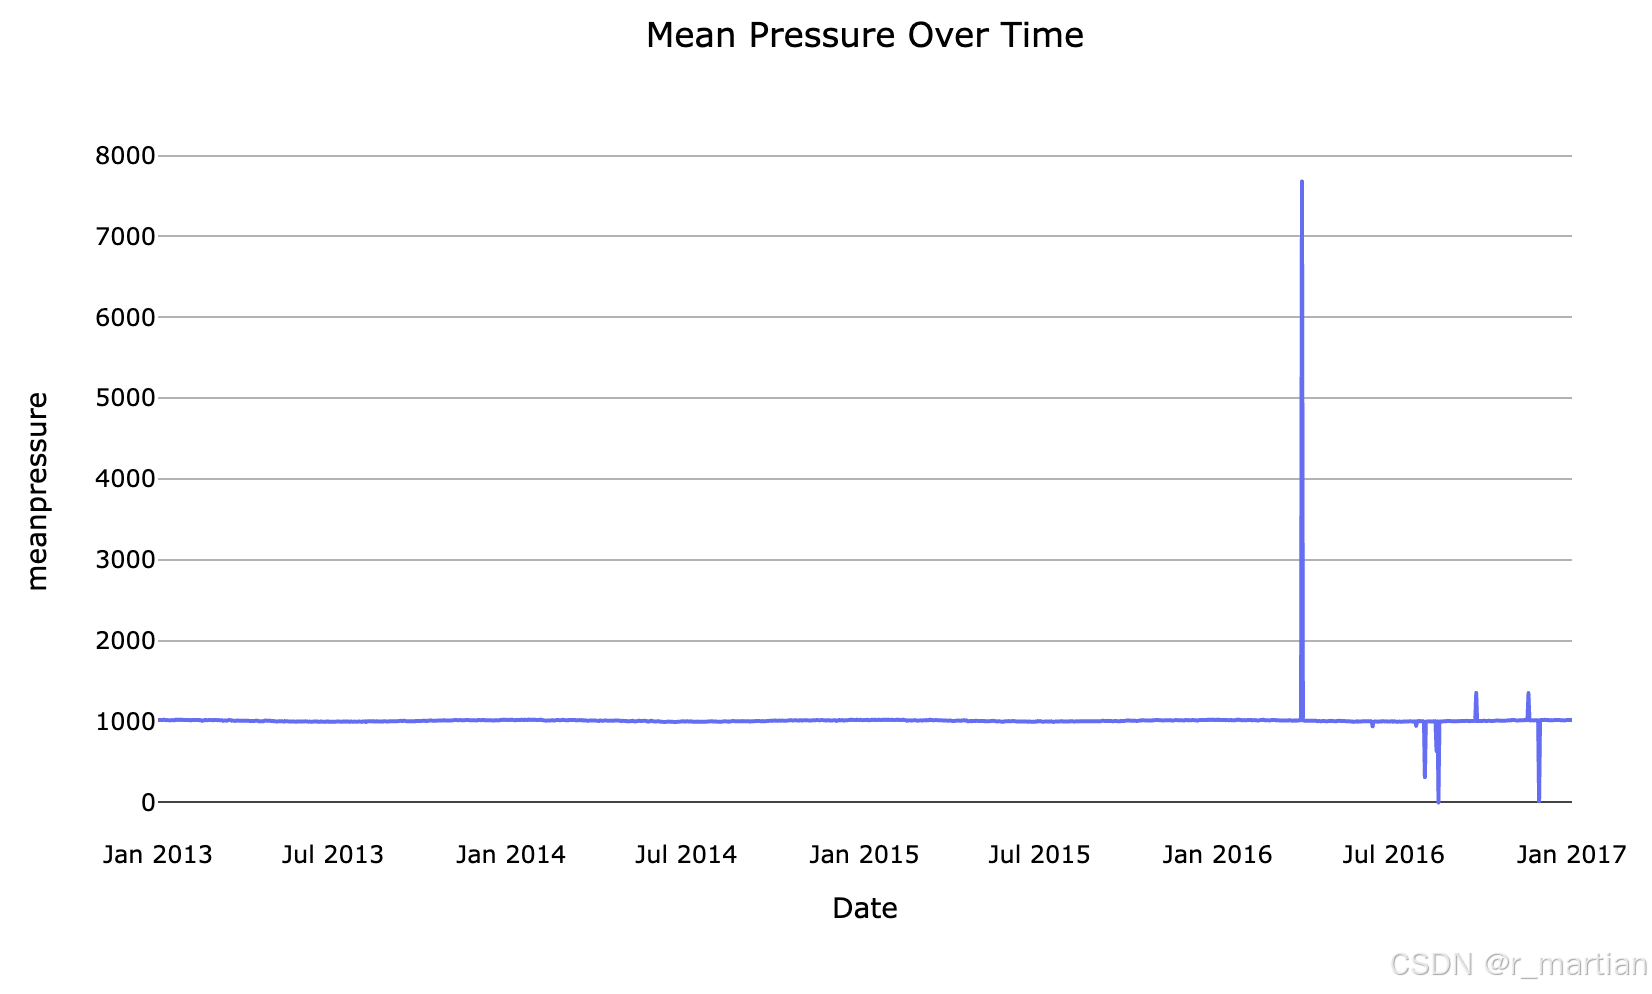
可以从图中看到平均温度,湿度,风速,气压等数据波形图,也可以宏观的看到数据的趋势信息,为后续进一步学习做初步探索。
2.3 数据分量
针对预测数据项平均温度,我们可以分解平均温度数据,进一步分析数据形态、特征。seasonal_decompose函数返回的是trend、seasonal和residual分别表示趋势、季节性和残留三部分的数据,observed代表原始序列。
from statsmodels.tsa.seasonal import seasonal_decompose
import plotly.subplots as sp# Perform seasonal decomposition
result = seasonal_decompose(df['meantemp'], model='additive', period=365)# Plot the decomposed components
fig = sp.make_subplots(rows=4, cols=1, shared_xaxes=True, subplot_titles=['Observed', 'Trend', 'Seasonal', 'Residual'])fig.add_trace(go.Scatter(x=df.index, y=result.observed, mode='lines', name='Observed'), row=1, col=1)
fig.add_trace(go.Scatter(x=df.index, y=result.trend, mode='lines', name='Trend'), row=2, col=1)
fig.add_trace(go.Scatter(x=df.index, y=result.seasonal, mode='lines', name='Seasonal'), row=3, col=1)
fig.add_trace(go.Scatter(x=df.index, y=result.resid, mode='lines', name='Residual'), row=4, col=1)fig.update_layout(template= 'ts_template',height=800, title='Seasonal Decomposition of Mean Temperature')
fig.show()
从图中可以看出,平均温度数据具有很强的季节性,趋势是逐渐升高的,但是受噪音影响有限。
2.4 特征选取
基于以上数据形态观测和分析,我们可以大致选定数据中的部分特征作为影响平均温度的因素(特征信息),这里就选定湿度和风速作为特征信息进行训练和预测。
df = df[['meantemp', 'humidity', 'wind_speed']]
df.head()
2.5 归一化
from sklearn.preprocessing import RobustScaler, MinMaxScalerrobust_scaler = RobustScaler()   # scaler for wind_speed
minmax_scaler = MinMaxScaler()  # scaler for humidity
target_transformer = MinMaxScaler()   # scaler for target (meantemp)dl_train['wind_speed'] = robust_scaler.fit_transform(dl_train[['wind_speed']])  # robust for wind_speed
dl_train['humidity'] = minmax_scaler.fit_transform(dl_train[['humidity']]) # minmax for humidity
dl_train['meantemp'] = target_transformer.fit_transform(dl_train[['meantemp']]) # targetdl_test['wind_speed'] = robust_scaler.transform(dl_test[['wind_speed']])
dl_test['humidity'] = minmax_scaler.transform(dl_test[['humidity']])
dl_test['meantemp'] = target_transformer.transform(dl_test[['meantemp']])display(dl_train.head())
3. 序列稳定性验证
import statsmodels.api as sm
from statsmodels.tsa.stattools import adfuller, kpssdef check_stationarity(series):print(f'\n___________________Checking Stationarity for: {series.name}___________________\n')# ADF Testadf_test = adfuller(series.values)print('ADF Test:\n')print('ADF Statistic: %f' % adf_test[0])print('p-value: %f' % adf_test[1])print('Critical Values:')for key, value in adf_test[4].items():print('\t%s: %.3f' % (key, value))if (adf_test[1] <= 0.05) & (adf_test[4]['5%'] > adf_test[0]):print("\u001b[32mSeries is Stationary (ADF Test)\u001b[0m")else:print("\x1b[31mSeries is Non-stationary (ADF Test)\x1b[0m")print('\n' + '-'*50 + '\n')# KPSS Testkpss_test = kpss(series.values, regression='c', nlags='auto')print('KPSS Test:\n')print('KPSS Statistic: %f' % kpss_test[0])print('p-value: %f' % kpss_test[1])print('Critical Values:')for key, value in kpss_test[3].items():print('\t%s: %.3f' % (key, value))if kpss_test[1] > 0.05:print("\u001b[32mSeries is Stationary (KPSS Test)\u001b[0m")else:print("\x1b[31mSeries is Non-stationary (KPSS Test)\x1b[0m")
那么我们就可以针对选取的特征进行稳定性分析。
# Check initial stationarity for each feature
check_stationarity(df['meantemp'])
check_stationarity(df['humidity'])
check_stationarity(df['wind_speed'])
___________________Checking Stationarity for: meantemp___________________ADF Test:ADF Statistic: -2.021069
p-value: 0.277412
Critical Values:1%: -3.4355%: -2.86410%: -2.568
Series is Non-stationary (ADF Test)--------------------------------------------------KPSS Test:KPSS Statistic: 0.187864
p-value: 0.100000
Critical Values:10%: 0.3475%: 0.4632.5%: 0.5741%: 0.739
Series is Stationary (KPSS Test)___________________Checking Stationarity for: humidity___________________ADF Test:ADF Statistic: -3.675577
p-value: 0.004470
Critical Values:1%: -3.4355%: -2.86410%: -2.568
Series is Stationary (ADF Test)--------------------------------------------------KPSS Test:KPSS Statistic: 0.091737
p-value: 0.100000
Critical Values:10%: 0.3475%: 0.4632.5%: 0.5741%: 0.739
Series is Stationary (KPSS Test)___________________Checking Stationarity for: wind_speed___________________ADF Test:ADF Statistic: -3.838097
p-value: 0.002541
Critical Values:1%: -3.4355%: -2.86410%: -2.568
Series is Stationary (ADF Test)--------------------------------------------------KPSS Test:KPSS Statistic: 0.137734
p-value: 0.100000
Critical Values:10%: 0.3475%: 0.4632.5%: 0.5741%: 0.739
Series is Stationary (KPSS Test)
可以看到平均温度是不稳定的,那么就需要进行差分处理。具体什么是差分及差分阶数请自行查阅。
# 1st degree differencing
df['meantemp_diff'] = df['meantemp'].diff().fillna(0)  # diff() default is 1st degree differencing
check_stationarity(df['meantemp_diff']);
___________________Checking Stationarity for: meantemp_diff___________________ADF Test:ADF Statistic: -16.294070
p-value: 0.000000
Critical Values:1%: -3.4355%: -2.86410%: -2.568
Series is Stationary (ADF Test)--------------------------------------------------KPSS Test:KPSS Statistic: 0.189493
p-value: 0.100000
Critical Values:10%: 0.3475%: 0.4632.5%: 0.5741%: 0.739
Series is Stationary (KPSS Test)
3. 模型训练和预测
# Split the data into training and testing sets
train_size = int(len(df) * 0.8)
train, test = df.iloc[:train_size], df.iloc[train_size:]
# SARIMAXfrom statsmodels.tsa.statespace.sarimax import SARIMAX
from sklearn.metrics import mean_squared_error, r2_score, mean_absolute_error# Define the SARIMA model parameters
order = (1, 1, 6)  # Non-seasonal order (p, d, q)
seasonal_order = (1, 1, 1, 7)  # Seasonal order (P, D, Q, S)  # Fit the SARIMA model
sarima_model = SARIMAX(endog=train['meantemp'], exog=train[['humidity', 'wind_speed']],order=order, seasonal_order=seasonal_order)
sarima_model_fit = sarima_model.fit()# Make predictions
sarima_pred = sarima_model_fit.predict(start=test.index[0], end=test.index[-1],exog=test[['humidity', 'wind_speed']])# Calculate error
mse = mean_squared_error(test['meantemp'], sarima_pred)
r2 = r2_score(test['meantemp'], sarima_pred)
print('Test MSE:', mse)
print('Test R²: %.3f' % r2)# Plot the results
plt.figure(figsize=(10, 5))
plt.plot(test.index, test['meantemp'], label='Actual')
plt.plot(test.index, sarima_pred, color='red', label='SARIMA Forecast')
plt.xlabel('Date')
plt.ylabel('Meantemp')
plt.title('SARIMA Forecast')
plt.legend()
plt.show()
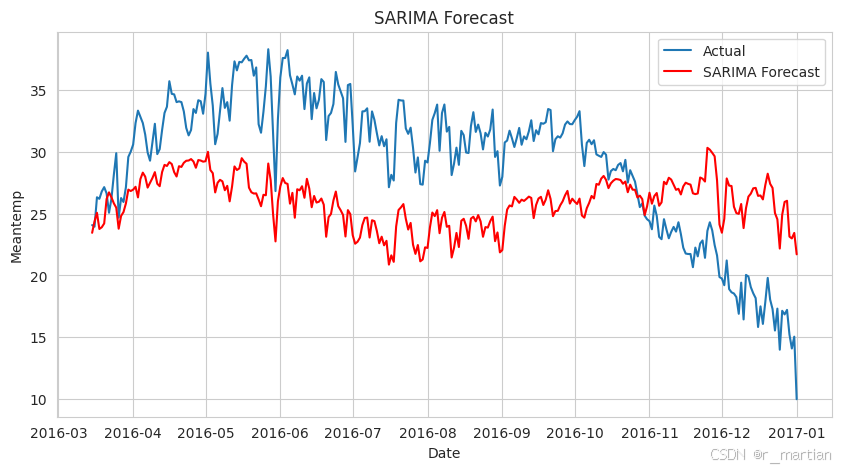
如上图所示,可以看到实际数据和预测数据的曲线图,从图中可以看到,预测值与实际值之间存在较大gap,这就说明模型泛化能力不好,对未来数据不能很好的预测。这就需要我们对模型参数进行调整,以期达到更好的效果。当然有些是受限于模型本身的局限性,始终无法对数据做出合理预测,那就需要我们寻找其他的模型,比如RNN、CNN、LSTM等更强大的深度学习模型来进行训练和预测。
参考文档
- ARIMA Model for Time Series Forecasting
- 季节性ARIMA模型
- https://en.wikipedia.org/wiki/Autoregressive_integrated_moving_average
如有侵权,烦请联系删除
相关文章:
时序预测SARIMAX模型
1. 项目背景 本文基于kaggle平台相关竞赛项目,具体连接如下: Time Series Forecasting With SARIMAX 基本信息如内容说明、数据集、已提交代码、当前得分排名以及比赛规则等,如图【1】所示,可以认真阅读。 图 1 2. 数据读取 …...

gin集成jaeger中间件实现链路追踪
1. 背景 新业务线带来新项目启动,需要改进原有项目的基础框架和组件能力,以提升后续开发和维护效率。项目搭建主要包括技术选型、框架搭建、基础服务搭建等。这其中就涉及到链路追踪的内容,结合其中的踩坑情况,用一篇文章来说明完…...

前端层面----监控与埋点
前言: 站在产品的视角,经常会问如下几个问题: 产品有没有用户使用 用户用得怎么样 系统会不会经常出现异常 如何更好地满足用户需求服务用户 当站在技术视角时,经常会问如下几个问题: 系统出现异常的频率如何 异常…...

linux Command
linux Command 1. 系统监控命令 1.1 top top [param] top -H -p pid,查看进程pid下面的子线程。-b以处理模式操作-c显示完整的命令行而不只是显示命令名。-d 屏幕刷新间隔时间。-l 忽略失效过程。-s 保密模式。-S 累积模式。-u 【用户名】 指定用户名。-p 【进程…...

uniapp登录页面( 适配:pc、小程序、h5)
<!-- 简洁登录页面 --> <template><view class"login-bg"><image class"img-a" src"https://zhoukaiwen.com/img/loginImg/2.png"></image><image class"img-b" src"https://zhoukaiwen.com/im…...

关于OceanBase 多模一体化的浅析
在当今多元化的业务生态中,各行各业对数据库系统的需求各有侧重。举例来说,金融风控领域对数据库的高效事务处理(TP)和分析处理(AP)能力有着严格要求;游戏行业则更加注重文档数据库的灵活性和性…...

快速git
下载 sudo apt install git配置 $ git config --global user.name "John Doe" $ git config --global user.email johndoeexample.com没有空格可以不加双引号如果~/.ssh没有先创建(下一步用) ssh方式制作密钥 github解释 #以邮箱作为标签…...

欺诈文本分类检测(十四):GPTQ量化模型
1. 引言 量化的本质:通过将模型参数从高精度(例如32位)降低到低精度(例如8位),来缩小模型体积。 本文将采用一种训练后量化方法GPTQ,对前文已经训练并合并过的模型文件进行量化,通…...

2024.9.14(RC和RS)
一、replicationcontroller (RC) 1、更改镜像站 [rootk8s-master ~]# vim /etc/docker/daemon.json {"registry-mirrors": ["https://do.nark.eu.org","https://dc.j8.work","https://docker.m.daocloud.io",&…...

【算法随想录04】KMP 字符串匹配算法
这是字符串模式匹配经典算法。 给定一个文本 t 和一个字符串 s,我们尝试找到并展示 s 在 t 中的所有出现(occurrence)。 #include<bits/stdc.h>using namespace std;vector<int> KMP(string s) {int n s.size();vector<int&g…...

TCP和MQTT通信协议
协议分层 网络分层 协议应用层 Co AP MQTT HTTP传输层 UDP TCP网络层 IP链路层 Enternet 网络分层中最…...

Python Pickle 与 JSON 序列化详解:存储、反序列化与对比
Python Pickle 与 JSON 序列化详解:存储、反序列化与对比 文章目录 Python Pickle 与 JSON 序列化详解:存储、反序列化与对比一 功能总览二 Pickle1 应用2 序列化3 反序列化4 系统资源对象1)不能被序列化的系统资源对象2)强行序列…...

第二百三十二节 JPA教程 - JPA教程 - JPA ID自动生成器示例、JPA ID生成策略示例
JPA教程 - JPA ID自动生成器示例 我们可以将id字段标记为自动生成的主键列。 数据库将在插入时自动为id字段生成一个值数据到表。 例子 下面的代码来自Person.java。 package cn.w3cschool.common;import javax.persistence.Entity; import javax.persistence.GeneratedValu…...

计算机网络 ---- 计算机网络的体系结构【计算机网络的分层结构】
一、以快递网络来引入分层思想 1.1 “分层” 的设计思想【将庞大而复杂的问题,转化为若干较小的局部问题】 从我们最熟悉的快递网络出发,在你家附近会有一个快递终点站A,在其他的城市,也会有这种快递终点站,比如说快递…...

Vite + Electron 时,Electron 渲染空白,静态资源加载错误等问题解决
问题 如果在 electron 里直接引入 vite 打包后的东西,那么有些资源是请求不到的 这是我的引入方式 根据报错,我们来到 vite 打包后的路径看一看 ,修改一下 dist 里的文件路径试了一试 修改后的样子,发现是可以的了 原因分析 …...
)
ZAB协议(算法)
一、ZAB(ZooKeeper Atomic Broadcast)介绍 ZAB 即 ZooKeeper Atomic Broadcast,是 ZooKeeper 实现分布式数据一致性的核心算法。它是一种原子广播协议,用于确保在分布式环境中,多个 ZooKeeper 服务器之间的数据一致性。…...
多个音频怎么合并?把多个音频合并在一起的方法推荐
多个音频怎么合并?无论是制作连贯的播客节目还是将音乐片段整合成专辑,音频合并已成为许多创作者的常见需求。通过有效合并音频,可以显著提升项目的整体质量,确保内容的连续性和一致性。然而,合并后的文件通常比原始单…...
 与 DRF APIView 的区别解析)
【Django】Django Class-Based Views (CBV) 与 DRF APIView 的区别解析
Django Class-Based Views (CBV) 与 DRF APIView 的区别解析 在 Django 开发中,基于类的视图(Class-Based Views, CBV)是实现可重用性和代码结构化的利器。而 Django REST Framework (DRF) 提供的 APIView 是针对 API 开发的扩展。 一、CBV …...

如何增加Google收录量?
想增加Google收录量,首先自然是你的页面数量就要多,但这些页面的内容也绝对不能敷衍,你的网站都没多少页面,谷歌哪怕想收录都没办法,当然,这是一个过程,持续缓慢的增加页面,增加网站…...

leetcode练习 格雷编码
n 位格雷码序列 是一个由 2n 个整数组成的序列,其中: 每个整数都在范围 [0, 2n - 1] 内(含 0 和 2n - 1)第一个整数是 0一个整数在序列中出现 不超过一次每对 相邻 整数的二进制表示 恰好一位不同 ,且第一个 和 最后一…...

Leather Dress Collection代码实例:Stable Diffusion XL适配LoRA迁移方案
Leather Dress Collection代码实例:Stable Diffusion XL适配LoRA迁移方案 1. 引言 如果你手头有一堆基于Stable Diffusion 1.5训练的LoRA模型,现在想用更强大的SDXL来生成图片,该怎么办?直接拿来用?大概率会出问题。…...
)
啃了3个月Profinet硬骨头:我用C#实现了以太网帧抓包+GSD解析(附踩坑实录)
“威哥,别试了,那台德国老设备的Profinet通信,第三方库要价20万,还不支持定制。” “20万?项目预算才多少!我就不信了,抓包分析GSD解析,我用C#自己撸一套对接方案。” 这段对话发生在…...

Phi-3 Forest Lab快速上手:使用LMStudio本地加载Phi-3-mini-128k-instruct模型
Phi-3 Forest Lab快速上手:使用LMStudio本地加载Phi-3-mini-128k-instruct模型 1. 引言:为什么选择本地运行Phi-3? 如果你对AI对话感兴趣,但又担心在线服务的隐私问题、网络延迟或使用成本,那么本地部署一个属于自己…...
 储能共直流母线 光伏储能共交流母线 储能由氢燃...)
氢电混合储能系统仿真(光伏,锂电池,燃料电池) 储能共直流母线 光伏储能共交流母线 储能由氢燃...
氢电混合储能系统仿真(光伏,锂电池,燃料电池) 储能共直流母线 光伏储能共交流母线 储能由氢燃料电池锂电池组成 直流母线电压稳定在800v 考虑光伏故障下系统的运行特性在新能源领域,氢电混合储能系统正逐渐成为研究的热…...

全网唯一 为什么工业软件内容密度极高?
为什么工业软件内容密度极高?从底层逻辑、技术壁垒与产业安全深度解析 作者: 大号:华夏之光永存(道级解读) 小号:华夏之光永存小号(术级解读) 原创: 全网唯一,…...

实战应用:基于快马生成仿openclaw的安卓购物应用自动化测试脚本
最近在做一个安卓购物应用的自动化测试项目,刚好用到了InsCode(快马)平台来快速生成和验证脚本。这个平台挺有意思,输入需求就能生成可运行的代码,省去了很多前期搭建和构思的时间。今天就来分享一下,如何利用它生成一个仿照“ope…...
为什么Transformer都用交叉熵损失?对比MAE、Huber的NLP任务实测
为什么Transformer更偏爱交叉熵损失?MAE与Huber在NLP任务中的实战对比 当你在PyTorch里敲下nn.CrossEntropyLoss()时,有没有想过为什么几乎所有Transformer模型的默认配置都是这个损失函数?上周我在微调一个文本摘要模型时,突发奇…...

光伏逆变器锁相环优化指南:DDSRF双解耦如何提升相位精度5倍
光伏逆变器锁相环优化指南:DDSRF双解耦如何提升相位精度5倍 在光伏电站的实际运行中,电网电压畸变是影响逆变器性能的关键因素之一。当电网出现不平衡或谐波干扰时,传统锁相环(PLL)的相位检测精度会显著下降,导致逆变器输出功率波…...

5个高效技巧:用WPS-Zotero插件实现文献管理效率跃升
5个高效技巧:用WPS-Zotero插件实现文献管理效率跃升 【免费下载链接】WPS-Zotero An add-on for WPS Writer to integrate with Zotero. 项目地址: https://gitcode.com/gh_mirrors/wp/WPS-Zotero 解决学术写作中文献管理难题的创新方法 在学术研究的征途上…...

10大滴鸡精品牌推荐排行榜
大家好,今天我要和大家聊聊一个热门话题——滴鸡精。在快节奏的生活中,越来越多的人开始注重养生保健,滴鸡精作为一种方便快捷的滋补品,受到了很多人的青睐。不过市场上的滴鸡精品牌琳琅满目,到底哪些品牌更值得信赖呢…...