vue 中加载 Mapbox GL JS Examples
Mapbox GL JS 示例
- 1. Mapbox GL JS的基础使用
- 2. style 的使用
- 2.1. 切换 style
- 2.2. 配置一个第三方 style (添加一个Layer)
- 2.3. 配置一个带有 slot 的 style
- 2.4. 创建一个自定义 style 的 layer 类实现 WebGL 内容
- 2.5. 添加Marker
- 2.6. 添加 geojson 格式的 point
- 2.7. 添加 geojson 格式的 line_string
- 2.8. 添加 geojson 格式的 ploygon
- 2.9. 在指定 layer 的上方添加图层
- 2.9. image
- 2.9. raster
- 2.9. vector
- 2.9. vector
- 2.10. heatmap
- 3. Fog
- 4. Projection
- 4.1. 创建map对象时设置 projection
- 4.2. 创建map对象时设置 projection
- 5. Control
- 5.1. 添加全屏按钮
1. Mapbox GL JS的基础使用
<template><div class="mapContainer"><div id='map' style='width: 100%; height: 800px;'></div></div>
</template><script>
import 'mapbox-gl/dist/mapbox-gl.css';
import mapboxgl from 'mapbox-gl'; // or "const mapboxgl = require('mapbox-gl');"
mapboxgl.accessToken = '你的密钥';
import { nextTick, onMounted } from 'vue'export default {name: 'BasicMapContainer',setup(){onMounted(()=>{console.log("组件已经挂载了")nextTick(()=>{const map = new mapboxgl.Map({container: 'map', // container IDstyle: 'mapbox://styles/mapbox/streets-v12', // style URLcenter: [-74.5, 40], // starting position [lng, lat]zoom: 9, // starting zoom});})  })return {}}}
</script>
2. style 的使用
2.1. 切换 style
<template><div class="mapContainer"><div id='map' style='width: 100%; height: 800px;'></div></div><button @click="changStyle('standard')" >standard</button><button @click="changStyle('streets-v12')" >streets-v12</button><button @click="changStyle('outdoors-v12')" >outdoors-v12</button><button @click="changStyle('light-v11')" >light-v11</button><button @click="changStyle('satellite-v9')" >satellite-v9</button><button @click="changStyle('dark-v11')" >dark-v11</button><button @click="changStyle('satellite-streets-v12')" >satellite-streets-v12</button><button @click="changStyle('navigation-day-v1')" >navigation-day-v1</button><button @click="changStyle('navigation-night-v1')" >navigation-night-v1</button>
</template><script>
import 'mapbox-gl/dist/mapbox-gl.css';
import mapboxgl from 'mapbox-gl';
mapboxgl.accessToken = '你的密钥';
import { nextTick, onMounted,ref } from 'vue'export default {
name: 'BasicMapContainer',
setup(){let map  = ref(null)const changStyle = (value) => {map.setStyle("mapbox://styles/mapbox/" + value);}onMounted(()=>{nextTick(()=>{map = new mapboxgl.Map({container: 'map', style: 'mapbox://styles/mapbox/navigation-day-v1',center: [-74.5, 40],zoom: 9, });})  })return {changStyle}}
}
</script>
2.2. 配置一个第三方 style (添加一个Layer)
map.on('style.load', () => {map.addSource('line', {type: 'geojson',lineMetrics: true,data: {type: 'LineString',coordinates: [[2.293389857555951, 48.85896319631851],[2.2890810326441624, 48.86174223718291]]}});map.addLayer({id: 'line',source: 'line',type: 'line',paint: {'line-width': 12,// The `*-emissive-strength` properties control the intensity of light emitted on the source features.// To enhance the visibility of a line in darker light presets, increase the value of `line-emissive-strength`.'line-emissive-strength': 0.8,'line-gradient': ['interpolate',['linear'],['line-progress'],0,'red',1,'blue']}});
});
2.3. 配置一个带有 slot 的 style
map.addSource('urban-areas', {'type': 'geojson','data': 'https://docs.mapbox.com/mapbox-gl-js/assets/ne_50m_urban_areas.geojson'});map.addLayer({'id': 'urban-areas-fill','type': 'fill',// This property allows you to identify which `slot` in// the Mapbox Standard your new layer should be placed in (`bottom`, `middle`, `top`).'slot': 'middle','source': 'urban-areas','layout': {},'paint': {'fill-color': '#f08','fill-opacity': 0.4}
});
2.4. 创建一个自定义 style 的 layer 类实现 WebGL 内容
const map = new mapboxgl.Map({container: 'map', // container IDstyle: 'mapbox://styles/mapbox/streets-v12', // style URLcenter: [-74.5, 40], // starting position [lng, lat]zoom: 9, // starting zoom});
// create a custom style layer to implement the WebGL content
const highlightLayer = {id: 'highlight',type: 'custom',// method called when the layer is added to the map// https://docs.mapbox.com/mapbox-gl-js/api/#styleimageinterface#onaddonAdd: function (map, gl) {// create GLSL source for vertex shaderconst vertexSource = `uniform mat4 u_matrix;attribute vec2 a_pos;void main() {gl_Position = u_matrix * vec4(a_pos, 0.0, 1.0);}`;// create GLSL source for fragment shaderconst fragmentSource = `void main() {gl_FragColor = vec4(1.0, 0.0, 0.0, 0.5);}`;// create a vertex shaderconst vertexShader = gl.createShader(gl.VERTEX_SHADER);gl.shaderSource(vertexShader, vertexSource);gl.compileShader(vertexShader);// create a fragment shaderconst fragmentShader = gl.createShader(gl.FRAGMENT_SHADER);gl.shaderSource(fragmentShader, fragmentSource);gl.compileShader(fragmentShader);// link the two shaders into a WebGL programthis.program = gl.createProgram();gl.attachShader(this.program, vertexShader);gl.attachShader(this.program, fragmentShader);gl.linkProgram(this.program);this.aPos = gl.getAttribLocation(this.program, 'a_pos');// define vertices of the triangle to be rendered in the custom style layerconst helsinki = mapboxgl.MercatorCoordinate.fromLngLat({lng: 25.004,lat: 60.239});const berlin = mapboxgl.MercatorCoordinate.fromLngLat({lng: 13.403,lat: 52.562});const kyiv = mapboxgl.MercatorCoordinate.fromLngLat({lng: 30.498,lat: 50.541});// create and initialize a WebGLBuffer to store vertex and color datathis.buffer = gl.createBuffer();gl.bindBuffer(gl.ARRAY_BUFFER, this.buffer);gl.bufferData(gl.ARRAY_BUFFER,new Float32Array([helsinki.x,helsinki.y,berlin.x,berlin.y,kyiv.x,kyiv.y]),gl.STATIC_DRAW);},// method fired on each animation frame// https://docs.mapbox.com/mapbox-gl-js/api/#map.event:renderrender: function (gl, matrix) {gl.useProgram(this.program);gl.uniformMatrix4fv(gl.getUniformLocation(this.program, 'u_matrix'),false,matrix);gl.bindBuffer(gl.ARRAY_BUFFER, this.buffer);gl.enableVertexAttribArray(this.aPos);gl.vertexAttribPointer(this.aPos, 2, gl.FLOAT, false, 0, 0);gl.enable(gl.BLEND);gl.blendFunc(gl.SRC_ALPHA, gl.ONE_MINUS_SRC_ALPHA);gl.drawArrays(gl.TRIANGLE_STRIP, 0, 3);}
};// add the custom style layer to the map
map.on('load', () => {map.addLayer(highlightLayer, 'building');
});
2.5. 添加Marker
// Create a default Marker and add it to the map.
const marker1 = new mapboxgl.Marker().setLngLat([12.554729, 55.70651]).addTo(map);
2.6. 添加 geojson 格式的 point
map.addImage('custom-marker', image);
// Add a GeoJSON source with 2 points
map.addSource('points', {'type': 'geojson','data': {'type': 'FeatureCollection','features': [{// feature for Mapbox DC'type': 'Feature','geometry': {'type': 'Point','coordinates': [-77.03238901390978, 38.913188059745586]},'properties': {'title': 'Mapbox DC'}},{// feature for Mapbox SF'type': 'Feature','geometry': {'type': 'Point','coordinates': [-122.414, 37.776]},'properties': {'title': 'Mapbox SF'}}]}
});// Add a symbol layer
map.addLayer({'id': 'points','type': 'symbol','source': 'points','layout': {'icon-image': 'custom-marker',// get the title name from the source's "title" property'text-field': ['get', 'title'],'text-font': ['Open Sans Semibold','Arial Unicode MS Bold'],'text-offset': [0, 1.25],'text-anchor': 'top'}
});
2.7. 添加 geojson 格式的 line_string
// Create a default Marker and add it to the map.
map.addSource('route', {'type': 'geojson','data': {'type': 'Feature','properties': {},'geometry': {'type': 'LineString','coordinates': [[-122.483696, 37.833818],[-122.483482, 37.833174],[-122.483396, 37.8327],[-122.483568, 37.832056],[-122.48404, 37.831141],[-122.48404, 37.830497],[-122.483482, 37.82992],[-122.483568, 37.829548],[-122.48507, 37.829446],[-122.4861, 37.828802],[-122.486958, 37.82931],[-122.487001, 37.830802],[-122.487516, 37.831683],[-122.488031, 37.832158],[-122.488889, 37.832971],[-122.489876, 37.832632],[-122.490434, 37.832937],[-122.49125, 37.832429],[-122.491636, 37.832564],[-122.492237, 37.833378],[-122.493782, 37.833683]]}}});map.addLayer({'id': 'route','type': 'line','source': 'route','layout': {'line-join': 'round','line-cap': 'round'},'paint': {'line-color': '#000','line-width': 20}});
2.8. 添加 geojson 格式的 ploygon
map.addSource('maine', {'type': 'geojson','data': {'type': 'Feature','geometry': {'type': 'Polygon',// These coordinates outline Maine.'coordinates': [[[-67.13734, 45.13745],[-66.96466, 44.8097],[-68.03252, 44.3252],[-69.06, 43.98],[-70.11617, 43.68405],[-70.64573, 43.09008],[-70.75102, 43.08003],[-70.79761, 43.21973],[-70.98176, 43.36789],[-70.94416, 43.46633],[-71.08482, 45.30524],[-70.66002, 45.46022],[-70.30495, 45.91479],[-70.00014, 46.69317],[-69.23708, 47.44777],[-68.90478, 47.18479],[-68.2343, 47.35462],[-67.79035, 47.06624],[-67.79141, 45.70258],[-67.13734, 45.13745]]]}}
});map.addLayer({'id': 'maine','type': 'fill','source': 'maine', // reference the data source'layout': {},'paint': {'fill-color': '#0080ff', // blue color fill'fill-opacity': 0.5}
});
2.9. 在指定 layer 的上方添加图层
const layers = map.getStyle().layers;
// Find the index of the first symbol layer in the map style.
let firstSymbolId;
for (const layer of layers) {console.log('laye = ',layer.id,' type = ',layer.type);if (layer.type === 'symbol') {firstSymbolId = layer.id;break;}
}map.addSource('urban-areas', {'type': 'geojson','data': 'https://docs.mapbox.com/mapbox-gl-js/assets/ne_50m_urban_areas.geojson'
});
map.addLayer({'id': 'urban-areas-fill','type': 'fill','source': 'urban-areas','layout': {},'paint': {'fill-color': '#f08','fill-opacity': 0.4}// This is the important part of this example: the addLayer// method takes 2 arguments: the layer as an object, and a string// representing another layer's name. If the other layer// exists in the style already, the new layer will be positioned// right before that layer in the stack, making it possible to put// 'overlays' anywhere in the layer stack.// Insert the layer beneath the first symbol layer.},firstSymbolId
);
2.9. image
map.addSource('radar', {'type': 'image','url': 'https://docs.mapbox.com/mapbox-gl-js/assets/radar.gif','coordinates': [[-80.425, 46.437],[-71.516, 46.437],[-71.516, 37.936],[-80.425, 37.936]]
});
map.addLayer({id: 'radar-layer','type': 'raster','source': 'radar','paint': {'raster-fade-duration': 0}
});
2.9. raster
const map = new mapboxgl.Map({container: 'map', // container IDstyle: {'version': 8,'sources': {'raster-tiles': {'type': 'raster','tiles': ['https://tile.openstreetmap.org/{z}/{x}/{y}.png'],'tileSize': 256,'attribution':'© <a href="https://www.openstreetmap.org/copyright">OpenStreetMap</a> contributors'}},'layers': [{'id': 'simple-tiles','type': 'raster','source': 'raster-tiles','minzoom': 0,'maxzoom': 22}]},center: [-74.5, 40], // starting positionzoom: 2 // starting zoom});
map.addSource('wms-test-source', {'type': 'raster',// use the tiles option to specify a WMS tile source URL// https://docs.mapbox.comhttps://docs.mapbox.com/style-spec/reference/sources/'tiles': ['https://img.nj.gov/imagerywms/Natural2015?bbox={bbox-epsg-3857}&format=image/png&service=WMS&version=1.1.1&request=GetMap&srs=EPSG:3857&transparent=true&width=256&height=256&layers=Natural2015'],'tileSize': 256
});
map.addLayer({'id': 'wms-test-layer','type': 'raster','source': 'wms-test-source','paint': {}},'building' // Place layer under labels, roads and buildings.
);
2.9. vector
// Add a new vector tile source with ID 'mapillary'.
map.addSource('mapillary', {'type': 'vector','tiles': ['https://tiles.mapillary.com/maps/vtp/mly1_public/2/{z}/{x}/{y}?access_token=MLY|4142433049200173|72206abe5035850d6743b23a49c41333'],'minzoom': 6,'maxzoom': 14
});
map.addLayer({'id': 'mapillary', // Layer ID'type': 'line','source': 'mapillary', // ID of the tile source created above// Source has several layers. We visualize the one with name 'sequence'.'source-layer': 'sequence','layout': {'line-cap': 'round','line-join': 'round'},'paint': {'line-opacity': 0.6,'line-color': 'rgb(53, 175, 109)','line-width': 2}},'road-label-simple' // Arrange our new layer beneath labels and above roads
);
2.9. vector
map.addSource('mapbox-terrain', {type: 'vector',// Use any Mapbox-hosted tileset using its tileset id.// Learn more about where to find a tileset id:// https://docs.mapbox.com/help/glossary/tileset-id/url: 'mapbox://mapbox.mapbox-terrain-v2'
});
map.addLayer({'id': 'terrain-data','type': 'line','source': 'mapbox-terrain','source-layer': 'contour','layout': {'line-join': 'round','line-cap': 'round'},'paint': {'line-color': '#ff69b4','line-width': 1}},'road-label-simple' // Add layer below labels
);
2.10. heatmap
<template><div id="map"></div>
</template><script>
import 'mapbox-gl/dist/mapbox-gl.css';
import mapboxgl from 'mapbox-gl'; // or "const mapboxgl = require('mapbox-gl');"
mapboxgl.accessToken = 'pk.eyJ1IjoiZ2lzZXJqaWFuZyIsImEiOiJjbHJ3Ym1nZzYwdTI2Mml1b3FzN3RlZmRrIn0.Sy_jGFu4prk99Udfa6AgkQ';
import { nextTick, onMounted } from 'vue'export default {name: 'BasicMapContainer',setup(){onMounted(()=>{const map = new mapboxgl.Map({container: 'map',// Choose from Mapbox's core styles, or make your own style with Mapbox Studiostyle: 'mapbox://styles/mapbox/light-v11',zoom: 8,center: [-74.5447, 40.6892]});map.on('load', () => {// Add a geojson point source.// Heatmap layers also work with a vector tile source.map.addSource('earthquakes', {'type': 'geojson','data': 'https://docs.mapbox.com/mapbox-gl-js/assets/earthquakes.geojson'});map.addLayer({'id': 'earthquakes-heat','type': 'heatmap','source': 'earthquakes','maxzoom': 9,'paint': {// Increase the heatmap weight based on frequency and property magnitude'heatmap-weight': ['interpolate',['linear'],['get', 'mag'],0,0,6,1],// Increase the heatmap color weight weight by zoom level// heatmap-intensity is a multiplier on top of heatmap-weight'heatmap-intensity': ['interpolate',['linear'],['zoom'],0,1,9,3],// Color ramp for heatmap.  Domain is 0 (low) to 1 (high).// Begin color ramp at 0-stop with a 0-transparancy color// to create a blur-like effect.'heatmap-color': ['interpolate',['linear'],['heatmap-density'],0,'rgba(33,102,172,0)',0.2,'rgb(103,169,207)',0.4,'rgb(209,229,240)',0.6,'rgb(253,219,199)',0.8,'rgb(239,138,98)',1,'rgb(178,24,43)'],// Adjust the heatmap radius by zoom level'heatmap-radius': ['interpolate',['linear'],['zoom'],0,2,9,20],// Transition from heatmap to circle layer by zoom level'heatmap-opacity': ['interpolate',['linear'],['zoom'],7,1,9,0]}},'waterway-label');map.addLayer({'id': 'earthquakes-point','type': 'circle','source': 'earthquakes','minzoom': 7,'paint': {// Size circle radius by earthquake magnitude and zoom level'circle-radius': ['interpolate',['linear'],['zoom'],7,['interpolate', ['linear'], ['get', 'mag'], 1, 1, 6, 4],16,['interpolate', ['linear'], ['get', 'mag'], 1, 5, 6, 50]],// Color circle by earthquake magnitude'circle-color': ['interpolate',['linear'],['get', 'mag'],1,'rgba(33,102,172,0)',2,'rgb(103,169,207)',3,'rgb(209,229,240)',4,'rgb(253,219,199)',5,'rgb(239,138,98)',6,'rgb(178,24,43)'],'circle-stroke-color': 'white','circle-stroke-width': 1,// Transition from heatmap to circle layer by zoom level'circle-opacity': ['interpolate',['linear'],['zoom'],7,0,8,1]}},'waterway-label');});})return {}}
}</script><style scoped>
#map { position: absolute; top: 0; bottom: 0; width: 99.1%; }
</style>
3. Fog
map.setFog({color: 'rgb(186, 210, 235)', // Lower atmosphere 186, 210, 235'high-color': 'rgb( 36, 92, 223)', // Upper atmosphere 36, 92, 223'horizon-blend': 0.02, // Atmosphere thickness (default 0.2 at low zooms)'space-color': 'rgb(11, 11, 25)', // Background color'star-intensity': 0.6 // Background star brightness (default 0.35 at low zoooms });
4. Projection
4.1. 创建map对象时设置 projection
map = new mapboxgl.Map({container: 'map',// Choose from Mapbox's core styles, or make your own style with Mapbox Studiostyle: 'mapbox://styles/mapbox/satellite-streets-v12',zoom: 0,center: [0, 1],projection: {name: 'lambertConformalConic',center: [0, 30],parallels: [30, 30]}});4.2. 创建map对象时设置 projection
// globe mercator albers equalEarth equirectangular lambertConformalConic naturalEarth winkelTripel
map.setProjection("globe");
5. Control
5.1. 添加全屏按钮
map.addControl(new mapboxgl.FullscreenControl());
相关文章:

vue 中加载 Mapbox GL JS Examples
Mapbox GL JS 示例 1. Mapbox GL JS的基础使用2. style 的使用2.1. 切换 style2.2. 配置一个第三方 style (添加一个Layer)2.3. 配置一个带有 slot 的 style2.4. 创建一个自定义 style 的 layer 类实现 WebGL 内容2.5. 添加Marker2.6. 添加 geojson 格式…...

Vue3 中组件传递 + css 变量的组合
文章目录 需求效果如下图所示代码逻辑代码参考 需求 开发一个箭头组件,根据父组件传递的 props 来修改 css 的颜色 效果如下图所示 代码逻辑 代码 父组件: <Arrow color"red" />子组件: <template><div class&…...

秋分之际,又搭建了一款微信记账本小程序
在这个金色的季节里,每一粒粮食都蕴含着生命的奇迹,每一片叶子都在诉说着成长的故事。秋分之际,又搭建了一款微信记账本小程序。 产品概述 微信记账本小程序是一款便捷的个人财务管理工具,旨在帮助用户轻松记录、管理和分析日常…...

聚合函数count 和 group by
count函数: count(列名) SELECT COUNT(sid) FROM grade 统计列中所有的数值个数,会忽略null值。 count(*)和count(1) SELECT COUNT(*) FROM grade SELECT COUNT(1) FROM grade 统…...

Vue的工程化和element快速入门
vue项目的创建: vue项目的启动方式: vue项目开发流程: 代码示例: <!-- <script>//写数据export default{data(){return{msg: 上海}}} </script> --><script setup>import {ref} from vue;//调用ref函数&…...
)
【Kubernetes】常见面试题汇总(三十一)
目录 83.简述你知道的 K8s 中几种 Controller 控制器并详述其工作原理。简述 ingress-controller 的工作机制。 特别说明: 题目 1-68 属于【Kubernetes】的常规概念题,即 “ 汇总(一)~(二十二)” 。 …...

在 Windows 上安装和配置 NVIDIA 驱动程序、CUDA、cuDNN 和 TensorRT
在 Windows 上安装和配置 NVIDIA 驱动程序、CUDA、cuDNN 和 TensorRT 1. 安装 NVIDIA 图形驱动程序2. 安装 CUDA Toolkit3. 安装 cuDNN4.安装 TensorRT5. 常见问题1. 安装 NVIDIA 图形驱动程序 首先需要安装兼容 CUDA 的 NVIDIA 驱动程序。 下载最新驱动: 访问 NVIDIA 官网,…...

京准电钟:NTP网络校时服务器助力校园体育场馆
京准电钟:NTP网络校时服务器助力校园体育场馆 京准电钟:NTP网络校时服务器助力校园体育场馆 体育场馆数字时钟系统可为观众及工作人员提供标准时间信息,为计算机及其他系统提供标准时间源,为协调场馆各业务系统与各部门的工作提供…...

9.25度小满一面
1.map的底层 2.unorder_map哈希表有自己实现过吗?哈希冲突 3.poll和epoll和select的优缺点、 4.线程同步机制是用来做什么的? 5.五子棋项目问题-- 算法题: 6.LeetCode.重排链表 给定一个单链表 L 的头节点 head ,单链表 L 表示为: L0…...

mysql批量修改表前缀
现有表前缀xh,批量修改为fax_需要怎么做 SELECTCONCAT(ALTER TABLE ,table_name, RENAME TO fax_,substring(table_name, 3),;) FROMinformation_schema. TABLES WHEREtable_name LIKE xh_%; 运行之后可以但是生成了一批修改表明的命令 此时批量复制执行就可实现批量修改表前…...

算法复杂度
1. 数据结构前⾔ 1.1数据结构 数据结构是计算机存储数据,组织数据的方式,指相互之间存在⼀种或多种特定关系的数 据元素的集合。常见的数据结构有线性表,树,图,哈希等。 1.2 算法 算法是一种计算过程,输…...

vue到出excel
安装 npm install exceljs npm install file-saver<template><button click"dade66">导出 66</button> </template><script> import ExcelJS from exceljs; import { saveAs } from file-saver;export default {data() {return {data…...

【延时队列的实现方式】
文章目录 延时队列JDK自带的延时队列实现Redis实现延迟队列RabbitMQ 延时队列 延时队列 延时队列是一种特殊类型的队列,它允许元素在特定时间间隔后才能被处理。这种队列在处理具有延迟需求的任务时非常有用,例如定时任务、事件驱动系统等 延时队列在项…...

Fyne ( go跨平台GUI )中文文档- 扩展Fyne (七)
本文档注意参考官网(developer.fyne.io/) 编写, 只保留基本用法 go代码展示为Go 1.16 及更高版本, ide为goland2021.2 这是一个系列文章: Fyne ( go跨平台GUI )中文文档-入门(一)-CSDN博客 Fyne ( go跨平台GUI )中文文档-Fyne总览(二)-CSDN博客 Fyne ( go跨平台GUI…...

Qt (19)【Qt 线程安全 | 互斥锁QMutex QMutexLocker | 条件变量 | 信号量】
阅读导航 引言一、互斥锁1. QMutex(1)基本概念(2)使用示例基本需求⭕thread.h⭕thread.cpp⭕widget.h⭕widget.cpp 2. QMutexLocker(1)基本概念(2)使用示例 3. QReadWriteLocker、QR…...

Java语法-类和对象(上)
1. 面向对象的初步认识 1.1 什么是面向对象 概念: Java是一门纯面向对象的语言(Object Oriented Program,简称OOP),在面向对象的世界里,一切皆为对象。 1.2 面向对象VS面向过程 如:洗衣服 面向过程: 注重的是洗衣服的过程,少了一个环节也不…...

Presto如何配置资源队列或资源组
Presto的任务队列配置主要涉及到查询队列和资源组的配置,这些配置通常用于管理Presto集群中的查询执行和资源分配。但是注意这两个东西是共存,互补的关系,并不需要纠结那种配置方式更加出色 一、查询队列配置 Presto的查询队列配置主要通过…...

828华为云征文|使用Flexus X实例集成ES搜索引擎
目录 一、应用场景 1.1 Flexus X实例概述 1.2 ES搜索引擎 二、安装相关服务 2.1 安装Elasticsearch7.17.0 2.2 安装kibana7.17.0 三、开通安全组规则 四、整体感受 4.1 Flexus X实例 4.2 使用感觉 一、应用场景 1.1 Flexus X实例概述 Flexus X实例是华为云推出的一款…...

【设计模式-访问者模式】
定义 访问者模式(Visitor Pattern)是一种行为型设计模式,允许你在不修改已有类的情况下向这些类添加新的功能或行为。它通过将操作的执行逻辑从对象的类中分离出来,使得你可以在保持类的封闭性(符合开闭原则ÿ…...
)
一元运算符(自增自减)
一、一元运算符 一元运算符,只需要一个操作数 1. 正号 正号不会对数字产生任何影响 2.-负号 负号可以对数字进行负号的取反 对于非Number的值,会将先转换为Number,在进行运算: 可以对一个其他的数据类型使用,来将其转换为n…...

利用最小二乘法找圆心和半径
#include <iostream> #include <vector> #include <cmath> #include <Eigen/Dense> // 需安装Eigen库用于矩阵运算 // 定义点结构 struct Point { double x, y; Point(double x_, double y_) : x(x_), y(y_) {} }; // 最小二乘法求圆心和半径 …...

Java多线程实现之Callable接口深度解析
Java多线程实现之Callable接口深度解析 一、Callable接口概述1.1 接口定义1.2 与Runnable接口的对比1.3 Future接口与FutureTask类 二、Callable接口的基本使用方法2.1 传统方式实现Callable接口2.2 使用Lambda表达式简化Callable实现2.3 使用FutureTask类执行Callable任务 三、…...

C# 类和继承(抽象类)
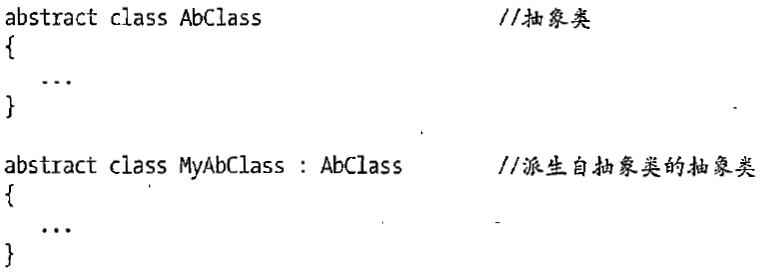
抽象类 抽象类是指设计为被继承的类。抽象类只能被用作其他类的基类。 不能创建抽象类的实例。抽象类使用abstract修饰符声明。 抽象类可以包含抽象成员或普通的非抽象成员。抽象类的成员可以是抽象成员和普通带 实现的成员的任意组合。抽象类自己可以派生自另一个抽象类。例…...
)
OpenLayers 分屏对比(地图联动)
注:当前使用的是 ol 5.3.0 版本,天地图使用的key请到天地图官网申请,并替换为自己的key 地图分屏对比在WebGIS开发中是很常见的功能,和卷帘图层不一样的是,分屏对比是在各个地图中添加相同或者不同的图层进行对比查看。…...

CMake控制VS2022项目文件分组
我们可以通过 CMake 控制源文件的组织结构,使它们在 VS 解决方案资源管理器中以“组”(Filter)的形式进行分类展示。 🎯 目标 通过 CMake 脚本将 .cpp、.h 等源文件分组显示在 Visual Studio 2022 的解决方案资源管理器中。 ✅ 支持的方法汇总(共4种) 方法描述是否推荐…...

html-<abbr> 缩写或首字母缩略词
定义与作用 <abbr> 标签用于表示缩写或首字母缩略词,它可以帮助用户更好地理解缩写的含义,尤其是对于那些不熟悉该缩写的用户。 title 属性的内容提供了缩写的详细说明。当用户将鼠标悬停在缩写上时,会显示一个提示框。 示例&#x…...

C# 求圆面积的程序(Program to find area of a circle)
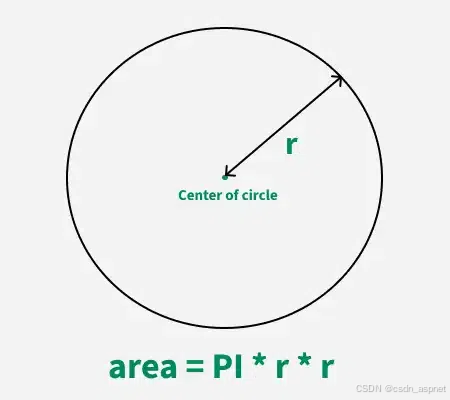
给定半径r,求圆的面积。圆的面积应精确到小数点后5位。 例子: 输入:r 5 输出:78.53982 解释:由于面积 PI * r * r 3.14159265358979323846 * 5 * 5 78.53982,因为我们只保留小数点后 5 位数字。 输…...

管理学院权限管理系统开发总结
文章目录 🎓 管理学院权限管理系统开发总结 - 现代化Web应用实践之路📝 项目概述🏗️ 技术架构设计后端技术栈前端技术栈 💡 核心功能特性1. 用户管理模块2. 权限管理系统3. 统计报表功能4. 用户体验优化 🗄️ 数据库设…...

在QWebEngineView上实现鼠标、触摸等事件捕获的解决方案
这个问题我看其他博主也写了,要么要会员、要么写的乱七八糟。这里我整理一下,把问题说清楚并且给出代码,拿去用就行,照着葫芦画瓢。 问题 在继承QWebEngineView后,重写mousePressEvent或event函数无法捕获鼠标按下事…...

Java编程之桥接模式
定义 桥接模式(Bridge Pattern)属于结构型设计模式,它的核心意图是将抽象部分与实现部分分离,使它们可以独立地变化。这种模式通过组合关系来替代继承关系,从而降低了抽象和实现这两个可变维度之间的耦合度。 用例子…...
