Prometheus 监控Harbor
你好!今天分享的是基于Prometheus监控harbor服务。
在之前的文章中分别介绍了harbor基于离线安装的高可用汲取设计和部署。那么,如果我们的harbor服务主机或者harbor服务及组件出现异常,我们该如何快速处理呢?
Harbor v2.2及以上版本支持配置Prometheus监控Harbor,所以你的harbor版本必须要大于2.2。
本篇文章以二进制的方式简单的部署Prometheus相关服务,可以帮助你快速的的实现Prometheus对harbor的监控。
Prometheus监控Harbor(二进制版)
一、部署说明
在harbor服务主机上部署:
-
prometheus
-
node-exporter
-
grafana
-
alertmanager
harbor版本:2.4.2 主机:192.168.2.22
二、Harbor启用metrics服务
2.1 停止Harbor服务
$ cd /app/harbor
$ docker-compose  down
2.2 修改harbor.yml配置
修改harbor的配置文件中metrics参数,启用harbor-exporter组件。
$ cat harbor.yml
### metrics配置部分
metric:enabled: true     #是否启用,需要修改为true(启用)port: 9099       #默认的端口为9090,与prometheus的端口会冲突(所以需要修改下)path: /metrics
对harbor不熟悉的建议对配置文件备份下!
2.3 配置注入组件
$ ./prepre
2.4 install安装harbor
$ ./install.sh  --with-notary  --with-trivy  --with-chartmuseum
$ docker-compose ps
NAME          COMMAND             SERVICE       STATUS            PORTS
chartmuseum     "./docker-entrypoint…"   chartmuseum    running (healthy)
harbor-core     "/harbor/entrypoint.…"   core         running (healthy)
harbor-db      "/docker-entrypoint.…"   postgresql     running (healthy)
harbor-exporter  "/harbor/entrypoint.…"   exporter      running
可以看到多了harbor-exporter组件。
三、Harbor指标说明
在前面启用了harbor-exporter监控组件后,可以通过curl命令去查看harbor暴露了哪些指标。
harbor暴露了以下4个关键组件的指标数据。
3.1 harbor-exporter组件指标
exporter组件指标与Harbor 实例配置相关,并从 Harbor 数据库中收集一些数据。指标可在
<harbor_instance>:<metrics_port>/<metrics_path>查看
$ curl http://192.168.2.22:9099/metrics
1)harbor_project_total
harbor_project_total 采集了公共和私人项目总共数量。
$ curl  http://192.168.2.22:9099/metrics | grep harbor_project_total
# HELP harbor_project_total Total projects number
# TYPE harbor_project_total gauge
harbor_project_total{public="true"} 1   # 公共项目的数量为“1”
harbor_project_total{public="false"} 1     #私有项目的数量
2)harbor_project_repo_total
项目(Project)中的存储库总数。
$ curl  http://192.168.2.22:9099/metrics | grep harbor_project_repo_total
# HELP harbor_project_repo_total Total project repos number
# TYPE harbor_project_repo_total gauge
harbor_project_repo_total{project_name="library",public="true"} 0
3)harbor_project_member_total
项目中的成员总数
$ curl  http://192.168.2.22:9099/metrics | grep harbor_project_member_total
# HELP harbor_project_member_total Total members number of a project
# TYPE harbor_project_member_total gauge
harbor_project_member_total{project_name="library"} 1  #项目library下有“1”个用户
4)harbor_project_quota_usage_byte
一个项目的总使用资源
$ curl  http://192.168.2.22:9099/metrics | grep harbor_project_quota_usage_byte
# HELP harbor_project_quota_usage_byte The used resource of a project
# TYPE harbor_project_quota_usage_byte gauge
harbor_project_quota_usage_byte{project_name="library"} 0
5)harbor_project_quota_byte
项目中设置的配额
$ curl  http://192.168.2.22:9099/metrics | grep harbor_project_quota_byte
# HELP harbor_project_quota_byte The quota of a project
# TYPE harbor_project_quota_byte gauge
harbor_project_quota_byte{project_name="library"} -1   #-1 表示不限制
6)harbor_artifact_pulled
项目中镜像拉取的总数
$ curl  http://192.168.2.22:9099/metrics | grep harbor_artifact_pulled
# HELP harbor_artifact_pulled The pull number of an artifact
# TYPE harbor_artifact_pulled gauge
harbor_artifact_pulled{project_name="library"} 0
7)harbor_project_artifact_total
项目中的工件类型总数,artifact_type , project_name, public ( true, false)
$ curl http://192.168.2.22:9099/metrics | grep harbor_project_artifact_total
8)harbor_health
Harbor状态$ curl http://192.168.2.22:9099/metrics | grep harbor_health
# HELP harbor_health Running status of Harbor
# TYPE harbor_health gauge
harbor_health 1 #1表示正常,0表示异常
9)harbor_system_info
Harbor 实例的信息,auth_mode ( db_auth, ldap_auth, uaa_auth, http_auth, oidc_auth),harbor_version, self_registration( true, false)
$ curl  http://192.168.2.22:9099/metrics | grep harbor_system_info
# HELP harbor_system_info Information of Harbor system
# TYPE harbor_system_info gauge
harbor_system_info{auth_mode="db_auth",harbor_version="v2.4.2-ef2e2e56",self_registration="false"} 1
10)harbor_up
Harbor组件运行状态,组件 ( chartmuseum, core, database, jobservice, portal, redis, registry, registryctl, trivy)
$ curl  http://192.168.2.22:9099/metrics | grep harbor_up
harbor_up Running status of harbor component
# TYPE harbor_up gauge
harbor_up{component="chartmuseum"} 1
harbor_up{component="core"} 1
harbor_up{component="database"} 1
harbor_up{component="jobservice"} 1
harbor_up{component="portal"} 1
harbor_up{component="redis"} 1
harbor_up{component="registry"} 1
harbor_up{component="registryctl"} 1
harbor_up{component="trivy"} 1   #Trivy扫描器运行状态
11)harbor_task_queue_size
队列中每种类型的任务总数,
$ curl  http://192.168.2.22:9099/metrics | grep harbor_task_queue_size
# HELP harbor_task_queue_size Total number of tasks
# TYPE harbor_task_queue_size gauge
harbor_task_queue_size{type="DEMO"} 0
harbor_task_queue_size{type="GARBAGE_COLLECTION"} 0
harbor_task_queue_size{type="IMAGE_GC"} 0
harbor_task_queue_size{type="IMAGE_REPLICATE"} 0
harbor_task_queue_size{type="IMAGE_SCAN"} 0
harbor_task_queue_size{type="IMAGE_SCAN_ALL"} 0
harbor_task_queue_size{type="P2P_PREHEAT"} 0
harbor_task_queue_size{type="REPLICATION"} 0
harbor_task_queue_size{type="RETENTION"} 0
harbor_task_queue_size{type="SCHEDULER"} 0
harbor_task_queue_size{type="SLACK"} 0
harbor_task_queue_size{type="WEBHOOK"} 0
12)harbor_task_queue_latency
多久前要处理的下一个作业按类型排入队列
$ curl  http://192.168.2.22:9099/metrics | grep harbor_task_queue_latency
# HELP harbor_task_queue_latency how long ago the next job to be processed was enqueued
# TYPE harbor_task_queue_latency gauge
harbor_task_queue_latency{type="DEMO"} 0
harbor_task_queue_latency{type="GARBAGE_COLLECTION"} 0
harbor_task_queue_latency{type="IMAGE_GC"} 0
harbor_task_queue_latency{type="IMAGE_REPLICATE"} 0
harbor_task_queue_latency{type="IMAGE_SCAN"} 0
harbor_task_queue_latency{type="IMAGE_SCAN_ALL"} 0
harbor_task_queue_latency{type="P2P_PREHEAT"} 0
harbor_task_queue_latency{type="REPLICATION"} 0
harbor_task_queue_latency{type="RETENTION"} 0
harbor_task_queue_latency{type="SCHEDULER"} 0
harbor_task_queue_latency{type="SLACK"} 0
harbor_task_queue_latency{type="WEBHOOK"} 0
13)harbor_task_scheduled_total
计划任务数
$ curl  http://192.168.2.22:9099/metrics | grep harbor_task_scheduled_total
# HELP harbor_task_scheduled_total total number of scheduled job
# TYPE harbor_task_scheduled_total gauge
harbor_task_scheduled_total 0
14)harbor_task_concurrency
池(Total)上每种类型的并发任务总数
$ curl  http://192.168.2.22:9099/metrics | grep harbor_task_concurrency
harbor_task_concurrency{pool="d4053262b74f0a7b83bc6add",type="GARBAGE_COLLECTION"} 0
3.2 harbor-core组件指标 ✔ Container harbor-core Started
Core services(Admin Server): 这是Harbor的核心功能,主要提供以下服务:
-> UI:提供图形化界面,帮助用户管理registry上的镜像(image), 并对用户进行授权。
-> webhook:为了及时获取registry 上image状态变化的情况, 在Registry上配置webhook,把状态变化传递给UI模块。
-> Auth服务:负责根据用户权限给每个docker push/pull命令签发token. Docker 客户端向Regiøstry服务发起的请求,如果不包含token,会被重定向到这里,获得token后再重新向Registry进行请求。
-> API: 提供Harbor RESTful API
-> Replication Job Service:提供多个 Harbor 实例之间的镜像同步功能。
-> Log collector:为了帮助监控Harbor运行,负责收集其他组件的log,供日后进行分析。
以下是从 Harbor core组件中提取的指标,获取格式:
<harbor_instance>:<metrics_port>/<metrics_path>?comp=core.
1)harbor_core_http_inflight_requests
请求总数,操作(Harbor API operationId中的值。一些遗留端点没有,因此标签值为)operationId``unknown
harbor-core组件的指标
$ curl  http://192.168.2.22:9099/metrics?comp=core |  grep harbor_core_http_inflight_requests
# HELP harbor_core_http_inflight_requests The total number of requests
# TYPE harbor_core_http_inflight_requests gauge
harbor_core_http_inflight_requests 0
2)harbor_core_http_request_duration_seconds
请求的持续时间,方法 ( GET, POST, HEAD, PATCH, PUT), 操作 ( Harbor APIoperationId中的 值。一些遗留端点没有, 所以标签值为), 分位数operationId``unknown
$ curl  http://192.168.2.22:9099/metrics?comp=core |  grep harbor_core_http_request_duration_seconds
# HELP harbor_core_http_request_duration_seconds The time duration of the requests
# TYPE harbor_core_http_request_duration_seconds summary
harbor_core_http_request_duration_seconds{method="GET",operation="GetHealth",quantile="0.5"} 0.001797115
harbor_core_http_request_duration_seconds{method="GET",operation="GetHealth",quantile="0.9"} 0.010445204
harbor_core_http_request_duration_seconds{method="GET",operation="GetHealth",quantile="0.99"} 0.010445204
3)harbor_core_http_request_total
请求总数:方法(GET, POST, HEAD, PATCH, PUT),操作([Harbor API operationId中的 值。一些遗留端点没有,因此标签值为)operationId``unknown
$ curl  http://192.168.2.22:9099/metrics?comp=core |  grep harbor_core_http_request_total
# HELP harbor_core_http_request_total The total number of requests
# TYPE harbor_core_http_request_total counter
harbor_core_http_request_total{code="200",method="GET",operation="GetHealth"} 14
harbor_core_http_request_total{code="200",method="GET",operation="GetInternalconfig"} 1
harbor_core_http_request_total{code="200",method="GET",operation="GetPing"} 176
harbor_core_http_request_total{code="200",method="GET",operation="GetSystemInfo"} 14
3.3 registry 组件指标
注册表,以下是从 Docker 发行版中提取的指标,查看指标方式:
<harbor_instance>:<metrics_port>/<metrics_path>?comp=registry.
1)registry_http_in_flight_requests
进行中的 HTTP 请求,处理程序
$ curl  http://192.168.2.22:9099/metrics?comp=registry |  grep registry_http_in_flight_requests
# HELP registry_http_in_flight_requests The in-flight HTTP requests
# TYPE registry_http_in_flight_requests gauge
registry_http_in_flight_requests{handler="base"} 0
registry_http_in_flight_requests{handler="blob"} 0
registry_http_in_flight_requests{handler="blob_upload"} 0
registry_http_in_flight_requests{handler="blob_upload_chunk"} 0
registry_http_in_flight_requests{handler="catalog"} 0
registry_http_in_flight_requests{handler="manifest"} 0
registry_http_in_flight_requests{handler="tags"} 0
2)registry_http_request_duration_seconds
HTTP 请求延迟(以秒为单位),处理程序、方法( ,,,, GET) POST,文件HEADPATCHPUT
$ curl http://192.168.2.22:9099/metrics?comp=registry | grep registry_http_request_duration_seconds
3)registry_http_request_size_bytes
HTTP 请求大小(以字节为单位)。
$ curl http://192.168.2.22:9099/metrics?comp=registry | grep registry_http_request_size_bytes
3.4 jobservice组件指标
以下是从 Harbor Jobservice 提取的指标,
可在<harbor_instance>:<metrics_port>/<metrics_path>?comp=jobservice.查看
1)harbor_jobservice_info
Jobservice的信息,
$ curl  http://192.168.2.22:9099/metrics?comp=jobservice | grep harbor_jobservice_info
# HELP harbor_jobservice_info the information of jobservice
# TYPE harbor_jobservice_info gauge
harbor_jobservice_info{node="f47de52e23b7:172.18.0.11",pool="35f1301b0e261d18fac7ba41",workers="10"} 1
2)harbor_jobservice_task_total
每个作业类型处理的任务数
$ curl http://192.168.2.22:9099/metrics?comp=jobservice | grep harbor_jobservice_task_tota
3)harbor_jobservice_task_process_time_seconds
任务处理时间的持续时间,即任务从开始执行到任务结束用了多少时间。
$ curl http://192.168.2.22:9099/metrics?comp=jobservice | grep harbor_jobservice_task_process_
四、部署Prometheus Server(二进制)
4.1 创建安装目录
$ mkdir /etc/prometheus
4.2 下载安装包
$ wget https://github.com/prometheus/prometheus/releases/download/v2.36.2/prometheus-2.36.2.linux-amd64.tar.gz -c
$ tar zxvf  prometheus-2.36.2.linux-amd64.tar.gz  -C  /etc/prometheus
$ cp prometheus-2.36.2.linux-amd64/{prometheus,promtool}   /usr/local/bin/
$ prometheus  --version    #查看版本
prometheus, version 2.36.2 (branch: HEAD, revision: d7e7b8e04b5ecdc1dd153534ba376a622b72741b)build user:       root@f051ce0d6050build date:       20220620-13:21:35go version:       go1.18.3platform:         linux/amd64
4.3 修改配置文件
在prometheus的配置文件中指定获取harbor采集的指标数据。
$ cp  prometheus-2.36.2.linux-amd64/prometheus.yml   /etc/prometheus/
$ cat <<EOF > /etc/prometheus/prometheus.yml
global:scrape_interval: 15sevaluation_interval: 15s
## 指定Alertmanagers地址
alerting:alertmanagers:- static_configs:- targets: ["192.168.2.10:9093"]  #填写Alertmanagers地址
## 配置告警规则文件
rule_files:   #指定告警规则- /etc/prometheus/rules.ymlscrape_configs:- job_name: "prometheus"static_configs:- targets: ["localhost:9090"]- job_name: 'node-exporter'static_configs:- targets:- '192.168.2.22:9100'- job_name: "harbor-exporter"scrape_interval: 20sstatic_configs:- targets: ['192.168.2.22:9099']- job_name: 'harbor-core'params:comp: ['core']static_configs:- targets: ['192.168.2.22:9099']- job_name: 'harbor-registry'params:comp: ['registry']static_configs:- targets: ['192.168.2.22:9099']- job_name: 'harbor-jobservice'params:comp: ['jobservice']static_configs:- targets: ['192.168.2.22:9099']
EOF
4.4 语法检查
检测配置文件的语法是否正确!
$ promtool check config  /etc/prometheus/prometheus.yml
Checking /etc/prometheus/prometheus.ymlSUCCESS: /etc/prometheus/prometheus.yml is valid prometheus config file syntaxChecking /etc/prometheus/rules.ymlSUCCESS: 6 rules found
4.5 创建服务启动文件
$ cat <<EOF >  /usr/lib/systemd/system/prometheus.service
[Unit]
Description=Prometheus Service
Documentation=https://prometheus.io/docs/introduction/overview/
wants=network-online.target
After=network-online.target[Service]
Type=simple
User=root
Group=root
ExecStart=/usr/local/bin/prometheus  --config.file=/etc/prometheus/prometheus.yml[Install]
WantedBy=multi-user.target
EOF
4.6 启动服务
$ systemctl daemon-reload
$ systemctl enable --now prometheus.service
$ systemctl status prometheus.service
4.7 浏览器访问Prometheus UI
在浏览器地址栏输入主机IP:9090访问Prometheus UI 管理界面。

五、部署node-exporter
node-exporter服务可采集主机的cpu、内存、磁盘等资源指标。
5.1 下载安装包
$ wget https://github.com/prometheus/node_exporter/releases/download/v1.2.2/node_exporter-1.2.2.linux-amd64.tar.gz
$ tar zxvf node_exporter-1.2.2.linux-amd64.tar.gz
$ cp node_exporter-1.2.2.linux-amd64/node_exporter   /usr/local/bin/
$ node_exporter  --version
node_exporter, version 1.2.2 (branch: HEAD, revision: 26645363b486e12be40af7ce4fc91e731a33104e)build user:       root@b9cb4aa2eb17build date:       20210806-13:44:18go version:       go1.16.7platform:         linux/amd64
5.2 创建服务启动文件
$ cat <<EOF >  /usr/lib/systemd/system/node-exporter.service
[Unit]
Description=Prometheus Node Exporter
After=network.target[Service]
ExecStart=/usr/local/bin/node_exporter
#User=prometheus[Install]
WantedBy=multi-user.target
EOF
5.3 启动服务
$ systemctl daemon-reload
$ systemctl enable --now node-exporter.service
$ systemctl status node-exporter.service
$ ss  -ntulp |  grep node_exporter
tcp    LISTEN     0   128   :::9100    :::*    users:(("node_exporter",pid=36218,fd=3)
5.4 查看node指标
通过curl获取node-exporter服务采集到的监控数据。
$ curl http://localhost:9100/metrics
六、Grafana部署与仪表盘设计
二进制部署Grafana v8.4.4服务。
6.1 下载安装包
$ wget https://dl.grafana.com/enterprise/release/grafana-enterprise-8.4.4.linux-amd64.tar.gz  -c
$ tar zxvf grafana-enterprise-8.4.4.linux-amd64.tar.gz  -C  /etc/
$ mv  /etc/grafana-8.4.4   /etc/grafana
$ cp -a  /etc/grafana/bin/{grafana-cli,grafana-server}  /usr/local/bin/
#安装依赖包
$ yum install -y  fontpackages-filesystem.noarch libXfont libfontenc lyx-fonts.noarch  xorg-x11-font-utils
6.2 安装插件
-
安装grafana时钟插件
$ grafana-cli plugins install grafana-clock-panel
-
安装Zabbix插件
$ grafana-cli plugins install alexanderzobnin-zabbix-app
-
安装服务器端图像渲染组件
$ yum install -y fontconfig freetype* urw-fonts
6.3 创建服务启动文件
$ cat <<EOF >/usr/lib/systemd/system/grafana.service
[Service]
Type=notify
ExecStart=/usr/local/bin/grafana-server -homepath /etc/grafana
Restart=on-failure[Install]
WantedBy=multi-user.target
EOF
-homepath:指定grafana的工作目录
6.4 启动grafana服务
$ systemctl daemon-reload
$ systemctl enable --now grafana.service
$ systemctl status grafana.service
$ ss  -ntulp |  grep grafana-server
tcp    LISTEN     0   128    :::3000   :::*   users:(("grafana-server",pid=120140,fd=9))
6.5 配置数据源
在浏览器地址栏输入主机IP和grafana服务端口访问Grafana UI界面后,添加Prometheus数据源。
默认用户密码:admin/admin
6.6 导入json模板
一旦您配置了Prometheus服务器以收集您的 Harbor 指标,您就可以使用 Grafana来可视化您的数据。Harbor 存储库中提供了一个 示例 Grafana 仪表板,可帮助您开始可视化 Harbor 指标。
Harbor官方提供了一个grafana的json文件模板。下载:
https://github.com/goharbor/harbor/blob/main/contrib/grafana-dashborad/metrics-example.json
七、部署AlertManager服务(扩展)
Alertmanager是一个独立的告警模块,接收Prometheus等客户端发来的警报,之后通过分组、删除重复等处理,并将它们通过路由发送给正确的接收器;
7.1 下载安装包
$ wget https://github.com/prometheus/alertmanager/releases/download/v0.23.0/alertmanager-0.23.0.linux-amd64.tar.gz
$ tar zxvf alertmanager-0.23.0.linux-amd64.tar.gz
$ cp  alertmanager-0.23.0.linux-amd64/{alertmanager,amtool}   /usr/local/bin/
7.2 修改配置文件
$ mkdir /etc/alertmanager
$ cat /etc/alertmanager/alertmanager.yml
global:resolve_timeout: 5mroute:group_by: ['alertname']group_wait: 10sgroup_interval: 10srepeat_interval: 1hreceiver: 'web.hook'
receivers:
- name: 'web.hook'webhook_configs:- url: 'http://127.0.0.1:5001/'
inhibit_rules:- source_match:severity: 'critical'target_match:severity: 'warning'equal: ['alertname', 'dev', 'instance']
7.3 创建服务启动文件
$ cat <<EOF >/usr/lib/systemd/system/alertmanager.service
[Unit]
Description=alertmanager
fter=network.target[Service]
ExecStart=/usr/local/bin/alertmanager --config.file=/etc/alertmanager/alertmanager.yml
ExecReload=/bin/kill -HUP $MAINPID
KillMode=process
Restart=on-failure[Install]
WantedBy=multi-user.target
EOF
7.4 启动服务
$ systemctl daemon-reload
$ systemctl enable --now alertmanager.service
$ systemctl status alertmanager.service
$ ss  -ntulp |  grep alertmanager
7.5 配置告警规则
前面在Prometheus server的配置文件中中指定了告警规则的文件为/etc/prometheus/rules.yml。
$ cat /etc/prometheus/rules.yml
groups:- name: Warningrules:- alert: NodeMemoryUsageexpr: 100 - (node_memory_MemFree_bytes + node_memory_Cached_bytes + node_memory_Buffers_bytes) / node_memory_MemTotal_bytes*100 > 80for: 1mlabels:status: Warningannotations:summary: "{{$labels.instance}}: 内存使用率过高"description: "{{$labels.instance}}: 内存使用率大于 80% (当前值: {{ $value }}"- alert: NodeCpuUsageexpr: (1-((sum(increase(node_cpu_seconds_total{mode="idle"}[1m])) by (instance)) / (sum(increase(node_cpu_seconds_total[1m])) by (instance)))) * 100 > 70for: 1mlabels:status: Warningannotations:summary: "{{$labels.instance}}: CPU使用率过高"description: "{{$labels.instance}}: CPU使用率大于 70% (当前值: {{ $value }}"- alert: NodeDiskUsageexpr: 100 - node_filesystem_free_bytes{fstype=~"xfs|ext4"} / node_filesystem_size_bytes{fstype=~"xfs|ext4"} * 100 > 80for: 1mlabels:status: Warningannotations:summary: "{{$labels.instance}}: 分区使用率过高"description: "{{$labels.instance}}: 分区使用大于 80% (当前值: {{ $value }}"- alert: Node-UPexpr: up{job='node-exporter'} == 0for: 1mlabels:status: Warningannotations:summary: "{{$labels.instance}}: 服务宕机"description: "{{$labels.instance}}: 服务中断超过1分钟"- alert: TCPexpr: node_netstat_Tcp_CurrEstab > 1000for: 1mlabels:status: Warningannotations:summary: "{{$labels.instance}}: TCP连接过高"description: "{{$labels.instance}}: 连接大于1000 (当前值: {{$value}})"- alert: IOexpr: 100 - (avg(irate(node_disk_io_time_seconds_total[1m])) by(instance)* 100) < 60for: 1mlabels:status: Warningannotations:summary: "{{$labels.instance}}: 流入磁盘IO使用率过高"description: "{{$labels.instance}}:流入磁盘IO大于60%  (当前值:{{$value}})"
推荐告警规则:
24小时内harbor存储用尽 predict_linear(harbor_system_volumes_bytes{storage="free"}[6h], 3600 * 24) < 0
harbor存储使用率大于80% sum(harbor_system_volumes_bytes{storage="free"}) / sum(harbor_system_volumes_bytes{storage="total"}) > 80%
20分钟内一个镜像被拉取5次 increase(harbor_image_pull_count[20m])>5
postgres 连接数即将接近上限 harbor_database_connections > 45
postgres 不健康 harbor_database_health < 1
harbor组件不健康 kube_deployment_status_replicas_available{namespace="harbor-2"} < 1
harbor数据库不健康 kube_statefulset_status_replicas_ready{namespace="harbor-2"} < 1
配置grafana面板
参考 grafana 官方dashboard,结合 ID: 16686 和 ID: 14075 基本就可以快速作出一个想要的harbor监控面板了。通过该面板可以直观看到harbor实例状态、整体存储量、各个项目核心信息(仓库 数、镜像容量、拉取数等)。
Grafana面板 http://grafana.cpaas.com/d/Nhhla1VGk/harbor-dashbord?orgId=1


至此,我们已经可以通过prometheus和grafana快速实现对harbor的监控了。通过监控发现harbor 仓库基础信息和存储量,对于存储量很大的project,我们可以按需在harbor中配置每天的清理测量(例如保留镜像最近10次推送的tag)。
相关文章:
Prometheus 监控Harbor
你好!今天分享的是基于Prometheus监控harbor服务。 在之前的文章中分别介绍了harbor基于离线安装的高可用汲取设计和部署。那么,如果我们的harbor服务主机或者harbor服务及组件出现异常,我们该如何快速处理呢? Harbor v2.2及以上…...

SQL 干货 | SQL 半连接
大多数数据库开发人员和管理员都熟悉标准的内、外、左和右连接类型。虽然可以使用 ANSI SQL 编写这些连接类型,但还有一些连接类型是基于关系代数运算符的,在 SQL 中没有语法表示。今天我们将学习一种这样的连接类型:半连接(Semi …...
洛谷 P1226:【模板】快速幂
【题目来源】https://www.luogu.com.cn/problem/P1226【题目描述】 给你三个整数 a,b,p,求 a^b mod p。【输入格式】 输入只有一行三个整数,分别代表 a,b,p。【输出格式】 输出一行一个字符串 a^b mod ps&a…...

nginx常规操作
Linux下查找Nginx配置文件位置 1、查看Nginx进程 ps -aux | grep nginx 圈出的就是Nginx的二进制文件 2、测试Nginx配置文件 /usr/sbin/nginx -t 可以看到nginx配置文件位置 3、nginx的使用(启动、重启、关闭) 首先利用配置文件启动nginx。 nginx -c /usr/local/nginx/conf…...

Docker镜像不能访问
Get "https://registry-1.docker.io/v2/": dial tcp 192.168.10.194:443: connect: connection refused Idea推送镜像至Harbor私服,报以上错误,Docker镜像地址不能访问,更新Harbor服务器Docker镜像地址,重启Docker服务…...

TCP simultaneous open测试
源代码 /*************************************************************************> File Name: common.h> Author: hsz> Brief:> Created Time: 2024年10月23日 星期三 09时47分51秒**********************************************************************…...

Spring 配置文件动态读取pom.xml中的属性
需求: 配置文件中的 spring.profiles.active${env}需要打包时动态绑定。 一、方案: 在pom.xml文件中配置启用占位符替换 <profiles><!-- 本地开发 --><profile><id>dev</id><properties><env>dev</env>…...

Konva 组,层级
代码: <template><div class"rect"><div class"header"> <!-- <el-button type"primary" click"show">展示</el-button>--> <!-- <el-button type"success&quo…...

vue图片加载失败的图片
1.vue图片加载失败的图片 这个问题发生在测试环境和开发本地,线上环境是可以的,测试环境估计被第三方屏蔽了 2.图片有,却加载不出来 <template v-slot:imageUrlsSlots"{ row }"><div class"flexRow rowCenter"&…...

终止,半成收入来自海外,收入可持续性被质疑
芬尼科技终止原因如下:芬尼科技4年期间经历了两次IPO失败,公司半成收入来自海外,然而公司泳池收入面临欧洲地区冲突冲击及德国新节能措施影响。交易所质疑其收入是否具有可持续性。 作者:Eric 来源:IPO魔女 9月25日&a…...

日常记录,使用springboot,vue2,easyexcel使实现字段的匹配导入
目前的需求是数据库字段固定,而excel的字段不固定,需要实现excel导入到一个数据库内。 首先是前端的字段匹配,显示数据库字段和表头字段 读取表头字段: 我这里实现的是监听器导入,需要新建一个listen类。 读Excel …...

Unable to open nested entry ‘********.jar‘ 问题解决
今天把现网版本的task的jar拖回来然后用7-zip打开拖了一个jar进去替换mysql-connector-java-5.1.47.jar 为 mysql-connector-java-5.1.27.jar 启动微服务的时候就报错下面的 Exception in thread "main" java.lang.IllegalStateException: Failed to get nested ar…...
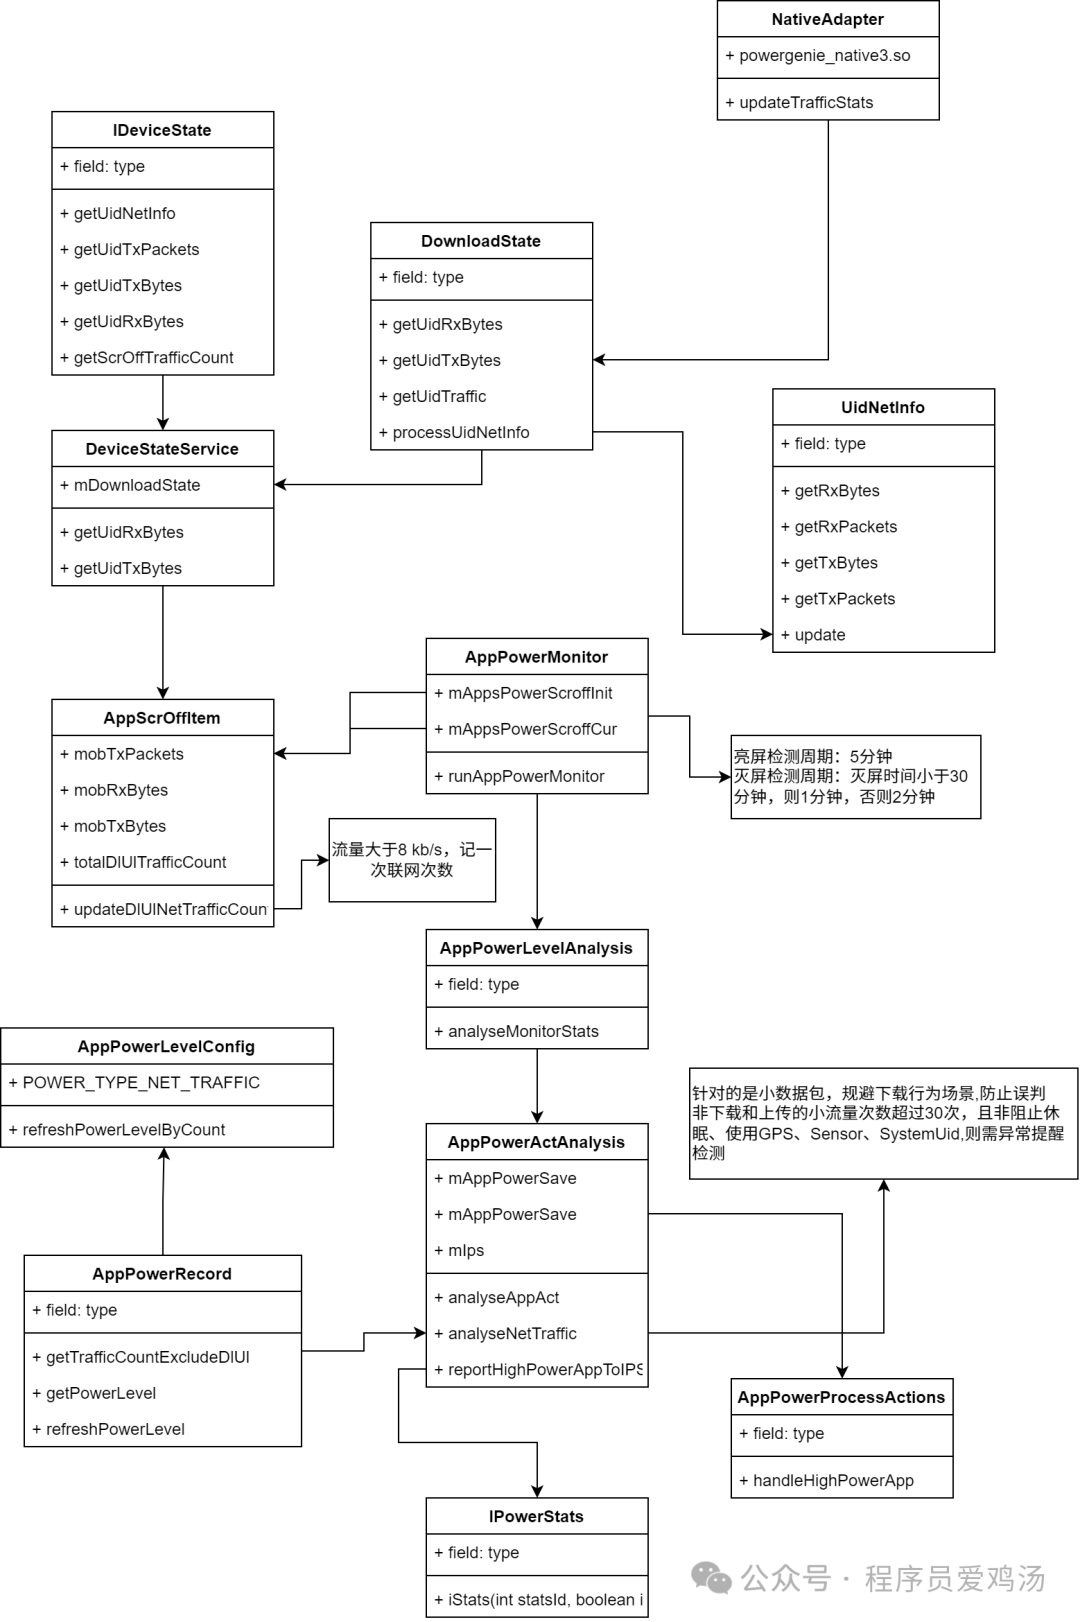
反编译华为-研究功耗联网监控日志
摘要 待机功耗中联网目前已知的盲点:App自己都不知道的push类型的被动联网、app下载场景所需时长、组播联网、路由器打醒AP。 竞品 策略 华为 灭屏使用handler定时检测(若灭屏30分钟内则周期1分钟,否则为2分钟),检…...

线程池——Java
一、前言 在字符串常量池中,字符串常量在java程序运行之前就已经创建好了,等程序运行起来后,就可以直接从常量池中拿到字符串并加载到内存中,这样的设计就省下了字符串的构造与销毁的内存开销。 二、优势 操作系统由内核与应用程…...

java 17天 TreeSet以及Collections
SortedSet TreeSet Collections 所有单值集合 1 SortedSet 特点:有序 唯一 实现类:TreeSet 利用TreeSet特有的对数据进行升序,再放到ArryList进行for下标倒序打印,或者利用自身的pollLast()取出最后元…...

JavaScript 第27章:构建工具与自动化
在现代JavaScript开发中,构建工具、代码转换工具、代码质量和代码格式化工具对于提高开发效率、保持代码整洁以及确保代码质量有着至关重要的作用。下面将分别介绍Webpack、Babel、ESLint和Prettier的配置与使用,并给出一些示例。 1. 构建工具ÿ…...

Android原生ROM出现WIFI显示网络连接受限,网络无法连接的问题
Android原生ROM出现WIFI显示网络连接受限,网络无法连接的问题 最近手里一台乐视的手机root后, 连接wifi时一直提示网络连接受限,wifi图标显示叹号. 但是不影响正常的网络访问. 解决办法: adb shell settings delete global captive_portal_modeadb shell settings put globa…...

如何实现网页上的闪烁效果
在网页上实现闪烁效果通常可以通过CSS或者JavaScript来完成。有两种方法:一种是使用纯CSS,另一种是结合JavaScript来创建更复杂的闪烁效果。 方法一:使用纯CSS CSS中可以使用animation属性来创建简单的动画效果,包括闪烁效果。这…...

事件总线—Event Bus 使用及讲解
一、工作原理 事件总线,主要用来实现非父子组件之间的传值。 它的工作原理:通过new Vue()再创建一个新的 Vue 实例对象bus,将这个新的实例对象作为桥梁,来实现两个组件之间的传值。 二、工作步骤 1、创建事件总线 bus 我们可以…...

信息安全工程师(67)网络流量清洗技术与应用
前言 网络流量清洗技术是现代网络安全领域中的一项关键技术,它主要用于过滤和清理网络流量中的恶意部分,确保正常的网络通信。 一、网络流量清洗技术的定义与原理 网络流量清洗技术,也称为流量清理(Traffic Scrubbing)…...
)
告别单调仪表盘:用LVGL Gauge控件打造一个智能家居温湿度监控界面(ESP32实战)
智能家居温湿度监控实战:用LVGL打造动态仪表盘 在智能家居系统中,实时监控环境参数是基础但关键的功能。传统数字显示虽然精确,但缺乏直观性;而精心设计的仪表盘不仅能提升用户体验,还能通过视觉反馈快速传达环境状态。…...

别再只用BigGantt了!这个免费JIRA甘特图插件Gantt Suite,配置简单速度快
轻量高效的JIRA甘特图解决方案:Gantt Suite全面评测与迁移指南 在项目管理领域,甘特图作为可视化排期的黄金标准已有百年历史。然而当这一经典工具遇上现代敏捷开发平台JIRA时,许多团队却陷入了两难境地——要么忍受BigGantt等老牌插件的臃肿…...

告别SVN提交冲突!手把手教你配置TortoiseSVN 1.10.5的忽略列表与清理功能
告别SVN提交冲突!手把手教你配置TortoiseSVN 1.10.5的忽略列表与清理功能 团队协作开发中,版本控制系统是必不可少的工具。Subversion(SVN)作为一款经典的集中式版本控制系统,至今仍在许多项目中发挥着重要作用。然而&…...

3步精通UE4SS游戏Mod开发:从注入到实战完全指南
3步精通UE4SS游戏Mod开发:从注入到实战完全指南 【免费下载链接】RE-UE4SS Injectable LUA scripting system, SDK generator, live property editor and other dumping utilities for UE4/5 games 项目地址: https://gitcode.com/gh_mirrors/re/RE-UE4SS UE…...

如何在Windows上快速安装安卓应用:APK Installer终极指南
如何在Windows上快速安装安卓应用:APK Installer终极指南 【免费下载链接】APK-Installer An Android Application Installer for Windows 项目地址: https://gitcode.com/GitHub_Trending/ap/APK-Installer 你是否曾经想要在Windows电脑上运行安卓应用&…...

DeFi预测市场套利机器人:延迟套利与结构性对冲策略详解
1. 项目概述:在2.7秒的缝隙中寻找确定性如果你在DeFi世界里寻找一种“低风险、高确定性”的套利机会,那么Polymarket这类预测市场可能是一个被低估的宝藏。这个项目,genoshide/polymarket-arbitrage-trading-bot,本质上是一个高度…...

AI驱动游戏开发:Godogen自动化流水线全解析
1. 项目概述:当AI成为你的游戏开发合伙人 如果你是一名独立游戏开发者,或者对用Godot引擎做点小玩意儿感兴趣,那你肯定体会过那种感觉:一个绝妙的点子在你脑海里盘旋,但一想到要从零开始搭场景、写脚本、画素材&#x…...

那些被“写不动“耽误的好想法,现在可以试了
脑子里的想法永远比手头的代码多。想做一个新的仲裁逻辑,想验证一种不同的流水线划分,想试试那个"也许能行"的微架构调整——但最终都没动手,因为光是搭环境、写testbench、跑仿真这一套下来,没有一两周根本出不了结论。…...

如何轻松解锁QQ音乐加密文件:qmcdump实战指南
如何轻松解锁QQ音乐加密文件:qmcdump实战指南 【免费下载链接】qmcdump 一个简单的QQ音乐解码(qmcflac/qmc0/qmc3 转 flac/mp3),仅为个人学习参考用。 项目地址: https://gitcode.com/gh_mirrors/qm/qmcdump 你是否曾经下载…...

BookGet:一键下载全球50+图书馆古籍资源的智能工具指南
BookGet:一键下载全球50图书馆古籍资源的智能工具指南 【免费下载链接】bookget bookget 数字古籍图书下载工具。 项目地址: https://gitcode.com/gh_mirrors/bo/bookget 你是否曾为查找古籍资料而奔波于各大数字图书馆?是否因为复杂的下载流程而…...