【python】matplotlib(animation)

文章目录
- 1、matplotlib.animation
- 1.1、FuncAnimation
- 1.2、修改 matplotlib 背景
- 2、matplotlib + imageio
- 2.1、折线图
- 2.2、条形图
- 2.3、散点图
- 3、参考
1、matplotlib.animation
1.1、FuncAnimation
matplotlib.animation.FuncAnimation 是 Matplotlib 库中用于创建动画的一个类。它允许你通过循环调用一个函数来更新图表,从而生成动画效果。这个函数通常被称为“更新函数”,它决定了每一帧图表的样子。FuncAnimation 类提供了一种灵活而强大的方式来创建和展示动画,使得数据可视化更加生动和直观。
(1)基本用法
使用 FuncAnimation 创建动画的基本步骤如下:
- 准备数据:首先,你需要准备好用于动画的数据。这可能包括一系列的X和Y坐标点、颜色、大小等,具体取决于你要制作的动画类型。
- 创建图形和轴:使用 Matplotlib 创建图形(Figure)和轴(Axes)对象,这些对象将作为动画的画布。
- 定义更新函数:编写一个函数,这个函数接受当前的帧号(或其他参数)作为输入,并返回一个更新后的图形元素状态。例如,如果你正在制作一个点的移动动画,这个函数可能会更新点的位置。
- 创建 FuncAnimation 对象:使用 FuncAnimation 类创建一个动画对象。你需要指定图形对象、轴对象、更新函数、帧数(或时间间隔)、以及其他可选参数(如重复次数、初始延迟等)。
- 显示或保存动画:最后,你可以使用 Matplotlib 的显示功能(如 plt.show())来查看动画,或者将其保存为文件(如GIF、MP4等)。
(2)示例代码
import numpy as np
import matplotlib.pyplot as plt
from matplotlib.animation import FuncAnimation# 准备数据
x = np.linspace(0, 2 * np.pi, 100)
y = np.sin(x)# 创建图形和轴
fig, ax = plt.subplots()
line, = ax.plot([], [], 'r-')  # 初始化一个空线条对象
ax.set_xlim(0, 2 * np.pi)      # 设置X轴范围
ax.set_ylim(-1.5, 1.5)         # 设置Y轴范围# 定义更新函数
def update(frame):line.set_data(x[:frame], y[:frame])  # 更新线条数据return line,# 创建 FuncAnimation 对象
ani = FuncAnimation(fig, update, frames=len(x), interval=50, blit=True)# 显示动画
plt.show()

在这个例子中,update 函数根据当前的帧号(frame)更新线条的数据,使得线条逐渐变长,模拟了一个点沿正弦曲线移动的动画效果。
再看一个例子
#coding=utf-8
import sysimport numpy as np
import matplotlib.pyplot as plt
import matplotlib.animation as animationfig, ax = plt.subplots()x = np.arange(0, 2*np.pi, 0.01)
line, = ax.plot(x, np.sin(x))def animate(i):line.set_ydata(np.sin(x + i/10.0))return line,def init():line.set_ydata(np.ma.array(x, mask=True))return line,ani = animation.FuncAnimation(fig, animate, np.arange(1, 200), init_func=init,interval=25, blit=True)
ani.save("animation.gif", writer="imagemagick", fps=30)
plt.show()

(3)matplotlib.animation.FuncAnimation
class matplotlib.animation.FuncAnimation(fig, func, frames=None, init_func=None, fargs=None, save_count=None, *, cache_frame_data=True, **kwargs)
def __init__(self,fig: Figure,func: (...) -> Iterable[Artist],frames: Iterable | int | () -> Generator | None = ...,init_func: () -> Iterable[Artist] | None = ...,fargs: tuple[Any, ...] | None = ...,save_count: int | None = ...,*,cache_frame_data: bool = ...,**kwargs: Any) -> None
`TimedAnimation` subclass that makes an animation by repeatedly calling a function *func*.  .. note::  You must store the created Animation in a variable that lives as long as the animation should run. Otherwise, the Animation object will be garbage-collected and the animation stops.  Parameters ---------- fig : `~matplotlib.figure.Figure` The figure object used to get needed events, such as draw or resize.  func : callable The function to call at each frame. The first argument will be the next value in *frames*. Any additional positional arguments can be supplied using `functools.partial` or via the *fargs* parameter.  The required signature is::  def func(frame, *fargs) -> iterable_of_artists  It is often more convenient to provide the arguments using `functools.partial`. In this way it is also possible to pass keyword arguments. To pass a function with both positional and keyword arguments, set all arguments as keyword arguments, just leaving the *frame* argument unset::  def func(frame, art, *, y=None): ...  ani = FuncAnimation(fig, partial(func, art=ln, y='foo'))  If ``blit == True``, *func* must return an iterable of all artists that were modified or created. This information is used by the blitting algorithm to determine which parts of the figure have to be updated. The return value is unused if ``blit == False`` and may be omitted in that case.  frames : iterable, int, generator function, or None, optional Source of data to pass *func* and each frame of the animation  - If an iterable, then simply use the values provided. If the iterable has a length, it will override the *save_count* kwarg.  - If an integer, then equivalent to passing ``range(frames)``  - If a generator function, then must have the signature::  def gen_function() -> obj  - If *None*, then equivalent to passing ``itertools.count``.  In all of these cases, the values in *frames* is simply passed through to the user-supplied *func* and thus can be of any type.  init_func : callable, optional A function used to draw a clear frame. If not given, the results of drawing from the first item in the frames sequence will be used. This function will be called once before the first frame.  The required signature is::  def init_func() -> iterable_of_artists  If ``blit == True``, *init_func* must return an iterable of artists to be re-drawn. This information is used by the blitting algorithm to determine which parts of the figure have to be updated. The return value is unused if ``blit == False`` and may be omitted in that case.  fargs : tuple or None, optional Additional arguments to pass to each call to *func*. Note: the use of `functools.partial` is preferred over *fargs*. See *func* for details.  save_count : int, optional Fallback for the number of values from *frames* to cache. This is only used if the number of frames cannot be inferred from *frames*, i.e. when it's an iterator without length or a generator.  interval : int, default: 200 Delay between frames in milliseconds.  repeat_delay : int, default: 0 The delay in milliseconds between consecutive animation runs, if *repeat* is True.  repeat : bool, default: True Whether the animation repeats when the sequence of frames is completed.  blit : bool, default: False Whether blitting is used to optimize drawing. Note: when using blitting, any animated artists will be drawn according to their zorder; however, they will be drawn on top of any previous artists, regardless of their zorder.  cache_frame_data : bool, default: True Whether frame data is cached. Disabling cache might be helpful when frames contain large objects.
Params:
fig – The figure object used to get needed events, such as draw or resize.
func – The function to call at each frame. The first argument will be the next value in *frames*. Any additional positional arguments can be supplied using `functools.partial` or via the *fargs* parameter. The required signature is:: def func(frame, *fargs) -> iterable_of_artists It is often more convenient to provide the arguments using `functools.partial`. In this way it is also possible to pass keyword arguments. To pass a function with both positional and keyword arguments, set all arguments as keyword arguments, just leaving the *frame* argument unset:: def func(frame, art, *, y=None): ... ani = FuncAnimation(fig, partial(func, art=ln, y='foo')) If ``blit == True``, *func* must return an iterable of all artists that were modified or created. This information is used by the blitting algorithm to determine which parts of the figure have to be updated. The return value is unused if ``blit == False`` and may be omitted in that case.
frames – Source of data to pass *func* and each frame of the animation - If an iterable, then simply use the values provided. If the iterable has a length, it will override the *save_count* kwarg. - If an integer, then equivalent to passing ``range(frames)`` - If a generator function, then must have the signature:: def gen_function() -> obj - If *None*, then equivalent to passing ``itertools.count``. In all of these cases, the values in *frames* is simply passed through to the user-supplied *func* and thus can be of any type.
init_func – A function used to draw a clear frame. If not given, the results of drawing from the first item in the frames sequence will be used. This function will be called once before the first frame. The required signature is:: def init_func() -> iterable_of_artists If ``blit == True``, *init_func* must return an iterable of artists to be re-drawn. This information is used by the blitting algorithm to determine which parts of the figure have to be updated. The return value is unused if ``blit == False`` and may be omitted in that case.
fargs – Additional arguments to pass to each call to *func*. Note: the use of `functools.partial` is preferred over *fargs*. See *func* for details.
save_count – Fallback for the number of values from *frames* to cache. This is only used if the number of frames cannot be inferred from *frames*, i.e. when it's an iterator without length or a generator.
cache_frame_data – Whether frame data is cached. Disabling cache might be helpful when frames contain large objects.
- fig:图形对象(Figure),用于获取绘制、调整大小等事件。这是动画的画布。
- func:可调用对象(函数),每帧调用的函数。该函数的第一个参数将是 frames 中的下一个值。任何其他的位置参数可以通过 fargs 参数提供。如果 blit 为 True,则该函数必须返回一个被修改或创建的所有图形元素(artists)的可迭代对象。
- frames:可迭代对象、整数、生成器函数或 None,可选。用于传递给 func 和动画的每一帧的数据源。如果是可迭代对象,则直接使用提供的值。如果是一个整数,则相当于传递 range(frames)。如果是一个生成器函数,则必须具有特定的签名。如果为 None,则相当于传递 itertools.count。
- init_func:可调用对象(函数),可选。用于绘制清空画面的函数。如果未提供,则将使用 frames 序列中的第一个项目的绘图结果。此函数将在第一帧之前被调用一次。如果 blit 为 True,则 init_func 必须返回一个将被重新绘制的图形元素(artists)的可迭代对象。
- fargs:元组或 None,可选。传递给每次调用 func 的附加参数。
- save_count:整数,可选。要缓存的 frames 中的值的数量。
- interval:数字,可选。帧之间的延迟时间(以毫秒为单位)。默认为 200。
- blit:布尔值,可选。控制是否使用 blitting 来优化绘制。当使用 blitting 时,只有变化的图形元素会被重新绘制,从而提高性能。
- cache_frame_data:布尔值,可选。控制是否缓存帧数据。默认为 True。
方法说明
- save:将动画保存为电影文件。
- to_html5_video:将动画转换为 HTML5 视频。
- to_jshtml:生成动画的 HTML 表示形式。
(4)注意事项
- 性能:对于复杂的动画,可能需要优化性能,比如通过减少每次更新的数据量(使用 blit=True 参数)或调整帧的更新间隔。
- 兼容性:保存动画时,不同的文件格式(如GIF、MP4)可能需要不同的编解码器支持。确保你的环境中安装了必要的编解码器。
- 交互性:动画在Jupyter Notebook等交互式环境中可能表现不同,需要根据具体环境调整显示方式。
1.2、修改 matplotlib 背景
在上述示例代码的情况下,我们引入一些修改颜色的配置,
import numpy as np
import matplotlib.pyplot as plt
from matplotlib.animation import FuncAnimation# 准备数据
x = np.linspace(0, 2 * np.pi, 100)
y = np.sin(x)# 创建图形和轴
fig, ax = plt.subplots()
line, = ax.plot([], [], 'r-')  # 初始化一个空线条对象
ax.set_xlim(0, 2 * np.pi)  # 设置X轴范围
ax.set_ylim(-1.5, 1.5)  # 设置Y轴范围# 修改轴背景颜色
ax.set_facecolor("orange")
# OR
# ax.set(facecolor = "orange")# 修改绘图背景颜色
fig.patch.set_facecolor('yellow')
fig.patch.set_alpha(1.0)# 移除图表的上边框和右边框
ax.spines['right'].set_visible(False)
ax.spines['top'].set_visible(False)# 设置虚线网格线
ax.set_axisbelow(True)
ax.yaxis.grid(color='gray', linestyle='dashed', alpha=0.7)# 定义更新函数
def update(frame):line.set_data(x[:frame], y[:frame])  # 更新线条数据return line,# 创建 FuncAnimation 对象
ani = FuncAnimation(fig, update, frames=len(x), interval=50, blit=True)# ani.save("animation.gif", writer="imagemagick", fps=30)# 显示动画
plt.show()
修改前
修改后

换个背景图试试
import numpy as np
import matplotlib.pyplot as plt
from matplotlib.animation import FuncAnimation# 准备数据
x = np.linspace(0, 20 * np.pi, 100)
y = 9* np.sin(x)# 创建图形和轴
fig, ax = plt.subplots()
line, = ax.plot([], [], 'r-')  # 初始化一个空线条对象img = plt.imread("123.jpg")
ax.imshow(img, extent=[0, 65, -10, 10])  # 横纵坐标范围# 定义更新函数
def update(frame):line.set_data(x[:frame], y[:frame])  # 更新线条数据return line,# 创建 FuncAnimation 对象
ani = FuncAnimation(fig, update, frames=len(x), interval=50, blit=True)ani.save("animation.gif", writer="imagemagick", fps=30)# 显示动画
plt.show()
原始图片

添加之后的效果

2、matplotlib + imageio
2.1、折线图
先画个简单的折线图
import os
import numpy as np
import matplotlib.pyplot as plt
import imageionp.random.seed(1234)# 生成40个取值在30-40的数
y = np.random.randint(30, 40, size=(40))
print(y)
"""
[33 36 35 34 38 39 31 37 39 36 38 30 35 30 39 36 32 30 35 32 36 33 37 3039 30 33 32 33 31 33 31 33 37 31 37 34 30 35 31]
"""
# 绘制折线
plt.plot(y)
# 设置y轴最小值和最大值
plt.ylim(20, 50)# 显示
plt.show()

保存最后几个点的数据,然后绘制成 gif
import os
import numpy as np
import matplotlib.pyplot as plt
import imageionp.random.seed(1234)# 生成40个取值在30-40的数
y = np.random.randint(30, 40, size=(40))
print(y)
"""
[33 36 35 34 38 39 31 37 39 36 38 30 35 30 39 36 32 30 35 32 36 33 37 3039 30 33 32 33 31 33 31 33 37 31 37 34 30 35 31]
"""
# 绘制折线
plt.plot(y)
# 设置y轴最小值和最大值
plt.ylim(20, 50)# 显示
plt.show()# 第一张图
plt.plot(y[:-3])
plt.ylim(20, 50)
plt.savefig('1.png')
plt.show()# 第二张图
plt.plot(y[:-2])
plt.ylim(20, 50)
plt.savefig('2.png')
plt.show()# 第三张图
plt.plot(y[:-1])
plt.ylim(20, 50)
plt.savefig('3.png')
plt.show()# 第四张图
plt.plot(y)
plt.ylim(20, 50)
plt.savefig('4.png')
plt.show()# 生成Gif
with imageio.get_writer('mygif.gif', mode='I') as writer:for filename in ['1.png', '2.png', '3.png', '4.png']:image = imageio.imread(filename)writer.append_data(image)
横坐标 0 至 36

横坐标 0 至 37

横坐标 0 至 38

横坐标 0 至 39

合并成为 gif(仅播放一次)

下面把所有点都保存下来,绘制动态图(仅播放一次)
import os
import numpy as np
import matplotlib.pyplot as plt
import imageionp.random.seed(1234)# 生成40个取值在30-40的数
y = np.random.randint(30, 40, size=(40))
print(y)
"""
[33 36 35 34 38 39 31 37 39 36 38 30 35 30 39 36 32 30 35 32 36 33 37 3039 30 33 32 33 31 33 31 33 37 31 37 34 30 35 31]
"""
# 绘制折线
plt.plot(y)
# 设置y轴最小值和最大值
plt.ylim(20, 50)# 显示
plt.show()filenames = []
num = 0
for i in y:num += 1# 绘制40张折线图plt.plot(y[:num])plt.ylim(20, 50)# 保存图片文件filename = f'{num}.png'filenames.append(filename)plt.savefig(filename)plt.close()# 生成gif
with imageio.get_writer('mygif.gif', mode='I') as writer:for filename in filenames:image = imageio.imread(filename)writer.append_data(image)# 删除40张折线图
for filename in set(filenames):os.remove(filename)

2.2、条形图
import os
import numpy as np
import matplotlib.pyplot as plt
import imageionp.random.seed(1234)x = [1, 2, 3, 4, 5]
coordinates_lists = [[0, 0, 0, 0, 0],[10, 30, 60, 30, 10],[70, 40, 20, 40, 70],[10, 20, 30, 40, 50],[50, 40, 30, 20, 10],[75, 0, 75, 0, 75],[0, 0, 0, 0, 0]]
filenames = []
for index, y in enumerate(coordinates_lists):# 条形图plt.bar(x, y)plt.ylim(0, 80)# 保存图片文件filename = f'{index}.png'filenames.append(filename)# 重复最后一张图形15帧(数值都为0),15张图片if (index == len(coordinates_lists) - 1):for i in range(15):filenames.append(filename)# 保存plt.savefig(filename)plt.close()# 生成gif
with imageio.get_writer('mygif.gif', mode='I') as writer:for filename in filenames:image = imageio.imread(filename)writer.append_data(image)# 删除20张柱状图
for filename in set(filenames):os.remove(filename)
生成的图片

生成的 gif(播放一次)

看起来太快了,优化代码使其平滑
import os
import numpy as np
import matplotlib.pyplot as plt
import imageionp.random.seed(1234)n_frames = 10  # 怕内存不够的话可以设置小一些
x = [1, 2, 3, 4, 5]
coordinates_lists = [[0, 0, 0, 0, 0],[10, 30, 60, 30, 10],[70, 40, 20, 40, 70],[10, 20, 30, 40, 50],[50, 40, 30, 20, 10],[75, 0, 75, 0, 75],[0, 0, 0, 0, 0]]
print('生成图表\n')
filenames = []
for index in np.arange(0, len(coordinates_lists) - 1):# 获取当前图像及下一图像的y轴坐标值y = coordinates_lists[index]y1 = coordinates_lists[index + 1]# 计算当前图像与下一图像y轴坐标差值y_path = np.array(y1) - np.array(y)for i in np.arange(0, n_frames + 1):# 分配每帧的y轴移动距离# 逐帧增加y轴的坐标值y_temp = (y + (y_path / n_frames) * i)# 绘制条形图plt.bar(x, y_temp)plt.ylim(0, 80)# 保存每一帧的图像filename = f'frame_{index}_{i}.png'filenames.append(filename)# 最后一帧重复,画面停留一会if (i == n_frames):for i in range(5):filenames.append(filename)# 保存图片plt.savefig(filename)plt.close()
print('保存图表\n')# 生成GIF
print('生成GIF\n')
with imageio.get_writer('mybars.gif', mode='I') as writer:for filename in filenames:image = imageio.imread(filename)writer.append_data(image)
print('保存GIF\n')print('删除图片\n')
# 删除图片
for filename in set(filenames):os.remove(filename)
print('完成')
原理解释统计柱状图当前帧和下一帧的差值,然后插帧平滑过去,这里插帧数量配置为了 n_frames = 10
最终生成的 gif 如下(仅播放一次),可以观察到平滑了很多

接下来美化下界面
import os
import numpy as np
import matplotlib.pyplot as plt
import imageionp.random.seed(1234)n_frames = 5
bg_color = '#95A4AD'
bar_color = '#283F4E'
gif_name = 'bars'
x = [1, 2, 3, 4, 5]
coordinates_lists = [[0, 0, 0, 0, 0],[10, 30, 60, 30, 10],[70, 40, 20, 40, 70],[10, 20, 30, 40, 50],[50, 40, 30, 20, 10],[75, 0, 75, 0, 75],[0, 0, 0, 0, 0]]
print('生成图表\n')
filenames = []
for index in np.arange(0, len(coordinates_lists) - 1):y = coordinates_lists[index]y1 = coordinates_lists[index + 1]y_path = np.array(y1) - np.array(y)for i in np.arange(0, n_frames + 1):y_temp = (y + (y_path / n_frames) * i)# 绘制条形图fig, ax = plt.subplots(figsize=(8, 4))ax.set_facecolor(bg_color)plt.bar(x, y_temp, width=0.4, color=bar_color)plt.ylim(0, 80)# 移除图表的上边框和右边框ax.spines['right'].set_visible(False)ax.spines['top'].set_visible(False)# 设置虚线网格线ax.set_axisbelow(True)ax.yaxis.grid(color='gray', linestyle='dashed', alpha=0.7)# 保存每一帧的图像filename = f'images/frame_{index}_{i}.png'filenames.append(filename)# 最后一帧重复,画面停留一会if (i == n_frames):for i in range(5):filenames.append(filename)# 保存图片plt.savefig(filename, dpi=96, facecolor=bg_color)plt.close()
print('保存图表\n')# 生成GIF
print('生成GIF\n')
with imageio.get_writer(f'{gif_name}.gif', mode='I') as writer:for filename in filenames:image = imageio.imread(filename)writer.append_data(image)
print('保存GIF\n')print('删除图片\n')
# 删除图片
for filename in set(filenames):os.remove(filename)
print('完成')
看看生成的 gif 效果(仅播放一次)

给图表添加了背景色、条形图上色、去除边框、增加网格线等。
2.3、散点图
import os
import numpy as np
import matplotlib.pyplot as plt
import imageionp.random.seed(1234)coordinates_lists = [[[0], [0]],[[100, 200, 300], [100, 200, 300]],[[400, 500, 600], [400, 500, 600]],[[400, 500, 600, 400, 500, 600], [400, 500, 600, 600, 500, 400]],[[500], [500]],[[0], [0]]]
gif_name = 'movie'
n_frames = 5
bg_color = '#95A4AD'
marker_color = '#283F4E'
marker_size = 25print('生成图表\n')
filenames = []
for index in np.arange(0, len(coordinates_lists) - 1):# 获取当前图像及下一图像的x与y轴坐标值x = coordinates_lists[index][0]  # 当前帧y = coordinates_lists[index][1]x1 = coordinates_lists[index + 1][0]  # 下一帧y1 = coordinates_lists[index + 1][1]# 查看两点差值while len(x) < len(x1):diff = len(x1) - len(x)x = x + x[:diff]y = y + y[:diff]while len(x1) < len(x):diff = len(x) - len(x1)x1 = x1 + x1[:diff]y1 = y1 + y1[:diff]# 计算路径x_path = np.array(x1) - np.array(x)y_path = np.array(y1) - np.array(y)for i in np.arange(0, n_frames + 1):# 计算当前位置x_temp = (x + (x_path / n_frames) * i)y_temp = (y + (y_path / n_frames) * i)# 绘制图表fig, ax = plt.subplots(figsize=(6, 6), subplot_kw=dict(aspect="equal"))ax.set_facecolor(bg_color)plt.scatter(x_temp, y_temp, c=marker_color, s=marker_size)plt.xlim(0, 1000)plt.ylim(0, 1000)# 移除边框线ax.spines['right'].set_visible(False)ax.spines['top'].set_visible(False)# 网格线ax.set_axisbelow(True)ax.yaxis.grid(color='gray', linestyle='dashed', alpha=0.7)ax.xaxis.grid(color='gray', linestyle='dashed', alpha=0.7)# 保存图片filename = f'images/frame_{index}_{i}.png'filenames.append(filename)if (i == n_frames):for i in range(5):filenames.append(filename)# 保存plt.savefig(filename, dpi=96, facecolor=bg_color)plt.close()
print('保存图表\n')# 生成GIF
print('生成GIF\n')
with imageio.get_writer(f'{gif_name}.gif', mode='I') as writer:for filename in filenames:image = imageio.imread(filename)writer.append_data(image)
print('保存GIF\n')print('删除图片\n')
# 删除图片
for filename in set(filenames):os.remove(filename)
print('完成')
思路,计算前后帧坐标点数量的差 diff ,然后 while 循环来复制以实现数量平衡 x = x + x[:diff],最后插帧平滑移动 x_temp = (x + (x_path / n_frames) * i)

3、参考
- 太强了,用 Matplotlib+Imageio 制作动画!
- 如何在 Matplotlib 中更改绘图背景
相关文章:
【python】matplotlib(animation)
文章目录 1、matplotlib.animation1.1、FuncAnimation1.2、修改 matplotlib 背景 2、matplotlib imageio2.1、折线图2.2、条形图2.3、散点图 3、参考 1、matplotlib.animation 1.1、FuncAnimation matplotlib.animation.FuncAnimation 是 Matplotlib 库中用于创建动画的一个…...
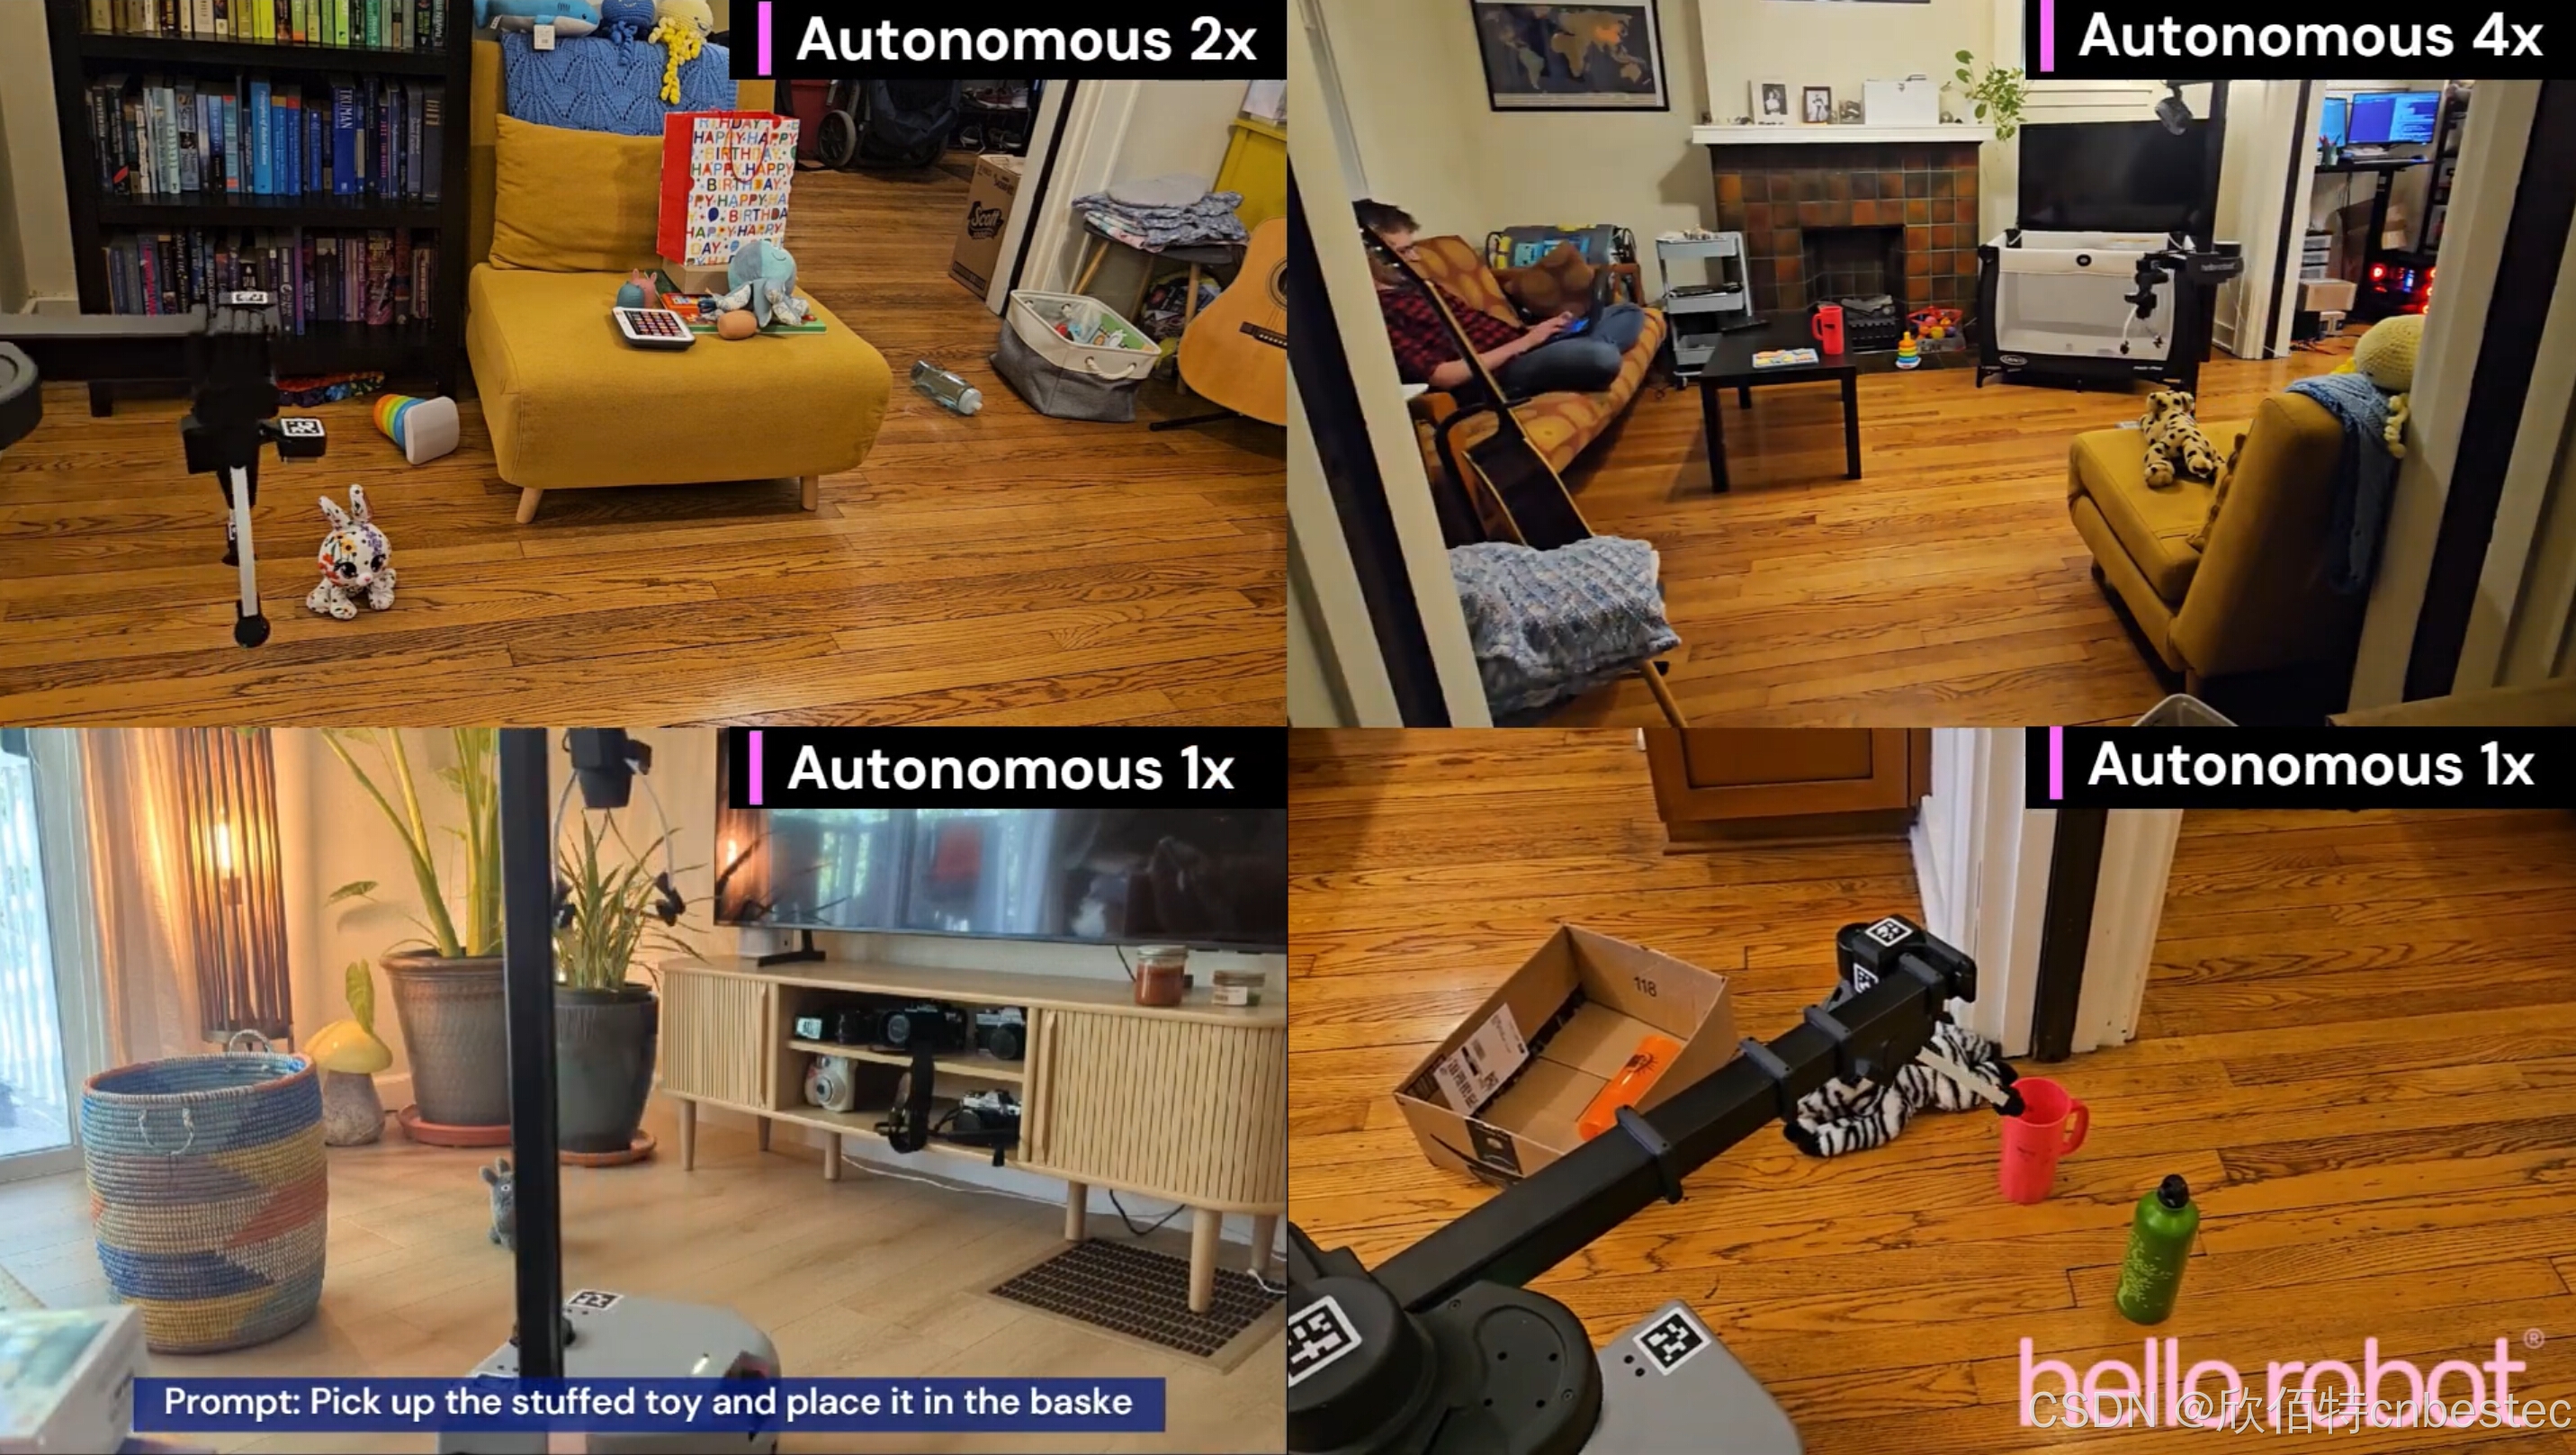
Hello Robot 推出Stretch 3移动操作机器人,赋能研究与商业应用
Hello Robot公司近日发布了其新一代开源移动操作机器人Stretch 3,这是一款高度灵活的机器人平台,专为机器人研究、教育实验和商业自动化设计。Stretch 3 结合了先进的移动机器人技术、灵巧操作能力和开源软件生态系统,为用户提供了一个功能强…...

从零到一:我的元宵灯谜小程序诞生记
缘起:一碗汤圆引发的灵感 去年元宵节,我正捧着热腾腾的汤圆刷朋友圈,满屏都是"转发锦鲤求灯谜答案"的动态。看着大家对着手机手忙脚乱地切换浏览器查答案,我突然拍案而起:为什么不做一个能即时猜灯谜的微信…...

Docker 安装与配置 Nginx
摘要 1、本文全面介绍了如何在 Docker 环境中安装和配置 Nginx 容器。 2、文中详细解释了如何设置 HTTPS 安全连接及配置 Nginx 以实现前后端分离的代理服务。 2、同时,探讨了通过 IP 和域名两种方式访问 Nginx 服务的具体配置方法 3、此外,文章还涵…...

Oracle常见语法
一、求交集 SELECT column1, column2 FROM table1 INTERSECT SELECT column1, column2 FROM table2;INTERSECT 操作符是 Oracle 和一些其他数据库(如 PostgreSQL 和 SQL Server)特有的集合操作符,在 MySQL 中并不直接支持。MYSQL同效果代码&a…...

在Vue3中使用Echarts的示例 两种方法
在Vue 3中使用ECharts可以通过两种主要方法实现:全局安装和组件封装。下面我将分别 介绍这两种方法的具体实现步骤。 方法1:全局安装 1.安装ECharts 在你的Vue项目中,首先需要安装ECharts。打开终端,运行以下命令: Bash copy code npm install ec…...

【docker】docker改动镜像并重新编译举例
docker改动镜像并重新编译举例 使用vllm启动Qwen VL 2.5出现报错 0.7.2 Docker Container doesnt support Qwen VL 2.5 Instruct 查看镜像 docker images 会发现本地有vllm/vllm-openai:v0.7.2镜像,id为f78c8f2f8ad5 空白文件夹中新建文件Dockerfile 写入&#…...

具身智能训练新思路!将生成视频用于训练机器人
将生成视频用于训练具身智能(Embodied AI)确实是近年来备受关注的前沿方向,这一思路通过结合生成式AI(如扩散模型、神经辐射场等)与机器人学习,为解决真实世界数据稀缺、训练成本高等问题提供了新可能。以下从技术逻辑、潜在优势、挑战及案例方向展开分析: 一、技术逻辑…...

15、深度学习-自学之路-反向传播程序展示、激活函数的应用,反向权重的更新、2层神经网络的应用,输入输出相关性的理解。
这个里面要学习和展示的内容会比较多,需要好好的认真思考 第一个要思考的就是:输入和输出相关性的理解,我们先拿一层的神经网络来说明一下, 输入有2个因素,对应有两个权重,输出有一个结果。 输入的两个因…...

【JavaEE进阶】依赖注入 DI详解
目录 🌴什么是依赖注入 🎄依赖注入的三种方法 🚩属性注⼊(Field Injection) 🚩Setter注入 🚩构造方法注入 🚩三种注⼊的优缺点 🌳Autowired存在的问题 🌲解决Autowired存在的…...

医疗影响分割 | 使用 Swin UNETR 训练自己的数据集(3D医疗影像分割教程)
<Swin UNETR: Swin Transformers for Semantic Segmentation of Brain Tumors in MRI Images> 代码地址:unetr 论文地址:https://arxiv.org/pdf/2201.01266 一、下载代码 在Github上下载代码,然后进入SWINUNETR,前两个是针对两个数据集(BRATS21、BTCV)的操作,这里…...

IGBT的两级关断
IGBT(绝缘栅双极型晶体管)的两级关断(Two-stage turn-off)是一种优化关断过程的方法,主要用于减少关断时的电压过冲和dv/dt(电压变化率)过高的问题,特别是在大功率应用中(…...

微服务与网关
什么是网关 背景 单体项目中,前端只用访问指定的一个端口8080,就可以得到任何想要的数据 微服务项目中,ip是不断变化的,端口是多个的 解决方案:网关 网关:就是网络的关口,负责请求的路由、转发…...

“云计算一哥”一口气发布6个大模型、3nm芯片!多模态还要搞Any-to-Any
金磊 发自 拉斯维加斯量子位 | 公众号 QbitAI 就在刚刚,云计算一哥亚马逊云科技,在大模型这件事儿上搞了波大的—— 亚马逊CEO Andy Jassy亲自站台re:Invent24,发布自家新款AI多模态系列大模型,名曰Amazon Nova。 而且是一口气涵盖…...

pytest生成报告no tests ran in 0.01s
除了基本的环境配置、用例名要以test_开头,有个地方是我自己忽略了,在执行时没有指定用例文件,所以没有找到。 if __name__ __main__:pytest.main(["testcases/test_demo.py","-svq", __file__, --alluredir./allure-r…...

如何修改DNS解析?
DNS(域名系统)就像互联网的“电话簿”,负责将我们输入的网址转换为计算机能够理解的IP地址。如果DNS解析出现问题,访问网站就会受到影响。那我们该如何修改DNS解析呢?接下来,我们就来介绍一下这个话题。 为什么要修改DNS解析? 使用默认的…...

PyTorch 中 `torch.cuda.amp` 相关警告的解决方法
在最近的写代码过程中,遇到了两个与 PyTorch 的混合精度训练相关的警告信息。这里随手记录一下。 警告内容 警告 1: torch.cuda.amp.autocast FutureWarning: torch.cuda.amp.autocast(args...) is deprecated. Please use torch.amp.autocast(cuda, args...) i…...

微服务组件LoadBalancer负载均衡
SpringCloud 从 2020.0.1 版本开始,移除了 Ribbon 组件,使⽤Spring Cloud LoadBalancer 组件来代 替 Ribbon 实现客户端负载均衡 loadbalancer负载均衡: 复制一份provider项目,服务名一致,端口号不一致,让consumer调…...

如何本地部署DeepSeek
第一步:安装ollama https://ollama.com/download 打开官网,选择对应版本 第二步:选择合适的模型 https://ollama.com/ 模型名称中的 1.5B、7B、8B 等数字代表模型的参数量(Parameters),其中 B 是英文 B…...

vite + axios 代理不起作用 404 无效
vite axios 代理不起作用 先看官方示例 export default defineConfig({server: {proxy: {// 字符串简写写法/foo: http://localhost:4567,// 选项写法/api: {target: http://jsonplaceholder.typicode.com,changeOrigin: true,rewrite: (path) > path.replace(/^\/api/, )…...

实在Agent实测:解决采购合同审核流程冗长与原材料交付周期拉长的架构之道
大家好,我是企业架构师老王。站在2026年5月这个时间节点回看,全球供应链的复杂程度已远超三年前的预判。近期我在为几家制造型企业做数字化诊断时发现,一个幽灵般的困境正在吞噬企业的利润:采购合同审核流程冗长,直接导…...

闯入漳州粉色几何秘境,复刻西班牙红墙浪漫
在福建漳州市漳浦县的火山岛自然生态风景区内,有一座以粉红色为主色调、线条利落的几何形建筑群。因其层层叠叠的阶梯、错落的平台与迷宫般的路径结构,与西班牙卡尔佩的“红墙”(La Muralla Roja)景观高度相似,被游客称…...

轻量级日志聚合器Shiplog:中小团队分布式日志管理实践
1. 项目概述:一个为开发者打造的轻量级日志聚合器如果你是一名后端开发者,或者正在维护一个分布式微服务系统,那么对“日志”这个词一定又爱又恨。爱的是,它是排查线上问题的唯一“时光机”;恨的是,当服务实…...

智慧校园平台建设要多少钱?这份预算规划指南帮你理清思路
✅作者简介:合肥自友科技 📌核心产品:智慧校园平台(包括教工管理、学工管理、教务管理、考务管理、后勤管理、德育管理、资产管理、公寓管理、实习管理、就业管理、离校管理、科研平台、档案管理、学生平台等26个子平台) 。公司所有人员均有多…...

Win10系统下极点五笔输入法的兼容性配置与TSF框架适配实践
1. 为什么Win10需要特殊配置才能用极点五笔? 很多从Win7升级到Win10的五笔用户都会发现,用了十几年的极点五笔突然变得不听话了。这背后其实藏着微软输入法框架的大变革——从传统的IMM(Input Method Manager)架构转向了TSF&#…...

别再死记Ld≠Lq了!从磁路角度,手把手教你区分永磁同步电机的凸极与隐极
永磁同步电机:从磁路本质破解凸极与隐极的认知迷思 在电机工程领域,永磁同步电机(PMSM)的凸极与隐极特性常被简化为"Ld≠Lq"的数学表述,这种表面化的理解就像仅通过体温判断疾病一样片面。真正掌握这一概念需要深入磁路层面&#x…...

基于视觉大模型的桌面自动化:Screen Vision技能实现AI操控电脑
1. 项目概述:让AI成为你的“数字双手” 你有没有想过,有一天你可以像指挥一个真人助手一样,用自然语言告诉AI:“帮我把桌面上的那个PDF文件拖到‘已处理’文件夹里”,或者“打开浏览器,搜索一下今天北京的…...

2026年项目管理工具选型指南:主流方案对比与Gitee核心优势解析
在数字化转型深入与研发效能要求不断提升的2026年,选择一款适配团队基因、能够无缝衔接管理与开发流程的项目管理工具,已成为企业提升协作效率、保障项目交付的关键。面对市场上从轻量级协作到重型研发管理的各类方案,企业选型往往面临工具割…...

紧密型医共体信息平台厂商行业白皮书:厂商实力及趋势分析
紧密型医共体信息平台厂商行业白皮书:厂商实力及趋势分析一、行业概况医共体信息平台是县域医疗卫生共同体建设的核心数字化工具。以县级医院为枢纽,平台连接县域内各级医疗机构及管理单位,实现数据互通、系统协同与资源共享,打破…...

基于MCP协议的制药研发智能数据管道:架构、部署与应用
1. 项目概述:当制药研发遇上智能数据管道如果你在制药行业或者生物科技领域待过,哪怕只是边缘岗位,也一定对“数据孤岛”和“信息滞后”这两个词深恶痛绝。新药研发的每个环节——从靶点发现、化合物筛选、临床前研究到临床试验——都在源源不…...