valgrind massif 详解(内存分配释放分析)
参考
https://valgrind.org/docs/manual/ms-manual.html
使用格式
valgrind --tool=massif [--massif-opts] prog [prog-args]
目的
记录每一次的malloc, free;
概念: malloc申请内存, 实际分配内存(字节对齐, 分配器的记录头, 等等原因)
对内存进行分析, 优化, 以达到资源优化, 性能优化(减少缺页, 提高缓存命中)
记录信息和读取信息
massif记录信息; 有一些参数
# 是否对 malloc, new, free, delete 等动态分配内存的函数进行采样? 默认采样;
--heap=<yes|no> [default: yes]
Specifies whether heap profiling should be done.# 如何指定内存分配对齐
--heap-admin=<size> [default: 8]
If heap profiling is enabled, gives the number of administrative bytes per block to use. This should be an estimate of the average, since it may vary. For example, the allocator used by glibc on Linux requires somewhere between 4 to 15 bytes per block, depending on various factors. That allocator also requires admin space for freed blocks, but Massif cannot account for this.# 栈上内存是否也进行跟踪: 临时变量内存分配释放;
--stacks=<yes|no> [default: no]
Specifies whether stack profiling should be done. This option slows Massif down greatly, and so is off by default. Note that Massif assumes that the main stack has size zero at start-up. This is not true, but doing otherwise accurately is difficult. Furthermore, starting at zero better indicates the size of the part of the main stack that a user program actually has control over.--pages-as-heap=<yes|no> [default: no]
Tells Massif to profile memory at the page level rather than at the malloc'd block level. See above for details.# 最大堆栈数量
--depth=<number> [default: 30]
Maximum depth of the allocation trees recorded for detailed snapshots. Increasing it will make Massif run somewhat more slowly, use more memory, and produce bigger output files.# 添加其他内存分配函数: 分配函数实际是 brk 系统调用, 也可以自己写一个分配器; 不用 glibc 的 malloc, free
--alloc-fn=<name>
Functions specified with this option will be treated as though they were a heap allocation function such as malloc. This is useful for functions that are wrappers to malloc or new, which can fill up the allocation trees with uninteresting information. This option can be specified multiple times on the command line, to name multiple functions.Note that the named function will only be treated this way if it is the top entry in a stack trace, or just below another function treated this way. For example, if you have a function malloc1 that wraps malloc, and malloc2 that wraps malloc1, just specifying --alloc-fn=malloc2 will have no effect. You need to specify --alloc-fn=malloc1 as well. This is a little inconvenient, but the reason is that checking for allocation functions is slow, and it saves a lot of time if Massif can stop looking through the stack trace entries as soon as it finds one that doesn't match rather than having to continue through all the entries.Note that C++ names are demangled. Note also that overloaded C++ names must be written in full. Single quotes may be necessary to prevent the shell from breaking them up. For example:--alloc-fn='operator new(unsigned, std::nothrow_t const&)'
--ignore-fn=<name>
Any direct heap allocation (i.e. a call to malloc, new, etc, or a call to a function named by an --alloc-fn option) that occurs in a function specified by this option will be ignored. This is mostly useful for testing purposes. This option can be specified multiple times on the command line, to name multiple functions.Any realloc of an ignored block will also be ignored, even if the realloc call does not occur in an ignored function. This avoids the possibility of negative heap sizes if ignored blocks are shrunk with realloc.The rules for writing C++ function names are the same as for --alloc-fn above.# 控制输出详细信息的阈值
--threshold=<m.n> [default: 1.0]
The significance threshold for heap allocations, as a percentage of total memory size. Allocation tree entries that account for less than this will be aggregated. Note that this should be specified in tandem with ms_print's option of the same name.--peak-inaccuracy=<m.n> [default: 1.0]
Massif does not necessarily record the actual global memory allocation peak; by default it records a peak only when the global memory allocation size exceeds the previous peak by at least 1.0%. This is because there can be many local allocation peaks along the way, and doing a detailed snapshot for every one would be expensive and wasteful, as all but one of them will be later discarded. This inaccuracy can be changed (even to 0.0%) via this option, but Massif will run drastically slower as the number approaches zero.# x轴的单位: i: 指令, 一行指令 x + 1; ms 按毫秒 + 1, B: 按malloc free的总字节数 + 1, 某个节点的 x 坐标位置表示当前采样前 malloc 和 free的内存总量, 如下案例;
--time-unit=<i|ms|B> [default: i]
The time unit used for the profiling. There are three possibilities: instructions executed (i), which is good for most cases; real (wallclock) time (ms, i.e. milliseconds), which is sometimes useful; and bytes allocated/deallocated on the heap and/or stack (B), which is useful for very short-run programs, and for testing purposes, because it is the most reproducible across different machines.# 详细采样频率: 默认10; 每次都采样可以设置为 1, 更多的内容, 但是有很多可能重复的, 但是更加详细, 推荐;
--detailed-freq=<n> [default: 10]
Frequency of detailed snapshots. With --detailed-freq=1, every snapshot is detailed.# 最大采样数量: 超过会丢弃之前的, 可以设置大一点;
--max-snapshots=<n> [default: 100]
The maximum number of snapshots recorded. If set to N, for all programs except very short-running ones, the final number of snapshots will be between N/2 and N.# 输出文件名; 不推荐修改, 推荐默认;
--massif-out-file=<file> [default: massif.out.%p]
Write the profile data to file rather than to the default output file, massif.out.<pid>. The %p and %q format specifiers can be used to embed the process ID and/or the contents of an environment variable in the name, as is the case for the core option --log-file.
采样内容解析ms_print: mvc, 数据和表示分离;
-h --help
Show the help message.--version
Show the version number.# 显示详情阈值
--threshold=<m.n> [default: 1.0]
Same as Massif's --threshold option, but applied after profiling rather than during.# x 轴的长度
--x=<4..1000> [default: 72]
Width of the graph, in columns.# y 轴的长度
--y=<4..1000> [default: 20]
Height of the graph, in rows.
各有各的参数: 采样参数控制采样行为, 输出参数控制输出格式;
程序
-g编译有调试信息;
采样执行
valgrind --tool=massif prog
采样控制: 输出文件名
--massif-out-file, 指定输出文件名;
默认 massif.out.<pid>
采样输出: 表:执行时的各种参数; 表: 采样数据输出(周期采样, 可控制周期)
ms_print massif.out.12345
执行参数
--------------------------------------------------------------------------------
Command:            example
Massif arguments:   (none)
ms_print arguments: massif.out.12797
--------------------------------------------------------------------------------
- 程序和参数
- 采样参数
ms_print执行参数
采样: 柱状图
    KB
19.63^                                                                       #|                                                                       #|                                                                       #|                                                                       #|                                                                       #|                                                                       #|                                                                       #|                                                                       #|                                                                       #|                                                                       #|                                                                       #|                                                                       #|                                                                       #|                                                                       #|                                                                       #|                                                                       #|                                                                       #|                                                                      :#|                                                                      :#|                                                                      :#0 +----------------------------------------------------------------------->ki0                                                                   113.4Number of snapshots: 25Detailed snapshots: [9, 14 (peak), 24]
- 时间轴, 采样, 详细采样
- 时间轴
x轴, 采样: 在某个时间进行采样, 这次采样有详细堆栈;:无堆栈, @有堆栈, #有堆栈且峰值;
时间轴: i指令为时间轴; ms为时间轴; B:累计涉及内存malloc free的内存都进行累加;
--------------------------------------------------------------------------------
Command:            ./a.out
Massif arguments:   --detailed-freq=1 --threshold=0 --max-snapshots=256 --heap-admin=0 --time-unit=B
ms_print arguments: --threshold=0 massif.out.277019
--------------------------------------------------------------------------------KB
1.000^                                    #                                   |                                  @@#@                                  |                                @@@@#@@@                                |                              @@@@@@#@@@@@                              |                             @@@@@@@#@@@@@@                             |                           @@@@@@@@@#@@@@@@@@@                          |                         @@@@@@@@@@@#@@@@@@@@@@                         |                       @@@@@@@@@@@@@#@@@@@@@@@@@@                       |                     @@@@@@@@@@@@@@@#@@@@@@@@@@@@@@                     |                    @@@@@@@@@@@@@@@@#@@@@@@@@@@@@@@@                    |                  @@@@@@@@@@@@@@@@@@#@@@@@@@@@@@@@@@@@@                 |                @@@@@@@@@@@@@@@@@@@@#@@@@@@@@@@@@@@@@@@@                |              @@@@@@@@@@@@@@@@@@@@@@#@@@@@@@@@@@@@@@@@@@@@              |            @@@@@@@@@@@@@@@@@@@@@@@@#@@@@@@@@@@@@@@@@@@@@@@@            |           @@@@@@@@@@@@@@@@@@@@@@@@@#@@@@@@@@@@@@@@@@@@@@@@@@           |         @@@@@@@@@@@@@@@@@@@@@@@@@@@#@@@@@@@@@@@@@@@@@@@@@@@@@@@        |       @@@@@@@@@@@@@@@@@@@@@@@@@@@@@#@@@@@@@@@@@@@@@@@@@@@@@@@@@@       |     @@@@@@@@@@@@@@@@@@@@@@@@@@@@@@@#@@@@@@@@@@@@@@@@@@@@@@@@@@@@@@     |   @@@@@@@@@@@@@@@@@@@@@@@@@@@@@@@@@#@@@@@@@@@@@@@@@@@@@@@@@@@@@@@@@@   |  @@@@@@@@@@@@@@@@@@@@@@@@@@@@@@@@@@#@@@@@@@@@@@@@@@@@@@@@@@@@@@@@@@@@  0 +----------------------------------------------------------------------->KB0                                                                   2.000Number of snapshots: 130Detailed snapshots: [0, 1, 2, 3, 4, 5, 6, 7, 8, 9, 10, 11, 12, 13, 14, 15, 16, 17, 18, 19, 20, 21, 22, 23, 24, 25, 26, 27, 28, 29, 30, 31, 32, 33, 34, 35, 36, 37, 38, 39, 40, 41
, 42, 43, 44, 45, 46, 47, 48, 49, 50, 51, 52, 53, 54, 55, 56, 57, 58, 59, 60, 61, 62, 63, 64, 65 (peak), 66, 67, 68, 69, 70, 71, 72, 73, 74, 75, 76, 77, 78, 79, 80, 81, 82, 83, 8
4, 85, 86, 87, 88, 89, 90, 91, 92, 93, 94, 95, 96, 97, 98, 99, 100, 101, 102, 103, 104, 105, 106, 107, 108, 109, 110, 111, 112, 113, 114, 115, 116, 117, 118, 119, 120, 121, 122,
123, 124, 125, 126, 127, 128, 129]--------------------------------------------------------------------------------n        time(B)         total(B)   useful-heap(B) extra-heap(B)    stacks(B)
--------------------------------------------------------------------------------0              0                0                0             0            0
00.00% (0B) (heap allocation functions) malloc/new/new[], --alloc-fns, etc.--------------------------------------------------------------------------------n        time(B)         total(B)   useful-heap(B) extra-heap(B)    stacks(B)
--------------------------------------------------------------------------------1             16               16                1            15            0
分配释放配对, 可以看到x轴刚好是y轴的两倍;
#include<stdlib.h>
int main() {void* s[100]{};
for(int i = 0 ; i < 64; i++)s[i] = malloc(1);
for(int i = 0 ; i < 64; i++)free(s[i]);
}
每一次分配1字节, 15字节对齐, 64*16 == 1024, malloc + free = 2048
默认采样规则: 有上线, 超过就丢弃, 周期性详细采样;
输出所有: --threashold=0
峰值统计, 不准确
free触发峰值统计;<1不显示堆栈,--peak-inaccuracy
采样表格
n: 采样编号time: 时间轴对应位置; 等于之前所有free + malloc字节和;total: 全部申请useful-heap: 实际申请;extra-heap: 对齐或分配器标记分配额外的;--heap-admin影响;--alignmentx=对齐;stack堆栈内存, 即分析静态变量的申请释放;
详细堆栈分析
案例输出
--------------------------------------------------------------------------------n        time(B)         total(B)   useful-heap(B) extra-heap(B)    stacks(B)
--------------------------------------------------------------------------------10         10,080           10,080           10,000            80            011         12,088           12,088           12,000            88            012         16,096           16,096           16,000            96            013         20,104           20,104           20,000           104            014         20,104           20,104           20,000           104            0
99.48% (20,000B) (heap allocation functions) malloc/new/new[], --alloc-fns, etc.
->49.74% (10,000B) 0x804841A: main (example.c:20)
|
->39.79% (8,000B) 0x80483C2: g (example.c:5)
| ->19.90% (4,000B) 0x80483E2: f (example.c:11)
| | ->19.90% (4,000B) 0x8048431: main (example.c:23)
| |
| ->19.90% (4,000B) 0x8048436: main (example.c:25)
|
->09.95% (2,000B) 0x80483DA: f (example.c:10)->09.95% (2,000B) 0x8048431: main (example.c:23)
详细采样
- 第
14次采样有详细信息记录;
为什么不是100%?:
前面说了, 因为对齐, 头等信息, 申请内存和实际申请内存有些许差异;
堆栈怎么理解
最顶层是内存分配函数: 即new,malloc, --alloc-fun=xx指定的函数等;
往下是当前这些内存的分配堆栈; 虽然可以一个堆栈一行, 但是因为有很多相同的栈; 所以节省空间, 更好显示;
free有没有堆栈?
free也会采样, 但是用的是分配的堆栈, free的堆栈不会记录;
怎么计算值
每一层的内存总和相同, 越往下拆分得越多;
为什么有的没有堆栈?
因为--threashold=1, 即少于1%的内存堆栈不显示;可以通过选项修改;
为什么采样比实际malloc,free函数多两个?
最初状态, 0; 终止状态, 终止的状态可以确定是否有内存泄漏;
相关文章:
)
valgrind massif 详解(内存分配释放分析)
参考 https://valgrind.org/docs/manual/ms-manual.html 使用格式 valgrind --toolmassif [--massif-opts] prog [prog-args]目的 记录每一次的malloc, free; 概念: malloc申请内存, 实际分配内存(字节对齐, 分配器的记录头, 等等原因) 对内存进行分析, 优化, 以达到资源…...
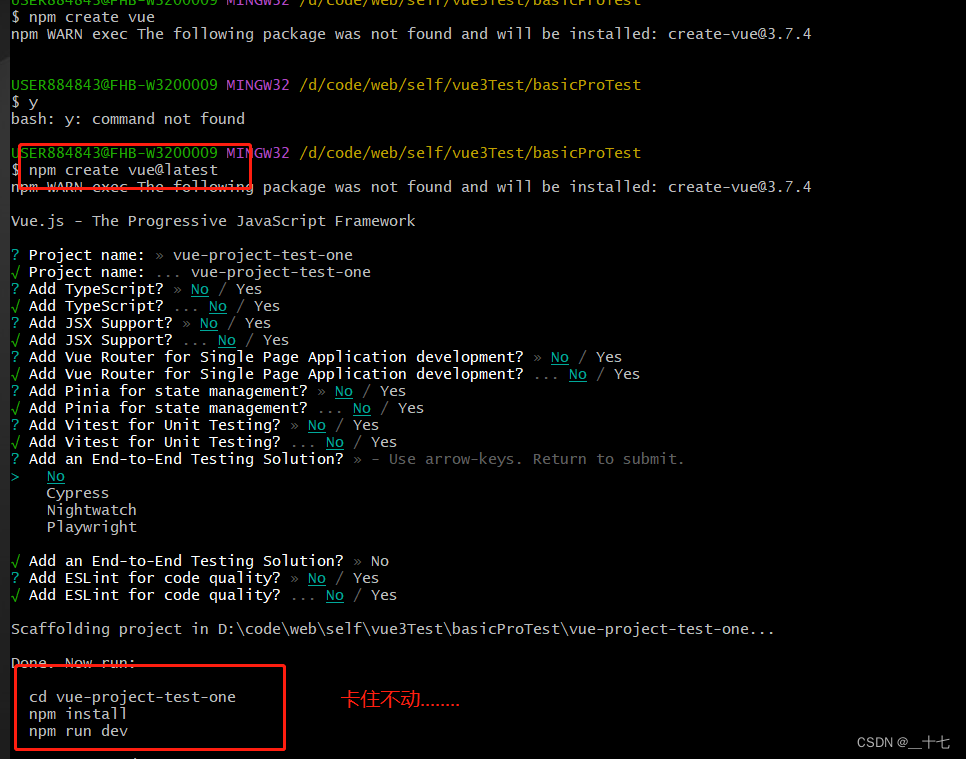
使用命令行创建一个vue项目卡住不动如何解决
问题 在使用命令去创建一个vue项目, 出现下面卡住不动的一个状态。 解决方案一 首先先ctrlc停止进入创建好的项目文件手动输入npm install 、npm run dev如果npm run dev 的时候 出现 ‘vite’ 相关的错误查看node版本是否是最新的稳定版本node -v查看安装源是否…...

七天学会C语言-第一天(C语言基本语句)
一、固定格式 这个是C程序的基本框架,需要记住!!! #include<stdio.h>int main(){return 0; }二、printf 语句 简单输出一句C程序: #include<stdio.h> int main(){printf("大家好,&quo…...

vue项目部署,出现两个ip的原因
我宁愿靠自己的力量打开我的前途,而不愿求有力者的垂青。——雨果 tags: 篇首语:本文由小常识网(cha138.com)小编为大家整理,主要介绍了vue项目部署,出现两个ip的原因相关的知识,希望对你有一定的参考价值。 参考技术A 在部署v…...

无涯教程-JavaScript - ASIN函数
描述 ASIN函数返回给定数字的反正弦或反正弦,并返回以弧度表示的Angular,介于-π/2和π/2之间。 语法 ASIN (number)争论 Argument描述Required/OptionalNumberThe sine of the angle you want and must be from -1 to 1.Required Notes 如果您希望ASIN函数返回的Angular以…...
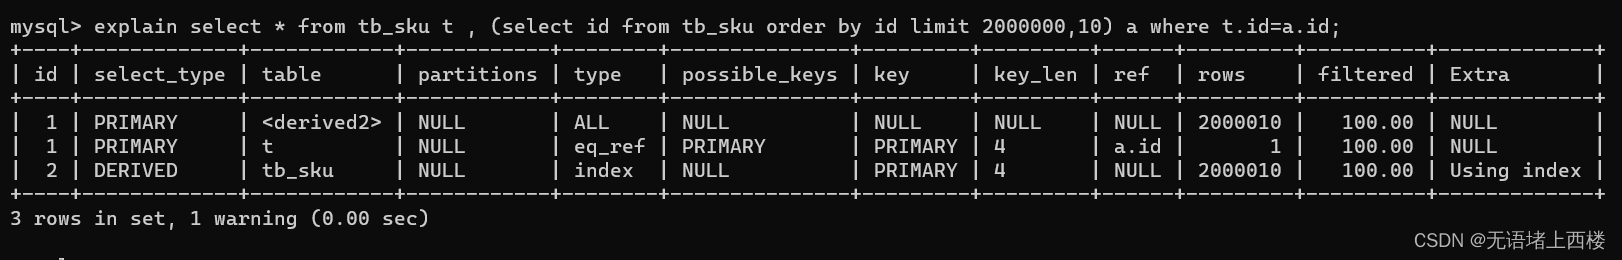
MYSQL的SQL优化
insert语句 开启事务 手动控制事务 start transaction; insert into tb_test values(1,Tom),(2,Cat),(3,Jerry); insert into tb_test values(4,Tom),(5,Cat),(6,Jerry); insert into tb_test values(7,Tom),(8,Cat),(9,Jerry); commit; 内存插入 load命令中用 fields te…...

lintcode 553 · 炸弹袭击【中等 数组+bfs+模拟】
题目 https://www.lintcode.com/problem/553 给定一个二维矩阵, 每一个格子可能是一堵墙 W,或者 一个敌人 E 或者空 0 (数字 0), 返回你可以用一个炸弹杀死的最大敌人数. 炸弹会杀死所有在同一行和同一列没有墙阻隔的敌人。 由于墙比较坚固,所以墙不会被摧毁.你只…...
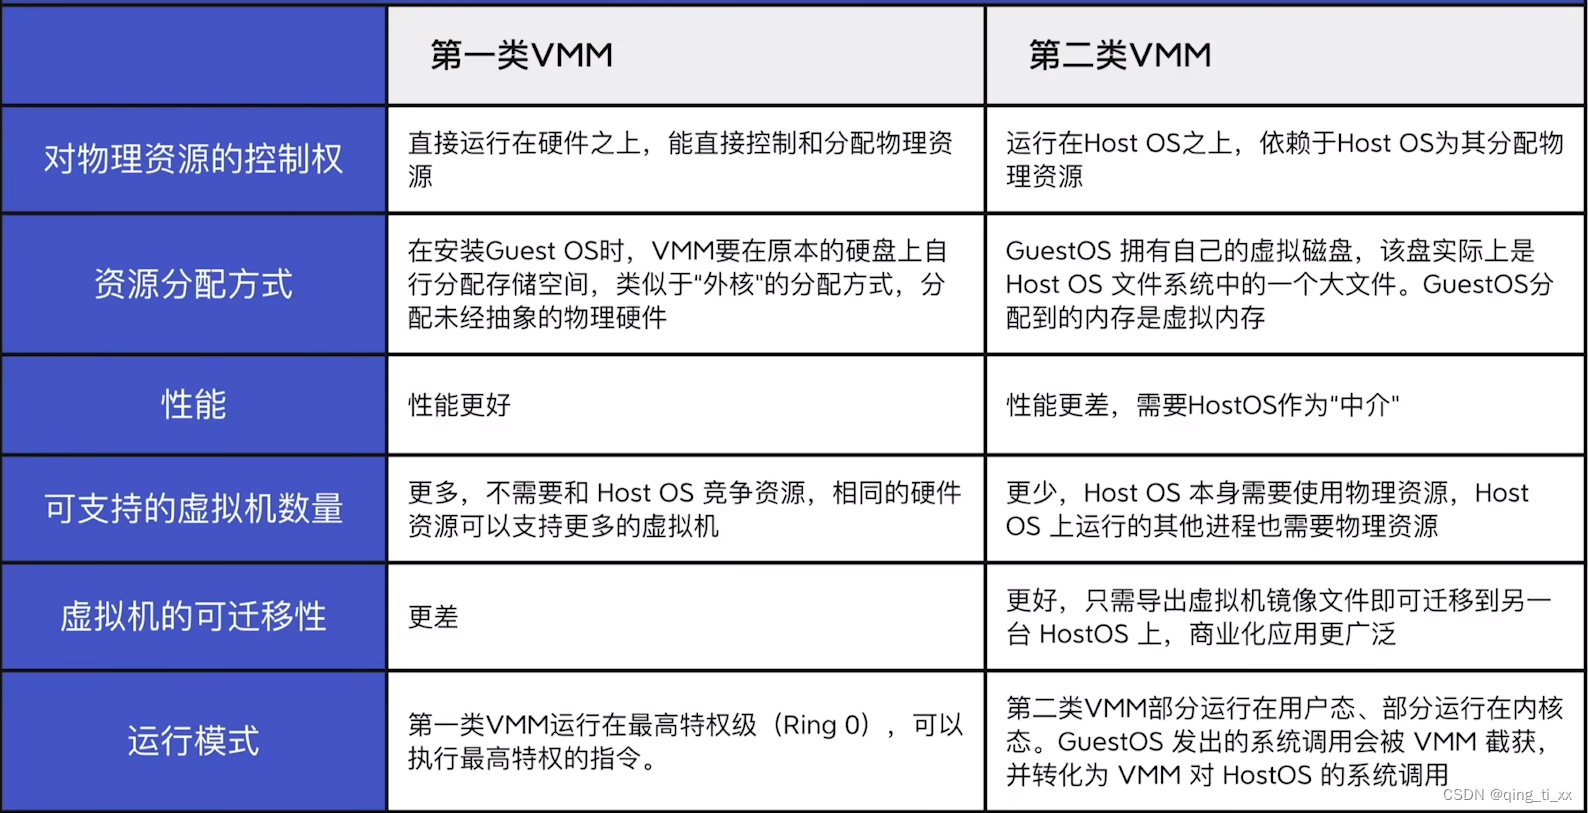
第一章 计算机系统概述 八、虚拟机
目录 一、传统虚拟机的结构 二、两类虚拟机管理程序 (1)定义: (2)区别:(考点) 一、传统虚拟机的结构 二、两类虚拟机管理程序 (1)定义: &…...

桶装水送水多水站送水员公众号h5开发
桶装水送水多水站送水员公众号h5开发 界面简洁易懂用户容易接受。 独家一户一码全家都能订水。 多个水站运营可按距离选择绑定。 三种支付方式水票、微信、到付。 强大员工系统老板坐享其成。 自由跑跑模式可招兼职送水员接单。 一户一码、全家享用 一户一码,精准…...
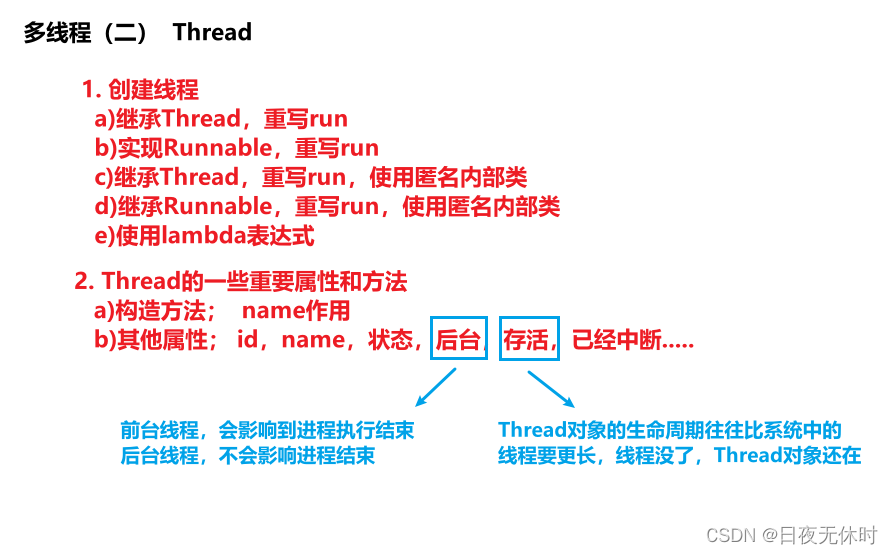
【JavaEE】多线程(二)
多线程(二) 文章目录 多线程(二)第一个多线程程序观察线程sleep创建线程继承Thread类,重写run方法实现Runnable, 重写run继承Thread,重写run实现Runnable,重写run基于lambda表达式 T…...

OkHttp 根据服务器返回的的过期时间设置缓存
据返回的缓存时间来缓存响应,可以通过使用OkHttp的CacheControl和ResponseCacheInterceptor来实现。以下是一个示例代码: // 创建缓存目录和缓存对象 File cacheDirectory new File(context.getCacheDir(), "http-cache"); int cacheSize 1…...

智能远程监考方案助力企业考试化繁为简
在音视频数字化之旅中,轻装上阵。 近年来,在数字化浪潮之下,远程考试频繁成为各领域热词,各企业也纷纷改革求新,将原本的企业内部考试转移到线上,从而获取更低廉的组考成本,更高的管理效率&…...
基于matlab实现的额 BP神经网络电力系统短期负荷预测未来(对比+误差)完整程序分享
基于matlab实现的额 BP神经网络电力系统短期负荷预测 完整程序: clear; clc; %%输入矢量P(15*10) P[0.2452 0.1466 0.1314 0.2243 0.5523 0.6642 0.7105 0.6981 0.6821 0.6945 0.7549 0.8215 0.2415 0.3027 0; 0.2217 0.1581 0.1408 0.23…...

WPF的_Expander控件
WPF Expander 是 WPF(Windows Presentation Foundation)框架中的一个控件,用于实现可以展开和折叠内容的可折叠面板。 Expander 控件通常由一个展开/折叠的标题(Header)和一个显示/隐藏的内容部分(Content…...

【MT7628AN】IOT | MT7628AN OpenWRT开发与学习
IOT | MT7628AN OpenWRT开发与学习 时间:2023-06-21 文章目录 `IOT` | `MT7628AN` `OpenWRT`[开发与学习](https://blog.csdn.net/I_feige/article/details/132911634?csdn_share_tail=%7B%22type%22%3A%22blog%22%2C%22rType%22%3A%22article%22%2C%22rId%22%3A%22132911634…...
)
基于Matlab实现自动泊车(垂直泊车)
自动泊车是一项非常有趣和实用的技术,它可以让车辆在没有人为干预的情况下自动停放在合适的位置上。在这篇文章中,我们将介绍如何使用Matlab实现自动泊车。 首先,我们需要了解自动泊车的基本原理。自动泊车系统通常包括车辆、传感器和控制算…...
笔试面试相关记录(4)
(1)实现防火墙的主流技术有哪些? 实施防火墙主要采用哪些技术 - 服务器 - 亿速云 (yisu.com) (2) char arr[][2] {a, b, c, d}; printf("%d", *(arr1)); 输出的是谁的地址?字符c 测试代码如下…...
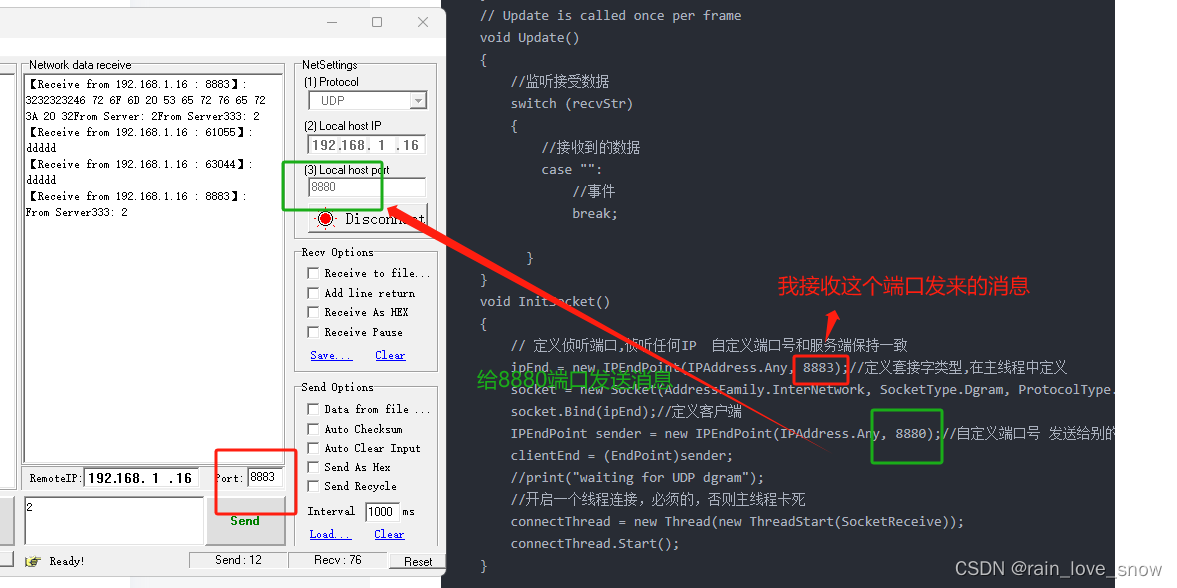
unity UDP 通信
客户端 接收端 : using System; using System.IO; using System.Collections; using System.Collections.Generic; using System.Net; using System.Net.Sockets; using System.Text; using System.Threading; using UnityEngine; using UnityEngine.UI;public cla…...

一篇解决JavaScript
华子目录 JavaScript介绍JavaScript的组成JavaScript书写位置内部外部 js注释js输入(prompt)js输出js变量js基本数据类型number(数值类型)string(字符串)Boolean(布尔类型)undefined…...
基础组件)
Unity UGUI(一)基础组件
文章目录 1.Text:文本框2.Image:精灵图3.RawImage:生图4.Button:按钮5.InputField:输入框6.Tooggle:选择框7.Slider:滑动条8.Dropdown:下拉菜单9.Scrollbar:滚动条10.Scr…...

千问 LeetCode 2281.巫师的总力量和 Python3实现
LeetCode 2281. 巫师的总力量和(Sum of Total Strength of Wizards) 是一道难度较高的题目,核心在于 贡献法 单调栈 前缀和的前缀和(prefix sum of prefix sums)。下面给出 清晰、高效、符合 Python3 习惯 的实现&am…...

ARM AMU与PMU架构详解及性能监控实践
1. ARM AMU与PMU架构概述在现代ARM处理器架构中,活动监控单元(AMU)和性能监控单元(PMU)是系统级性能分析的核心组件。作为芯片设计工程师,我经常需要与这些硬件监控模块打交道。AMU主要负责处理器内部活动的监控和统计,而PMU则提供更通用的性…...

使用 Taotoken 聚合 API 一周后的延迟与稳定性实际体验分享
🚀 告别海外账号与网络限制!稳定直连全球优质大模型,限时半价接入中。 👉 点击领取海量免费额度 使用 Taotoken 聚合 API 一周后的延迟与稳定性实际体验分享 1. 项目背景与接入动机 最近在开发一个需要调用多种大语言模型的个人…...

GPU资源利用率深度解析与优化实践
1. GPU资源利用率的核心概念与测量方法在HPC(高性能计算)领域,GPU资源利用率是评估计算效率的黄金指标。不同于简单的"使用率"概念,真正的GPU利用率是一个多维度的综合指标,涉及计算核心、内存控制器、缓存体…...

别再被FFmpeg里的12bpp搞懵了!手把手教你理解YUV420sp与BPP的关系
别再被FFmpeg里的12bpp搞懵了!手把手教你理解YUV420sp与BPP的关系 第一次在FFmpeg文档里看到"12bpp"这个描述时,我盯着屏幕愣了半天——RGB24格式不是8bpp吗?YUV420不是应该更节省空间吗?怎么反而变成了12bpp࿱…...

终极指南:如何让淘宝淘金币任务全自动完成,每天节省20分钟
终极指南:如何让淘宝淘金币任务全自动完成,每天节省20分钟 【免费下载链接】taojinbi 淘宝淘金币自动执行脚本,包含蚂蚁森林收取能量,芭芭农场全任务,解放你的双手 项目地址: https://gitcode.com/gh_mirrors/ta/tao…...

那些“假装很忙”的员工,正成为中小企业老板最大的管理黑洞
作为一名常年给企业做数字化诊断的顾问,我发现很多老板都有一个共同的“心病”:走进办公室,满屋子都是噼里啪啦的打字声,每个人看起来都在埋头苦干,但一到交付节点,进度总是莫名其妙地卡壳。这种“办公室伪…...
)
告别启动盘识别难题:手把手教你搞定CentOS 7在SR650上的UEFI启动与自定义分区(含/dev/sdX查找技巧)
告别启动盘识别难题:手把手教你搞定CentOS 7在SR650上的UEFI启动与自定义分区(含/dev/sdX查找技巧) 在服务器运维领域,系统安装看似基础却暗藏玄机。特别是当面对企业级硬件如Lenovo SR650时,UEFI启动模式与传统BIOS的…...

谷歌seo搜索引擎优化教程有吗?只需4步:快速提升关键词前10概率
搜索结果首页占据了超过 94% 的点击流量。如果你的网站排在第二页,那几乎等同于不存在。很多人在寻找 谷歌seo搜索引擎优化教程有吗?只需4步:快速提升关键词前10概率 的答案时,容易被复杂的技术词汇绕晕。提升排名的过程其实是关于…...

如何快速恢复加密压缩包密码:ArchivePasswordTestTool完整指南
如何快速恢复加密压缩包密码:ArchivePasswordTestTool完整指南 【免费下载链接】ArchivePasswordTestTool 利用7zip测试压缩包的功能 对加密压缩包进行自动化测试密码 项目地址: https://gitcode.com/gh_mirrors/ar/ArchivePasswordTestTool 你是否曾经遇到过…...