gem5学习(12):理解gem5 统计信息和输出——Understanding gem5 statistics and output
目录
一、config.ini
二、config.json
三、stats.txt
官方教程:gem5: Understanding gem5 statistics and output
在运行 gem5 之后,除了仿真脚本打印的仿真信息外,还会在根目录中名为 m5out 的目录中生成三个文件:
- config.ini:包含仿真过程中创建的每个 SimObject 及其参数值的列表。
- config.json:与 config.ini 相同,但以 JSON 格式存储。
- stats.txt:gem5 仿真期间注册的所有统计信息的文本表示。
这些文件存储在名为 m5out 的目录中。

一、config.ini
该文件是仿真过程中所模拟内容的确切版本。它显示了每个被仿真的 SimObject 的所有参数,无论这些参数是在配置脚本中设置的还是使用了默认值。
下面是从在运行 simple-config-chapter 中的 simple.py 配置文件时生成的 config.ini 文件中提取的内容。
该文件是仿真过程中所模拟内容的确切版本。它显示了每个被仿真的 SimObject 的所有参数,无论这些参数是在配置脚本中设置的还是使用了默认值。
以下是我自己的配置文件时生成的 config.ini 文件中提取的内容(只截取了部分)。
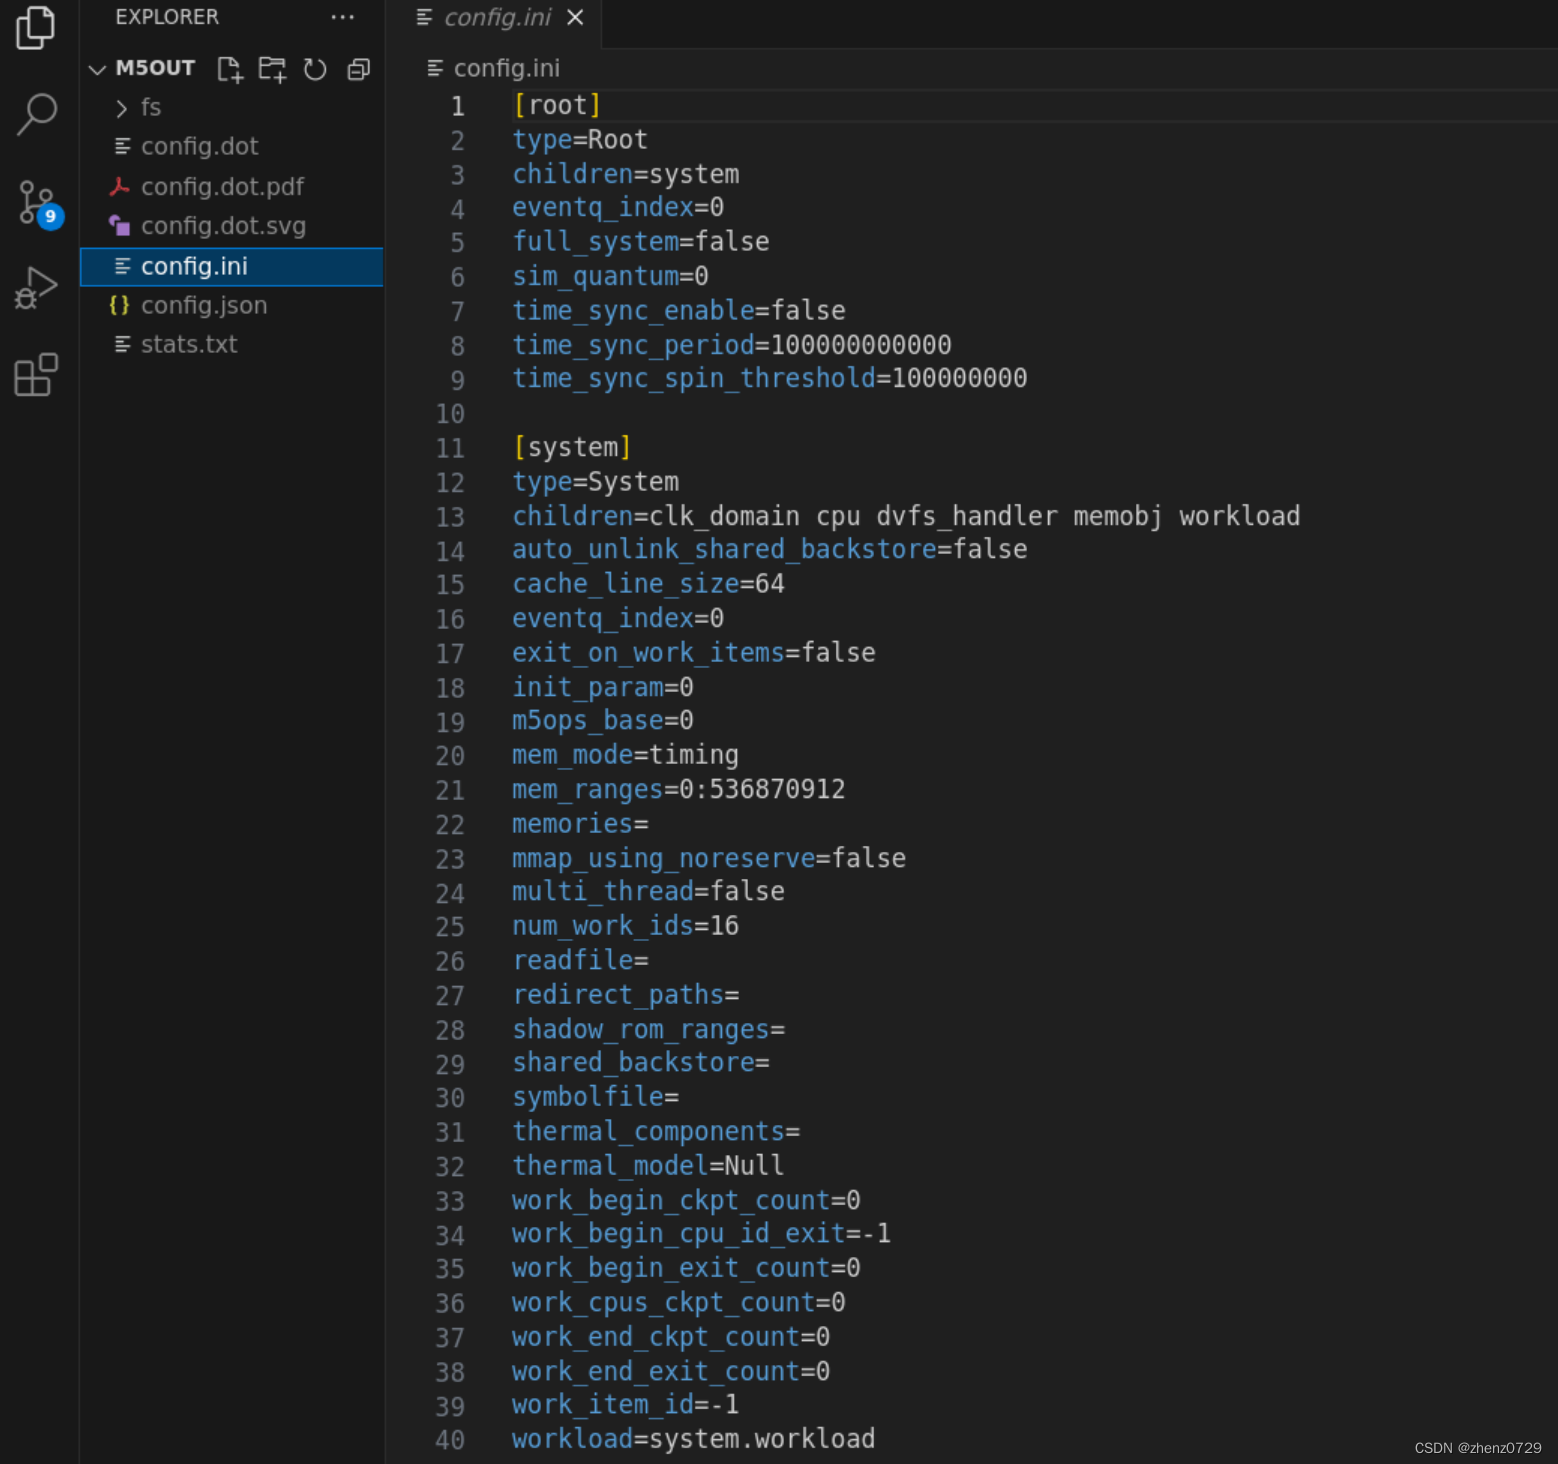
在每个 SimObject 的描述开头,首先是它在配置文件中创建时用方括号括起来的名称(例如[system])。
接下来,显示了每个 SimObject 的每个参数及其值(在截取的部分主要看system),包括在配置文件中未明确设置的参数。例如,配置文件将时钟域设置为 1 GHz(在此情况下为 1000 个时钟周期)。然而,它没有设置 cache line size(在系统中为 64)对象。
config.ini 文件类似于一个对照工具,用来确保仿真配置和预期相同。gem5有多重设置默认值和覆盖默认值的可能,所以对config.ini进行合理性检查,用来确保子啊配置文件中设置的参数传递到实际的类中。
二、config.json
与 config.ini 相同,但以 JSON 格式存储(不作过多说明)。
三、stats.txt
gem5拥有一个灵活的统计信息生成系统。gem5统计信息在Statistics - gem5上有详细介绍。每个SimObject的实例化都有自己的统计信息。在仿真结束时,或者当发出特殊的统计信息转储命令时,所有SimObject的当前统计信息状态将被转储到一个文件中。
首先,统计文件包含有关执行的一般统计信息:
(这里是我自己的配置文件,只起示范作用)
---------- Begin Simulation Statistics ----------
simSeconds                                   0.000057                       # Number of seconds simulated (Second)
simTicks                                     57467000                       # Number of ticks simulated (Tick)
finalTick                                    57467000                       # Number of ticks from beginning of simulation (restored from checkpoints and never reset) (Tick)
simFreq                                  1000000000000                       # The number of ticks per simulated second ((Tick/Second))
hostSeconds                                      0.03                       # Real time elapsed on the host (Second)
hostTickRate                               2295882330                       # The number of ticks simulated per host second (ticks/s) ((Tick/Second))
hostMemory                                     665792                       # Number of bytes of host memory used (Byte)
simInsts                                         6225                       # Number of instructions simulated (Count)
simOps                                          11204                       # Number of ops (including micro ops) simulated (Count)
hostInstRate                                   247382                       # Simulator instruction rate (inst/s) ((Count/Second))
hostOpRate                                     445086                       # Simulator op (including micro ops) rate (op/s) ((Count/Second))---------- Begin Simulation Statistics ----------
simSeconds                                   0.000490                       # Number of seconds simulated (Second)
simTicks                                    490394000                       # Number of ticks simulated (Tick)
finalTick                                   490394000                       # Number of ticks from beginning of simulation (restored from checkpoints and never reset) (Tick)
simFreq                                  1000000000000                       # The number of ticks per simulated second ((Tick/Second))
hostSeconds                                      0.03                       # Real time elapsed on the host (Second)
hostTickRate                              15979964060                       # The number of ticks simulated per host second (ticks/s) ((Tick/Second))
hostMemory                                     657488                       # Number of bytes of host memory used (Byte)
simInsts                                         6225                       # Number of instructions simulated (Count)
simOps                                          11204                       # Number of ops (including micro ops) simulated (Count)
hostInstRate                                   202054                       # Simulator instruction rate (inst/s) ((Count/Second))
hostOpRate                                     363571                       # Simulator op (including micro ops) rate (op/s) ((Count/Second))
统计信息开始于 "---------- Begin Simulation Statistics ----------"。如果在gem5执行期间进行了多次统计信息转储,则在单个文件中会有多个此类转储。常见于运行时间较长的应用程序或从检查点恢复时。
每个统计信息具有名称(第一列)、值(第二列)和描述(前面带有#的最后一列),后面是统计信息的单位。
大多数统计信息从其描述中很容易理解。其中几个重要的统计信息包括 sim_seconds,它是仿真的总时间;sim_insts,它是CPU提交的指令数量;host_inst_rate,它告诉您gem5的性能。
接下来,将打印SimObjects的统计信息。例如,CPU统计信息包含有关系统调用数量、缓存系统和翻译缓冲区等的信息。
system.clk_domain.clock                          1000                       # Clock period in ticks (Tick)
system.clk_domain.voltage_domain.voltage            1                       # Voltage in Volts (Volt)
system.cpu.numCycles                            57467                       # Number of cpu cycles simulated (Cycle)
system.cpu.numWorkItemsStarted                      0                       # Number of work items this cpu started (Count)
system.cpu.numWorkItemsCompleted                    0                       # Number of work items this cpu completed (Count)
system.cpu.dcache.demandHits::cpu.data           1941                       # number of demand (read+write) hits (Count)
system.cpu.dcache.demandHits::total              1941                       # number of demand (read+write) hits (Count)
system.cpu.dcache.overallHits::cpu.data          1941                       # number of overall hits (Count)
system.cpu.dcache.overallHits::total             1941                       # number of overall hits (Count)
system.cpu.dcache.demandMisses::cpu.data          133                       # number of demand (read+write) misses (Count)
system.cpu.dcache.demandMisses::total             133                       # number of demand (read+write) misses (Count)
system.cpu.dcache.overallMisses::cpu.data          133                       # number of overall misses (Count)
system.cpu.dcache.overallMisses::total            133                       # number of overall misses (Count)
system.cpu.dcache.demandMissLatency::cpu.data     14301000                       # number of demand (read+write) miss ticks (Tick)
system.cpu.dcache.demandMissLatency::total     14301000                       # number of demand (read+write) miss ticks (Tick)
system.cpu.dcache.overallMissLatency::cpu.data     14301000                       # number of overall miss ticks (Tick)
system.cpu.dcache.overallMissLatency::total     14301000                       # number of overall miss ticks (Tick)
system.cpu.dcache.demandAccesses::cpu.data         2074                       # number of demand (read+write) accesses (Count)
system.cpu.dcache.demandAccesses::total          2074                       # number of demand (read+write) accesses (Count)
system.cpu.dcache.overallAccesses::cpu.data         2074                       # number of overall (read+write) accesses (Count)
system.cpu.dcache.overallAccesses::total         2074                       # number of overall (read+write) accesses (Count)
system.cpu.dcache.demandMissRate::cpu.data     0.064127                       # miss rate for demand accesses (Ratio)
system.cpu.dcache.demandMissRate::total      0.064127                       # miss rate for demand accesses (Ratio)
system.cpu.dcache.overallMissRate::cpu.data     0.064127                       # miss rate for overall accesses (Ratio)
system.cpu.dcache.overallMissRate::total     0.064127                       # miss rate for overall accesses (Ratio)
system.cpu.dcache.demandAvgMissLatency::cpu.data 107526.315789                       # average overall miss latency ((Cycle/Count))
system.cpu.dcache.demandAvgMissLatency::total 107526.315789                       # average overall miss latency ((Cycle/Count))
system.cpu.dcache.overallAvgMissLatency::cpu.data 107526.315789                       # average overall miss latency ((Cycle/Count))
system.cpu.dcache.overallAvgMissLatency::total 107526.315789                       # average overall miss latency ((Cycle/Count))
...
system.cpu.mmu.dtb.rdAccesses                    1123                       # TLB accesses on read requests (Count)
system.cpu.mmu.dtb.wrAccesses                     953                       # TLB accesses on write requests (Count)
system.cpu.mmu.dtb.rdMisses                        11                       # TLB misses on read requests (Count)
system.cpu.mmu.dtb.wrMisses                         9                       # TLB misses on write requests (Count)
system.cpu.mmu.dtb.walker.power_state.pwrStateResidencyTicks::UNDEFINED     57467000                       # Cumulative time (in ticks) in various power states (Tick)
system.cpu.mmu.itb.rdAccesses                       0                       # TLB accesses on read requests (Count)
system.cpu.mmu.itb.wrAccesses                    7940                       # TLB accesses on write requests (Count)
system.cpu.mmu.itb.rdMisses                         0                       # TLB misses on read requests (Count)
system.cpu.mmu.itb.wrMisses                        37                       # TLB misses on write requests (Count)
system.cpu.mmu.itb.walker.power_state.pwrStateResidencyTicks::UNDEFINED     57467000                       # Cumulative time (in ticks) in various power states (Tick)
system.cpu.power_state.pwrStateResidencyTicks::ON     57467000                       # Cumulative time (in ticks) in various power states (Tick)
system.cpu.thread_0.numInsts                        0                       # Number of Instructions committed (Count)
system.cpu.thread_0.numOps                          0                       # Number of Ops committed (Count)
system.cpu.thread_0.numMemRefs                      0                       # Number of Memory References (Count)
system.cpu.workload.numSyscalls                    11                       # Number of system calls (Count)
文件中稍后出现的是内存控制器的统计信息。其中包含每个组件读取的字节数以及这些组件使用的平均带宽等信息。
system.mem_ctrl.bytesReadWrQ                        0                       # Total number of bytes read from write queue (Byte)
system.mem_ctrl.bytesReadSys                    23168                       # Total read bytes from the system interface side (Byte)
system.mem_ctrl.bytesWrittenSys                     0                       # Total written bytes from the system interface side (Byte)
system.mem_ctrl.avgRdBWSys               403153113.96105593                       # Average system read bandwidth in Byte/s ((Byte/Second))
system.mem_ctrl.avgWrBWSys                 0.00000000                       # Average system write bandwidth in Byte/s ((Byte/Second))
system.mem_ctrl.totGap                       57336000                       # Total gap between requests (Tick)
system.mem_ctrl.avgGap                      158386.74                       # Average gap between requests ((Tick/Count))
system.mem_ctrl.requestorReadBytes::cpu.inst        14656                       # Per-requestor bytes read from memory (Byte)
system.mem_ctrl.requestorReadBytes::cpu.data         8512                       # Per-requestor bytes read from memory (Byte)
system.mem_ctrl.requestorReadRate::cpu.inst 255033323.472601681948                       # Per-requestor bytes read from memory rate ((Byte/Second))
system.mem_ctrl.requestorReadRate::cpu.data 148119790.488454252481                       # Per-requestor bytes read from memory rate ((Byte/Second))
system.mem_ctrl.requestorReadAccesses::cpu.inst          229                       # Per-requestor read serviced memory accesses (Count)
system.mem_ctrl.requestorReadAccesses::cpu.data          133                       # Per-requestor read serviced memory accesses (Count)
system.mem_ctrl.requestorReadTotalLat::cpu.inst      6234000                       # Per-requestor read total memory access latency (Tick)
system.mem_ctrl.requestorReadTotalLat::cpu.data      4141000                       # Per-requestor read total memory access latency (Tick)
system.mem_ctrl.requestorReadAvgLat::cpu.inst     27222.71                       # Per-requestor read average memory access latency ((Tick/Count))
system.mem_ctrl.requestorReadAvgLat::cpu.data     31135.34                       # Per-requestor read average memory access latency ((Tick/Count))
system.mem_ctrl.dram.bytesRead::cpu.inst        14656                       # Number of bytes read from this memory (Byte)
system.mem_ctrl.dram.bytesRead::cpu.data         8512                       # Number of bytes read from this memory (Byte)
system.mem_ctrl.dram.bytesRead::total           23168                       # Number of bytes read from this memory (Byte)
system.mem_ctrl.dram.bytesInstRead::cpu.inst        14656                       # Number of instructions bytes read from this memory (Byte)
system.mem_ctrl.dram.bytesInstRead::total        14656                       # Number of instructions bytes read from this memory (Byte)
system.mem_ctrl.dram.numReads::cpu.inst           229                       # Number of read requests responded to by this memory (Count)
system.mem_ctrl.dram.numReads::cpu.data           133                       # Number of read requests responded to by this memory (Count)
system.mem_ctrl.dram.numReads::total              362                       # Number of read requests responded to by this memory (Count)
system.mem_ctrl.dram.bwRead::cpu.inst       255033323                       # Total read bandwidth from this memory ((Byte/Second))
system.mem_ctrl.dram.bwRead::cpu.data       148119790                       # Total read bandwidth from this memory ((Byte/Second))
system.mem_ctrl.dram.bwRead::total          403153114                       # Total read bandwidth from this memory ((Byte/Second))
system.mem_ctrl.dram.bwInstRead::cpu.inst    255033323                       # Instruction read bandwidth from this memory ((Byte/Second))
system.mem_ctrl.dram.bwInstRead::total      255033323                       # Instruction read bandwidth from this memory ((Byte/Second))
system.mem_ctrl.dram.bwTotal::cpu.inst      255033323                       # Total bandwidth to/from this memory ((Byte/Second))
system.mem_ctrl.dram.bwTotal::cpu.data      148119790                       # Total bandwidth to/from this memory ((Byte/Second))
system.mem_ctrl.dram.bwTotal::total         403153114                       # Total bandwidth to/from this memory ((Byte/Second))
system.mem_ctrl.dram.readBursts                   362                       # Number of DRAM read bursts (Count)
system.mem_ctrl.dram.writeBursts                    0                       # Number of DRAM write bursts (Count)
今天心情比较好,更两篇~
相关文章:
gem5学习(12):理解gem5 统计信息和输出——Understanding gem5 statistics and output
目录 一、config.ini 二、config.json 三、stats.txt 官方教程:gem5: Understanding gem5 statistics and output 在运行 gem5 之后,除了仿真脚本打印的仿真信息外,还会在根目录中名为 m5out 的目录中生成三个文件: config.i…...

索引的概述和使用
1、概述 索引占用存储空间,并不是越多越好,太多的索引会影响系统性能 索引分类 聚集索引: 逻辑顺序和物理顺序是一致的(表中行数的位置决定了该行在内存中存储的位置),因此效率优先于非聚集索引ÿ…...

力扣210. 课程表 II
深度优先遍历 思路: 搜索逻辑参见力扣207.课程表需要课程安排的顺序,课程搜索完成时,将其存储起来即可;存储课程的顺序需要注意: 输入依赖中 [A, B]图中表示 B -> A ,表示先 B 后 A&#x…...
[Docker] Mac M1系列芯片上完美运行Docker
docker pull qinchz/dm8-arm64 container_name: dm8ports:- "5236:5236"mem_limit: 1gmemswap_limit: 1gvolumes:- /data/dm8:/home/dmdba/data 数据库实例参数已修改,接近oracle使用习惯 #字符集 utf-8 CHARSET1 #VARCHAR 类型对象的长度以字符为单位 …...

CompletableFuture、ListenableFuture高级用列
CompletableFuture 链式 public static void main(String[] args) throws Exception {CompletableFuture<Integer> thenCompose T1().thenCompose(Compress::T2).thenCompose(Compress::T3);Integer result thenCompose.get();System.out.println(result);}// 假设这些…...

什么是云服务器,阿里云优势如何?
阿里云服务器ECS英文全程Elastic Compute Service,云服务器ECS是一种安全可靠、弹性可伸缩的云计算服务,阿里云提供多种云服务器ECS实例规格,如经济型e实例、通用算力型u1、ECS计算型c7、通用型g7、GPU实例等,阿里云百科aliyunbai…...
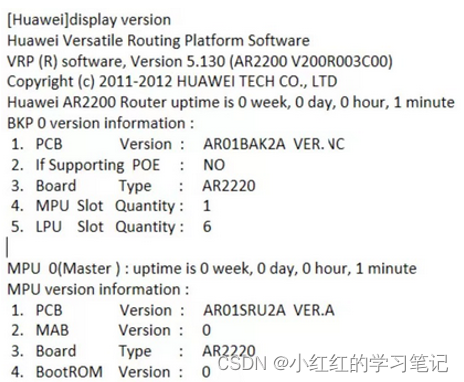
HCIA-Datacom题库(自己整理分类的)_15_VRP平台多选【9道题】
1.VRP操作平台存在哪些命令行视图? 用户视图 接口视图 协议视图 系统视图 2.以下哪些存储介质是华为路由器常用的存储介质 SDRAM NVRAM Flash Hard Disk SD Card 解析:Hard Disk是硬盘,一般网络设备没有。 3.VRP支持通过哪几种方式对路由器…...
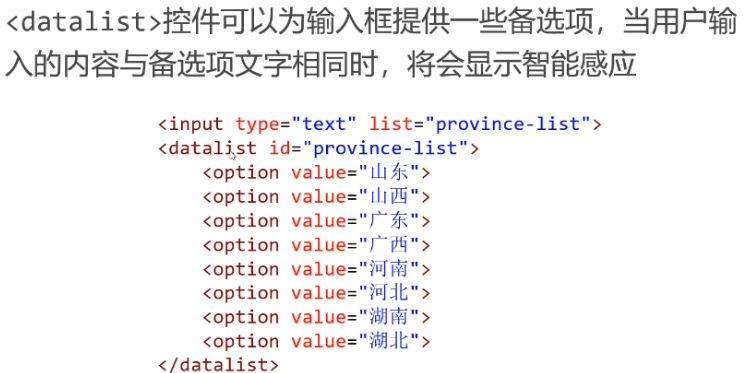
html5基础入门
html5基础语法与标签 前言前端开发零基础入门介绍前端开发行业介绍:大前端时代:前端开发主要技术介绍学习方法IDE简介vscode快捷键: 总结 HTML语法与基础标签互联网基本原理HTTP协议(请求、响应)什么是前端、后端&…...
JVM工作原理与实战(十五):运行时数据区-程序计数器
专栏导航 JVM工作原理与实战 RabbitMQ入门指南 从零开始了解大数据 目录 专栏导航 前言 一、运行时数据区 二、程序计数器 总结 前言 JVM作为Java程序的运行环境,其负责解释和执行字节码,管理内存,确保安全,支持多线程和提供…...
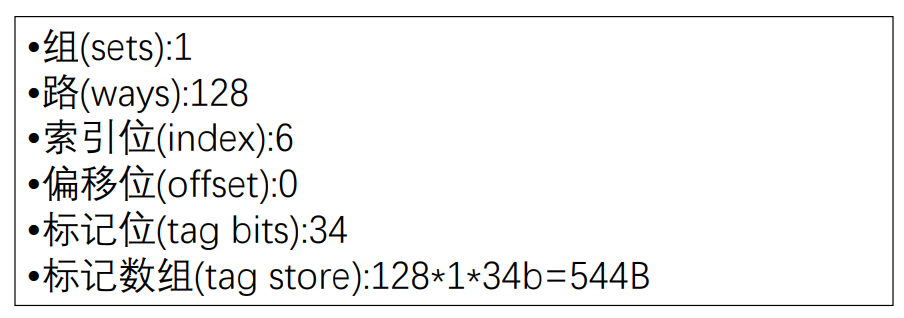
计算机体系结构----存储系统
本文严禁转载,仅供学习使用。参考资料来自中国科学院大学计算机体系结构课程PPT以及《Digital Design and Computer Architecture》、《超标量处理器设计》、同济大学张晨曦教授资料。如有侵权,联系本人修改。 1.1 引言 1.1.1虚拟和物理内存 程序员看到…...
)
华为OD机试2024年最新题库(Python)
我是一名软件开发培训机构老师,我的学生已经有上百人通过了华为OD机试,学生们每次考完试,会把题目拿出来一起交流分享。 重要:2024年1月-5月,考的都是OD统一考试(C卷),题库已经整理…...

【打卡】牛客网:BM84 最长公共前缀
自己写的: 题目要求时间复杂度是o(n*len),说明可以遍历所有的字符。 空间复杂度o(1),说明不能用字符串存储公共前缀,所以用下标来记录。 调试过程: 大概花了20min。 我调试前的做法是,在while循环中&…...
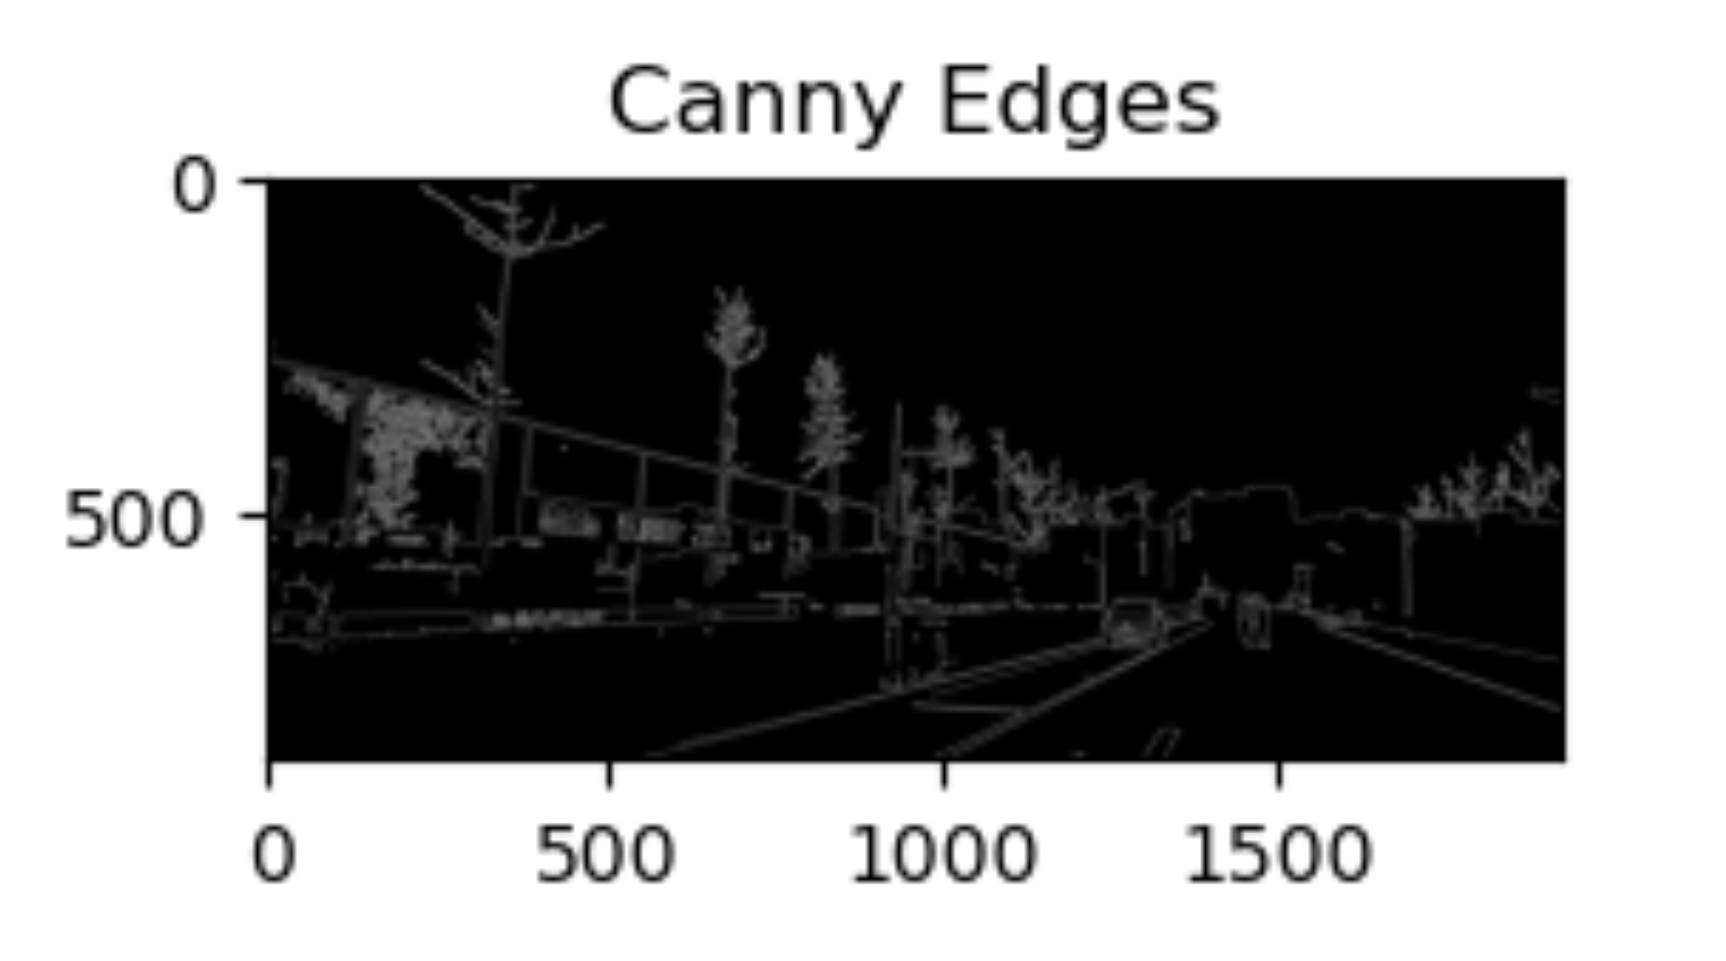
我在Vscode学OpenCV 图像处理三(图像梯度--边缘检测【图像梯度、Sobel 算子、 Scharr 算子、 Laplacian 算子、Canny 边缘检测】)
文章目录 一、图像梯度1.1 介绍1.2 涉及函数 二、高频强调滤波器2.1 Sobel 算子2.1.1 Sobel 理论基础2.1.2 Sobel 算子及函数使用(1)对参数取绝对值(2)控制dx,dy方向的求导阶数1. **计算 x 方向边缘(梯度&a…...
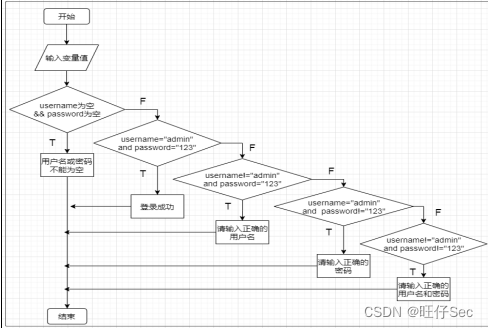
2023年全国职业院校技能大赛软件测试赛题—单元测试卷⑤
单元测试 一、任务要求 题目1:根据下列流程图编写程序实现相应处理,执行j10*x-y返回文字“j1:”和计算值,执行j(x-y)*(10⁵%7)返回文字“j2:”和计算值,执行jy*log(x10)返回文字“j3:”和计算值…...
seata分布式事务(与dubbo集成)
1.seata是什么? Seata 是一款开源的分布式事务解决方案,致力于在微服务架构下提供高性能和简单易用的分布式事务服务。 2.seata的注解 GlobalTransactional:全局事务注解,添加了以后可实现分布式事务的回滚和提交,用法与spring…...

Leetcod面试经典150题刷题记录 —— 数学篇
Leetcode面试经典150题刷题记录-系列Leetcod面试经典150题刷题记录——数组 / 字符串篇Leetcod面试经典150题刷题记录 —— 双指针篇Leetcod面试经典150题刷题记录 —— 矩阵篇Leetcod面试经典150题刷题记录 —— 滑动窗口篇Leetcod面试经典150题刷题记录 —— 哈希表篇Leetcod…...

x-cmd pkg | csview - 美观且高性能的 csv 数据查看工具
目录 介绍首次用户功能特点类似工具与竞品进一步阅读 介绍 csview 是一个用于在命令行中查看 CSV 文件的工具,采用 Rust 语言编写的,支持中日韩/表情符号。它允许用户在终端中以表格形式查看 CSV 数据,可以对数据进行排序、过滤、搜索等操作…...
前端八股文(性能优化篇)
目录 1.CDN的概念 2.CDN的作用 3.CDN的原理 4.CDN的使用场景 5.懒加载的概念 6.懒加载的特点 7.懒加载的实现原理 8.懒加载与预加载的区别 9.回流与重绘的概念及触发条件 (1)回流 (2)重绘 10. 如何避免回流与重绘&#…...
.Net Core项目在linux部署实战 1.sdk下载 2.环境变量配置/ect/profile 3.运行
1)下载.net core sdk https://download.visualstudio.microsoft.com/download/pr/01292c7c-a1ec-4957-90fc-3f6a2a1e5edc/025e84c4d9bd4aeb003d4f07b42e9159/dotnet-sdk-6.0.418-linux-x64.tar.gz 2)配置下环境变量 step1: // 解压到指定目录 mkdir -p $HOME/dotnet &…...

Python 基于Open3D的点云均匀下采样算法
目录 一、算法概述二、代码示例三、测试示例一、算法概述 点云均匀下采样算法:是在保持点云关键特征的前提下,减少点云数据的数量。 算法流程: 首先使用o3d.io.read_point_cloud函数读取点云数据。然后,使用uniform_down_sample函数进行均匀下采样,将点云数据按照指定的采…...
)
从STM32转战华大HC32F4A0:手把手教你搞定TIM6的PWM输入捕获(附中断配置避坑点)
从STM32到HC32F4A0的PWM输入捕获实战:TIM6配置与中断避坑指南 对于习惯了STM32生态的嵌入式开发者来说,初次接触华大半导体的HC32F4A0系列MCU时,往往会遇到一些意料之外的挑战。PWM输入捕获作为电机控制、频率测量等应用中的核心功能…...

UE4 TCP通信实战:从网络调试助手到Python服务端的跨平台数据交互
1. UE4 TCP通信基础与环境搭建 第一次在UE4里折腾TCP通信的时候,我对着文档研究了整整两天。后来发现其实用对方法,半小时就能跑通第一个Demo。这里分享我最常用的TCPSocketPlugin插件方案,比原生C实现简单十倍。 先到虚幻商城搜索"TCP …...

QMCDecode终极指南:一键解锁QQ音乐加密音频的完整解决方案
QMCDecode终极指南:一键解锁QQ音乐加密音频的完整解决方案 【免费下载链接】QMCDecode QQ音乐QMC格式转换为普通格式(qmcflac转flac,qmc0,qmc3转mp3, mflac,mflac0等转flac),仅支持macOS,可自动识别到QQ音乐下载目录,默…...

模块化AI智能体框架:从原理到实践,打造高效开发副驾驶
1. 项目概述:一个为开发者设计的模块化AI智能体框架如果你和我一样,每天都在和代码打交道,同时也在探索如何让AI真正成为你的“副驾驶”,而不是一个只会闲聊的玩具,那你肯定对如何高效地使用Cursor、Claude或者GPT来辅…...
:92%开发者踩过的5类语音延迟/断连/语义失准陷阱)
ElevenLabs IVR语音制作避坑手册(2024最新版):92%开发者踩过的5类语音延迟/断连/语义失准陷阱
更多请点击: https://intelliparadigm.com 第一章:ElevenLabs IVR语音制作避坑手册导论 在构建高可用、高自然度的智能语音应答(IVR)系统时,ElevenLabs 以其超拟真语音合成能力成为热门选择。然而,其 API …...

惠普OMEN游戏本终极性能优化指南:OmenSuperHub深度解析与实战应用
惠普OMEN游戏本终极性能优化指南:OmenSuperHub深度解析与实战应用 【免费下载链接】OmenSuperHub 使用 WMI BIOS控制性能和风扇速度,自动解除DB功耗限制。 项目地址: https://gitcode.com/gh_mirrors/om/OmenSuperHub OmenSuperHub是一款专为惠普…...

2026年,想找A研发公司?这些关键选择要点你不可不知!
在科技飞速发展的2026年,AI技术已经广泛应用于各个领域,众多企业都希望借助AI研发公司的力量来提升自身竞争力。然而,面对市场上众多的AI研发公司,如何做出正确的选择成为了一大难题。下面就为大家介绍一些选择AI研发公司的关键要…...

Homepage:构建个人统一仪表盘,聚合数字服务与状态监控
1. 项目概述:为什么我们需要一个统一的“数字家园”仪表盘?如果你和我一样,每天的工作和生活被几十个网页应用、服务状态、待办事项和书签链接所淹没,那么你一定能理解那种在浏览器标签页海洋里“迷路”的烦躁感。今天要聊的这个项…...

手机资料恢复
在数字化生活高度渗透的今天,手机早已不仅是通讯工具,更是承载个人记忆、工作文档与社交关系的核心载体。一张重要的照片、一份未备份的合同、一段珍贵的聊天记录,一旦因误操作或意外损坏而丢失,带来的往往是情感上的失落与业务上…...

从社交推荐到金融风控:动态链路预测在工业界的5个落地场景详解
动态链路预测:从理论到商业价值的五大实战场景 社交平台上那些"可能认识的人"推荐,金融交易中突然拦截的欺诈提醒,电商首页精准推送的"猜你喜欢"——这些看似无关的场景背后,都藏着一个关键技术:动…...