十、Qt三维图表
一、Data Visualization模块概述
Data Visualization的三维显示功能主要有三种三维图形来实现,三各类的父类都是QAbstract3DGraph,从QWindow继承而来。这三类分别是:
- 三维柱状图Q3DBar
- 三维空间散点Q3DScatter
- 三维曲面Q3DSurface
1、相关类的继承关系
(1)图形类
QWindowQAbstract3DGraphQ3DBarQ3DScatterQ3DSurface
(2)数据序列类
QAbstract3DSeriesQBar3DSeriesQScatter3DSeriesQSurface3DSeries
(3)轴类
QAbstract3DAxisQCategory3DAxisQValue3DAxis
(4)数据代理类
数据代理类与序列对应,用于存储序列的数据的类。
QAbstractDataProxyQBarDataProxyQItemModelBarDataProxyQScatterDataProxyQItemModelScatterDataProxyQSurfaceDataProxyQHeightMapSurfaceDataProxyQItemModelSurfaceDataProxy
2、使用方法
(1)工程添加
QT += datavisualization
(2)代码中添加头文件与命名空间
#include <QtDataVisualization>
using namespace QtDataVisualization;
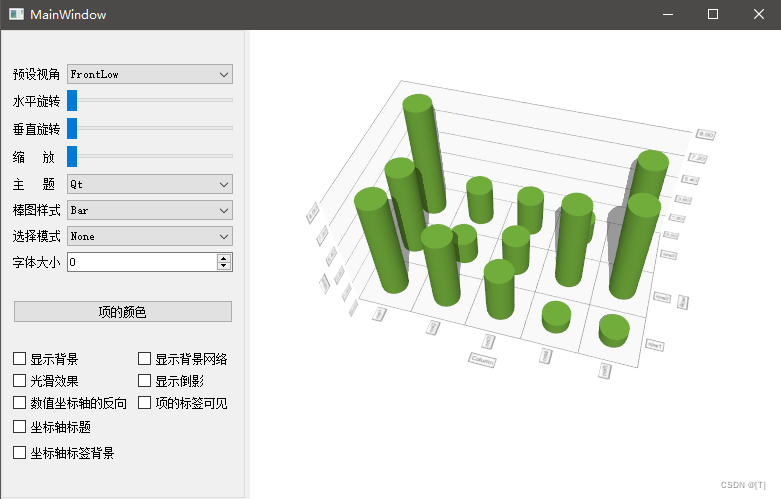
二、三维柱状图
1、实现程序
(1)创建项目,基于QMainWindow
(2)添加组件
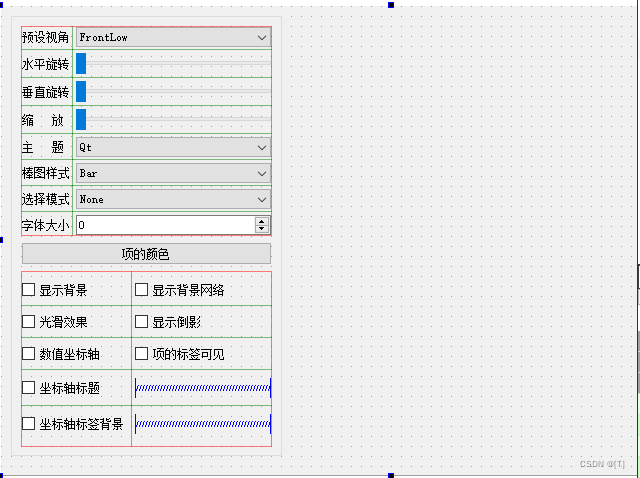
(3)初始化
MainWindow::MainWindow(QWidget *parent) :QMainWindow(parent),ui(new Ui::MainWindow)
{ui->setupUi(this);QSplitter *splitter = new QSplitter(Qt::Horizontal);splitter->addWidget(ui->groupBox);initGraph3D();splitter->addWidget(createWindowContainer(graph3D));setCentralWidget(splitter);
}MainWindow::~MainWindow()
{delete ui;
}void MainWindow::initGraph3D()
{graph3D = new Q3DBars;// 创建坐标系统QStringList rowLabs, colLabs;rowLabs << "row1" << "row2" << "row3";colLabs << "col1" << "col2" << "col3" << "col4" << "col5";QValue3DAxis *axisV = new QValue3DAxis;axisV->setTitle("Value");axisV->setTitleVisible(true);QCategory3DAxis * axisCol = new QCategory3DAxis;axisCol->setTitle("Column");axisCol->setTitleVisible(true);axisCol->setLabels(colLabs);QCategory3DAxis * axisRow = new QCategory3DAxis;axisRow->setTitle("Row");axisRow->setTitleVisible(true);axisRow->setLabels(rowLabs);graph3D->setValueAxis(axisV);graph3D->setColumnAxis(axisCol);graph3D->setRowAxis(axisRow);// 创建数据序列QBar3DSeries *series = new QBar3DSeries;series->setMesh(QAbstract3DSeries::MeshCylinder); // 形状series->setItemLabelFormat("(@rowLabel,@colLabel):%.1f");// 添加数据QBarDataArray *dataArray = new QBarDataArray;dataArray->reserve(rowLabs.count()); // 三行数据qsrand(QTime::currentTime().second());for (int i = 0; i < rowLabs.count(); ++i){QBarDataRow *dataRow = new QBarDataRow;for (int j = 0; j < 5; ++j){(*dataRow) << (qrand() % 10);}dataArray->append(dataRow);}series->dataProxy()->resetArray(dataArray);graph3D->addSeries(series);
}
(4)实现功能
void MainWindow::on_cboxCarmera_currentIndexChanged(int index)
{graph3D->scene()->activeCamera()->setCameraPreset(Q3DCamera::CameraPreset(index));
}void MainWindow::on_hSliderLevel_valueChanged(int value)
{Q_UNUSED(value);int xRot = ui->hSliderLevel->value();int yRot = ui->hSliderVertical->value();int zoom = ui->hSliderScale->value();graph3D->scene()->activeCamera()->setCameraPosition(xRot, yRot, zoom);
}void MainWindow::on_hSliderVertical_valueChanged(int value)
{Q_UNUSED(value);int xRot = ui->hSliderLevel->value();int yRot = ui->hSliderVertical->value();int zoom = ui->hSliderScale->value();graph3D->scene()->activeCamera()->setCameraPosition(xRot, yRot, zoom);
}void MainWindow::on_hSliderScale_valueChanged(int value)
{Q_UNUSED(value);int xRot = ui->hSliderLevel->value();int yRot = ui->hSliderVertical->value();int zoom = ui->hSliderScale->value();graph3D->scene()->activeCamera()->setCameraPosition(xRot, yRot, zoom);
}void MainWindow::on_cboxTheme_currentIndexChanged(int index)
{graph3D->activeTheme()->setType(Q3DTheme::Theme(index));
}void MainWindow::on_cboxStyle_currentIndexChanged(int index)
{QBar3DSeries *series = graph3D->seriesList().at(0);series->setMesh(QAbstract3DSeries::Mesh(index));
}void MainWindow::on_cboxMode_currentIndexChanged(int index)
{graph3D->setSelectionMode(QAbstract3DGraph::SelectionFlags(index));
}void MainWindow::on_spinBoxFontSize_valueChanged(int arg1)
{QFont font = graph3D->activeTheme()->font();font.setPointSize(arg1);graph3D->activeTheme()->setFont(font);
}#include <QColorDialog>
void MainWindow::on_btnItemColor_clicked()
{QBar3DSeries *series = graph3D->seriesList().at(0);QColor color = series->baseColor();color = QColorDialog::getColor(color);if(color.isValid()){series->setBaseColor(color);}
}void MainWindow::on_checkBoxBack_clicked(bool checked)
{graph3D->activeTheme()->setBackgroundEnabled(checked);
}void MainWindow::on_checkBoxBackNetwork_clicked(bool checked)
{graph3D->activeTheme()->setGridEnabled(checked);
}void MainWindow::on_checkBoxSmooth_clicked(bool checked)
{QBar3DSeries *series = graph3D->seriesList().at(0);series->setMeshSmooth(checked);
}void MainWindow::on_checkBoxReflection_clicked(bool checked)
{graph3D->setReflection(checked);
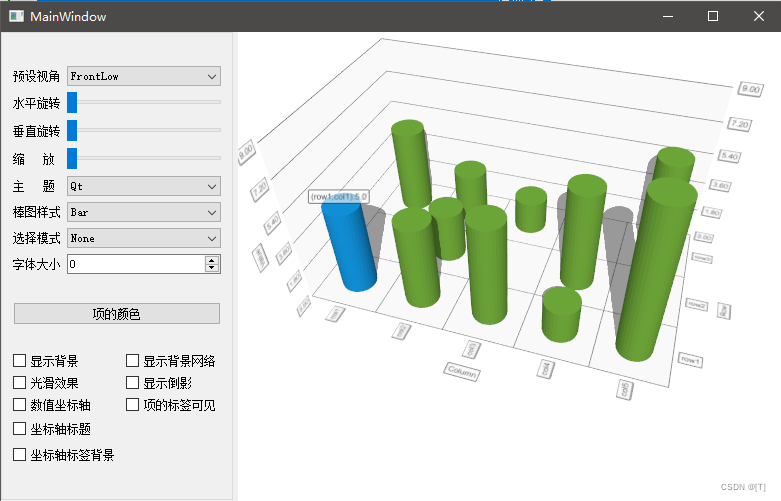
}void MainWindow::on_checkBoxValueAxis_clicked(bool checked)
{graph3D->valueAxis()->setReversed(checked);
}void MainWindow::on_checkBoxItemLabel_clicked(bool checked)
{QBar3DSeries *series = graph3D->seriesList().at(0);series->setItemLabelVisible(checked);
}void MainWindow::on_checkBoxAxisBack_clicked(bool checked)
{graph3D->valueAxis()->setTitleVisible(checked);graph3D->rowAxis()->setTitleVisible(checked);graph3D->columnAxis()->setTitleVisible(checked);
}void MainWindow::on_checkBoxAxisLabelBack_clicked(bool checked)
{graph3D->activeTheme()->setLabelBackgroundEnabled(checked);
}三、三维散点图
1、实现程序
(1)创建项目,基于QMainWindow
(2)实现功能
#include "mainwindow.h"
#include "ui_mainwindow.h"#include <QSplitter>MainWindow::MainWindow(QWidget *parent) :QMainWindow(parent),ui(new Ui::MainWindow)
{ui->setupUi(this);QSplitter *splitter = new QSplitter(Qt::Horizontal);splitter->addWidget(ui->groupBox);initGraph3D();splitter->addWidget(createWindowContainer(graph3D));setCentralWidget(splitter);
}MainWindow::~MainWindow()
{delete ui;
}void MainWindow::initGraph3D()
{graph3D = new Q3DScatter;// 创建坐标系统graph3D->axisX()->setTitle("X轴");graph3D->axisX()->setTitleVisible(true);graph3D->axisY()->setTitle("Y轴");graph3D->axisY()->setTitleVisible(true);graph3D->axisZ()->setTitle("Z轴");graph3D->axisZ()->setTitleVisible(true);// 创建数据序列QScatterDataProxy *porxy = new QScatterDataProxy;QScatter3DSeries *series = new QScatter3DSeries(porxy);//    series->setMesh(QAbstract3DSeries::MeshCylinder); // 形状series->setItemLabelFormat("(@rowLabel,@colLabel):%.1f");series->setItemSize(0.2);graph3D->addSeries(series);// 添加数据int N = 41;QScatterDataArray *dataArray = new QScatterDataArray;dataArray->resize(N * N);QScatterDataItem *item = &dataArray->first();// 摩西跟草帽算法float x, y, z;x = -10;for (int i = 0; i < N; ++i){y = -10;for (int j = 1; j <= N; ++j){z = qSqrt(x * x + y * y);if(z != 0){z = 10 * qSin(z) / z;}else{z = 10;}// 图形库的坐标系item->setPosition(QVector3D(x, z, y));item++;y += 0.5;}x += 0.5;}series->dataProxy()->resetArray(dataArray);
}void MainWindow::on_cboxCarmera_currentIndexChanged(int index)
{graph3D->scene()->activeCamera()->setCameraPreset(Q3DCamera::CameraPreset(index));
}void MainWindow::on_hSliderLevel_valueChanged(int value)
{Q_UNUSED(value);int xRot = ui->hSliderLevel->value();int yRot = ui->hSliderVertical->value();int zoom = ui->hSliderScale->value();graph3D->scene()->activeCamera()->setCameraPosition(xRot, yRot, zoom);
}void MainWindow::on_hSliderVertical_valueChanged(int value)
{Q_UNUSED(value);int xRot = ui->hSliderLevel->value();int yRot = ui->hSliderVertical->value();int zoom = ui->hSliderScale->value();graph3D->scene()->activeCamera()->setCameraPosition(xRot, yRot, zoom);
}void MainWindow::on_hSliderScale_valueChanged(int value)
{Q_UNUSED(value);int xRot = ui->hSliderLevel->value();int yRot = ui->hSliderVertical->value();int zoom = ui->hSliderScale->value();graph3D->scene()->activeCamera()->setCameraPosition(xRot, yRot, zoom);
}void MainWindow::on_cboxTheme_currentIndexChanged(int index)
{graph3D->activeTheme()->setType(Q3DTheme::Theme(index));
}void MainWindow::on_cboxStyle_currentIndexChanged(int index)
{QScatter3DSeries *series = graph3D->seriesList().at(0);series->setMesh(QAbstract3DSeries::Mesh(index));
}void MainWindow::on_cboxMode_currentIndexChanged(int index)
{graph3D->setSelectionMode(QAbstract3DGraph::SelectionFlags(index));
}void MainWindow::on_spinBoxFontSize_valueChanged(int arg1)
{QFont font = graph3D->activeTheme()->font();font.setPointSize(arg1);graph3D->activeTheme()->setFont(font);
}#include <QColorDialog>
void MainWindow::on_btnItemColor_clicked()
{QScatter3DSeries *series = graph3D->seriesList().at(0);QColor color = series->baseColor();color = QColorDialog::getColor(color);if(color.isValid()){series->setBaseColor(color);}
}void MainWindow::on_checkBoxBack_clicked(bool checked)
{graph3D->activeTheme()->setBackgroundEnabled(checked);
}void MainWindow::on_checkBoxBackNetwork_clicked(bool checked)
{graph3D->activeTheme()->setGridEnabled(checked);
}void MainWindow::on_checkBoxSmooth_clicked(bool checked)
{QScatter3DSeries *series = graph3D->seriesList().at(0);series->setMeshSmooth(checked);
}void MainWindow::on_checkBoxReflection_clicked(bool checked)
{graph3D->setReflection(checked);
}void MainWindow::on_checkBoxValueAxis_clicked(bool checked)
{graph3D->axisY()->setReversed(checked);
}void MainWindow::on_checkBoxItemLabel_clicked(bool checked)
{QScatter3DSeries *series = graph3D->seriesList().at(0);series->setItemLabelVisible(checked);
}void MainWindow::on_checkBoxAxisBack_clicked(bool checked)
{graph3D->axisY()->setTitleVisible(checked);graph3D->axisX()->setTitleVisible(checked);graph3D->axisZ()->setTitleVisible(checked);
}void MainWindow::on_checkBoxAxisLabelBack_clicked(bool checked)
{graph3D->activeTheme()->setLabelBackgroundEnabled(checked);
}
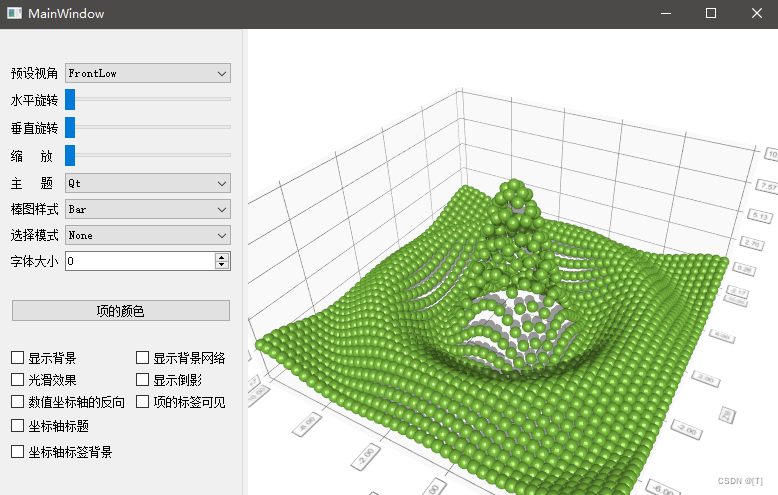
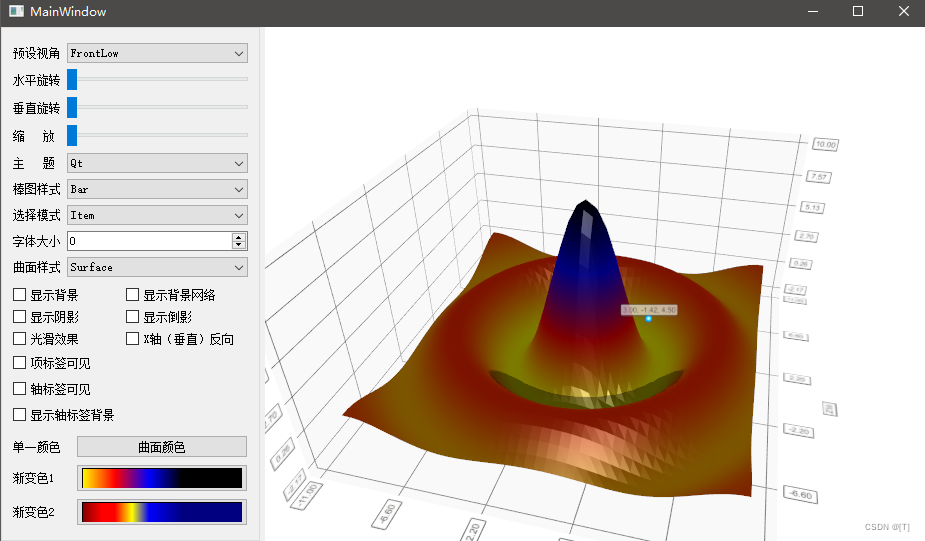
四、三维曲面图
1、实现程序
(1)创建项目,基于QMainWindow
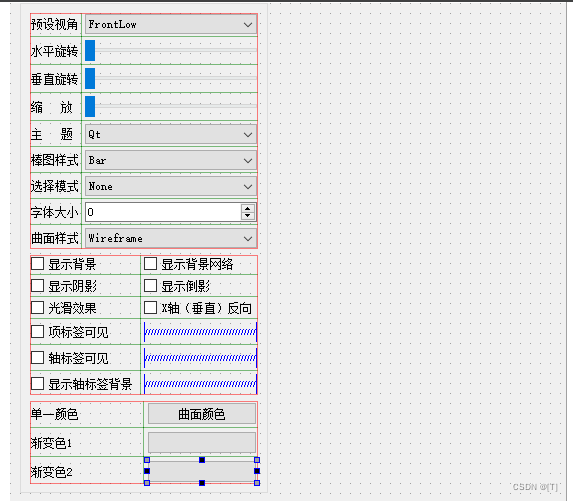
(2)添加组件
(3)初始化
MainWindow::MainWindow(QWidget *parent) :QMainWindow(parent),ui(new Ui::MainWindow)
{ui->setupUi(this);QSplitter *splitter = new QSplitter;splitter->addWidget(ui->groupBox);init3DGraph();splitter->addWidget(createWindowContainer(graph3D));setCentralWidget(splitter);// 设置按钮的渐变色QLinearGradient lgColor1(0, 0, 100, 0);lgColor1.setColorAt(1.0, Qt::black);lgColor1.setColorAt(0.67, Qt::blue);lgColor1.setColorAt(0.33, Qt::red);lgColor1.setColorAt(0, Qt::yellow);QPixmap mp(160, 20);QPainter painter(&mp);painter.setBrush(lgColor1);painter.drawRect(0, 0, 160, 20);ui->btnColors1->setIcon(QIcon(mp));ui->btnColors1->setIconSize(QSize(160, 20));lgColor1.setColorAt(1.0, Qt::darkBlue);lgColor1.setColorAt(0.5, Qt::yellow);lgColor1.setColorAt(0.2, Qt::red);lgColor1.setColorAt(0, Qt::darkRed);painter.setBrush(lgColor1);painter.drawRect(0, 0, 160, 20);ui->btnColors2->setIcon(QIcon(mp));ui->btnColors2->setIconSize(QSize(160, 20));
}MainWindow::~MainWindow()
{delete ui;
}void MainWindow::init3DGraph()
{graph3D = new Q3DSurface;graph3D->axisX()->setTitle("X轴");graph3D->axisX()->setTitleVisible(true);graph3D->axisX()->setRange(-11, 11);graph3D->axisY()->setTitle("Y轴");graph3D->axisY()->setTitleVisible(true);graph3D->axisZ()->setTitle("Z轴");graph3D->axisZ()->setTitleVisible(true);graph3D->axisZ()->setRange(-11, 11);QSurfaceDataProxy *proxy = new QSurfaceDataProxy;series = new QSurface3DSeries(proxy);series->setDrawMode(QSurface3DSeries::DrawSurface);series->setMeshSmooth(true); // 光滑曲面graph3D->addSeries(series);QSurfaceDataArray *dataArray = new QSurfaceDataArray;// 摩西跟草帽算法int N = 41;dataArray->reserve(N);float x, y, z;x = -10;for (int i = 0; i < N; ++i){QSurfaceDataRow *newRow = new QSurfaceDataRow(N);y = -10;int index = 0;for (int j = 1; j <= N; ++j){z = qSqrt(x * x + y * y);if(z != 0){z = 10 * qSin(z) / z;}else{z = 10;}// 图形库的坐标系(*newRow)[index++].setPosition(QVector3D(x, z, y));y += 0.5;}x += 0.5;*dataArray << newRow;}series->dataProxy()->resetArray(dataArray);}
(4)设置颜色
#include <QColorDialog>
void MainWindow::on_btnOneColor_clicked()
{QColor color = series->baseColor();color = QColorDialog::getColor(color);if(color.isValid()){series->setBaseColor(color);series->setColorStyle(Q3DTheme::ColorStyleUniform);}
}void MainWindow::on_btnColors1_clicked()
{QLinearGradient lgColor1(0, 0, 100, 0);lgColor1.setColorAt(1.0, Qt::black);lgColor1.setColorAt(0.67, Qt::blue);lgColor1.setColorAt(0.33, Qt::red);lgColor1.setColorAt(0, Qt::yellow);series->setBaseGradient(lgColor1);series->setColorStyle(Q3DTheme::ColorStyleRangeGradient); //设置渐变色
}void MainWindow::on_btnColors2_clicked()
{QLinearGradient lgColor1(0, 0, 100, 0);lgColor1.setColorAt(1.0, Qt::darkBlue);lgColor1.setColorAt(0.5, Qt::yellow);lgColor1.setColorAt(0.2, Qt::red);lgColor1.setColorAt(0, Qt::darkRed);series->setBaseGradient(lgColor1);series->setColorStyle(Q3DTheme::ColorStyleRangeGradient);
}
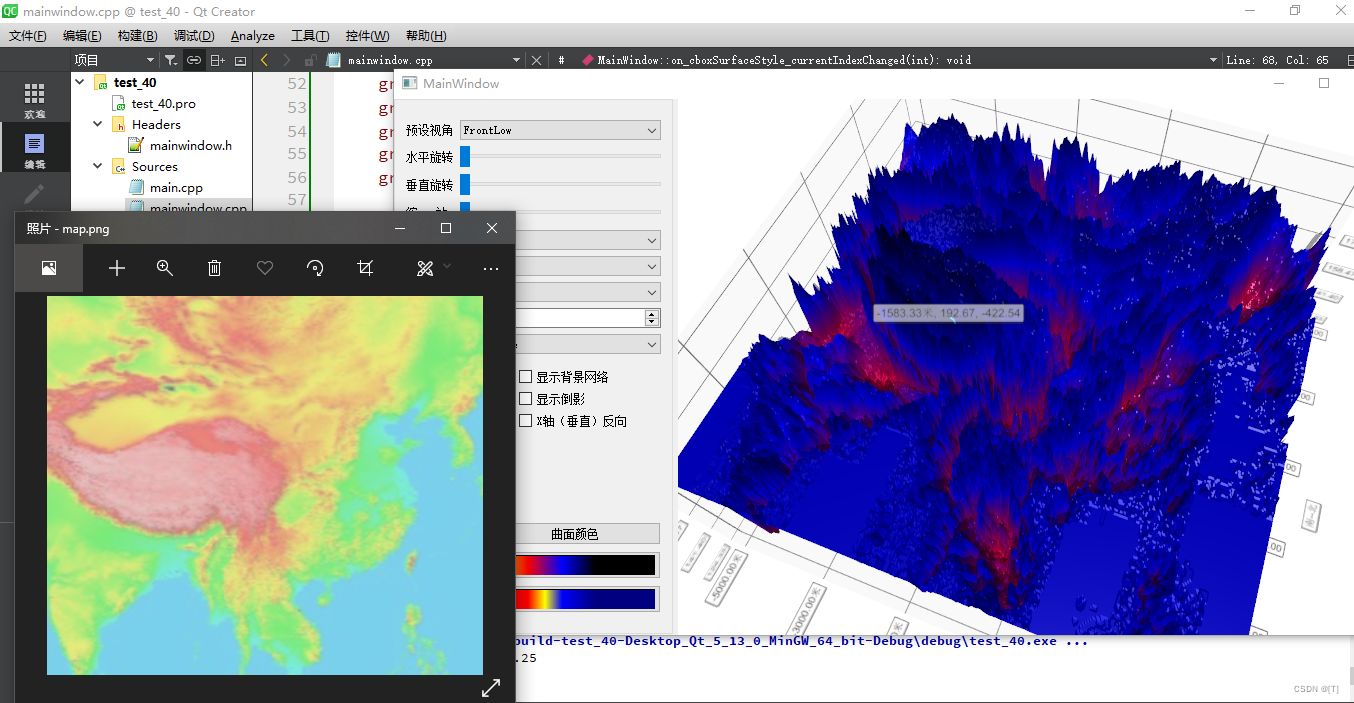
五、三维地形图
1、实现程序
(1)拷贝上一个项目
(2)添加图片资源文件
(3)实现功能
#include "mainwindow.h"
#include "ui_mainwindow.h"#include <QSplitter>MainWindow::MainWindow(QWidget *parent) :QMainWindow(parent),ui(new Ui::MainWindow)
{ui->setupUi(this);QSplitter *splitter = new QSplitter;splitter->addWidget(ui->groupBox);init3DGraph();splitter->addWidget(createWindowContainer(graph3D));setCentralWidget(splitter);// 设置按钮的渐变色QLinearGradient lgColor1(0, 0, 100, 0);lgColor1.setColorAt(1.0, Qt::black);lgColor1.setColorAt(0.67, Qt::blue);lgColor1.setColorAt(0.33, Qt::red);lgColor1.setColorAt(0, Qt::yellow);QPixmap mp(160, 20);QPainter painter(&mp);painter.setBrush(lgColor1);painter.drawRect(0, 0, 160, 20);ui->btnColors1->setIcon(QIcon(mp));ui->btnColors1->setIconSize(QSize(160, 20));lgColor1.setColorAt(1.0, Qt::darkBlue);lgColor1.setColorAt(0.5, Qt::yellow);lgColor1.setColorAt(0.2, Qt::red);lgColor1.setColorAt(0, Qt::darkRed);painter.setBrush(lgColor1);painter.drawRect(0, 0, 160, 20);ui->btnColors2->setIcon(QIcon(mp));ui->btnColors2->setIconSize(QSize(160, 20));
}MainWindow::~MainWindow()
{delete ui;
}void MainWindow::init3DGraph()
{graph3D = new Q3DSurface;graph3D->axisX()->setTitle("东--西");graph3D->axisX()->setTitleVisible(true);graph3D->axisX()->setLabelFormat("%.2f米");graph3D->axisZ()->setTitle("南--北");graph3D->axisZ()->setTitleVisible(true);graph3D->axisY()->setTitle("海拔");graph3D->axisY()->setTitleVisible(true);QImage mapImage(":/images/images/map.png");QHeightMapSurfaceDataProxy *proxy = new QHeightMapSurfaceDataProxy(mapImage);proxy->setValueRanges(-5000, 5000, -5000, 5000);series = new QSurface3DSeries(proxy);series->setDrawMode(QSurface3DSeries::DrawSurface);graph3D->addSeries(series);
}void MainWindow::on_cboxSurfaceStyle_currentIndexChanged(int index)
{series->setDrawMode(QSurface3DSeries::DrawFlags(index + 1));
}#include <QColorDialog>
void MainWindow::on_btnOneColor_clicked()
{QColor color = series->baseColor();color = QColorDialog::getColor(color);if(color.isValid()){series->setBaseColor(color);series->setColorStyle(Q3DTheme::ColorStyleUniform);}
}void MainWindow::on_btnColors1_clicked()
{QLinearGradient lgColor1(0, 0, 100, 0);lgColor1.setColorAt(1.0, Qt::black);lgColor1.setColorAt(0.67, Qt::blue);lgColor1.setColorAt(0.33, Qt::red);lgColor1.setColorAt(0, Qt::yellow);series->setBaseGradient(lgColor1);series->setColorStyle(Q3DTheme::ColorStyleRangeGradient); //设置渐变色
}void MainWindow::on_btnColors2_clicked()
{QLinearGradient lgColor1(0, 0, 100, 0);lgColor1.setColorAt(1.0, Qt::darkBlue);lgColor1.setColorAt(0.5, Qt::yellow);lgColor1.setColorAt(0.2, Qt::red);lgColor1.setColorAt(0, Qt::darkRed);series->setBaseGradient(lgColor1);series->setColorStyle(Q3DTheme::ColorStyleRangeGradient);
}void MainWindow::on_cboxMode_currentIndexChanged(int index)
{switch (index){case 0:graph3D->setSelectionMode(QAbstract3DGraph::SelectionNone);break;case 1:graph3D->setSelectionMode(QAbstract3DGraph::SelectionItem);break;case 2:graph3D->setSelectionMode(QAbstract3DGraph::SelectionRow |QAbstract3DGraph::SelectionSlice);break;case 3:graph3D->setSelectionMode(QAbstract3DGraph::SelectionColumn |QAbstract3DGraph::SelectionSlice);break;default:break;}
}
相关文章:
十、Qt三维图表
一、Data Visualization模块概述 Data Visualization的三维显示功能主要有三种三维图形来实现,三各类的父类都是QAbstract3DGraph,从QWindow继承而来。这三类分别是:三维柱状图Q3DBar三维空间散点Q3DScatter三维曲面Q3DSurface 1、相关类的…...

CMake官方教程中文翻译 Step 6: Adding Support for a Testing Dashboard
鉴于自己破烂的英语,所以把cmake的官方文档用 谷歌翻译 翻译下来方便查看。 英语好的同学建议直接去看cmake官方文档(英文)学习:地址 点这里 或复制:https://cmake.org/cmake/help/latest/guide/tutorial/index.html …...

【leetcode】完全背包总结
本文内容参考了代码随想录,并进行了自己的总结。 完全背包 关键点 ● 每件物品有若干种状态:不选、选 1 件、选 2 件、…、选 n 件 代码 在代码上,只有重量的遍历方向和 01 背包不一样: for(int i 0; i < nums.length; i…...
【Linux】理解系统中一个被打开的文件
文件系统 前言一、C语言文件接口二、系统文件接口三、文件描述符四、struct file 对象五、stdin、stdout、stderr六、文件描述符的分配规则七、重定向1. 重定向的原理2. dup23. 重谈 stderr 八、缓冲区1. 缓冲区基础2. 深入理解缓冲区3. 用户缓冲区和内核缓冲区4. FILE 前言 首…...
k8s kubeadm部署安装详解
目录 kubeadm部署流程简述 环境准备 步骤简述 关闭 防火墙规则、selinux、swap交换 修改主机名 配置节点之间的主机名解析 调整内核参数 所有节点安装docker 安装依赖组件 配置Docker 所有节点安装kubeadm,kubelet和kubectl 定义kubernetes源并指定版本…...

RT-DETR算法优化改进: 下采样系列 | 一种新颖的基于 Haar 小波的下采样HWD,有效涨点系列
💡💡💡本文独家改进:HWD的核心思想是应用Haar小波变换来降低特征图的空间分辨率,同时保留尽可能多的信息,与传统的下采样方法相比,有效降低信息不确定性。 💡💡💡使用方法:代替原始网络的conv,下采样过程中尽可能包括更多信息,从而提升检测精度。 RT-DET…...

CocosCreator3.8源码分析
Cocos Creator架构 Cocos Creator 拥有两套引擎内核,C 内核 和 TypeScript 内核。C 内核用于原生平台,TypeScript 内核用于 Web 和小游戏平台。 在引擎内核之上,是用 TypeScript 编写的引擎框架层,用以统一两套内核的差异…...
(已解决)spingboot 后端发送QQ邮箱验证码
打开QQ邮箱pop3请求服务:(按照QQ邮箱引导操作) 导入依赖(不是maven项目就自己添加jar包): <!-- 邮件发送--><dependency><groupId>org.springframework.boot</groupId><…...

【蓝桥杯冲冲冲】[NOIP2001 普及组] 装箱问题
蓝桥杯备赛 | 洛谷做题打卡day26 文章目录 蓝桥杯备赛 | 洛谷做题打卡day26题目描述输入格式输出格式样例 #1样例输入 #1样例输出 #1 提示思路 题解代码我的一些话 [NOIP2001 普及组] 装箱问题 题目描述 有一个箱子容量为 V V V,同时有 n n n 个物品,每…...

2024牛客寒假算法基础集训营1
文章目录 A DFS搜索M牛客老粉才知道的秘密G why外卖E 本题又主要考察了贪心B 关鸡C 按闹分配 今天的牛客,说是都是基础题,头昏昏的,感觉真不会写,只能赛后补题了 A DFS搜索 写的时候刚开始以为还是比较难的,和dfs有关…...
元素的显示与隐藏,精灵图,字体图标,CSSC三角
元素的显示与隐藏 类似网站广告,当我们点击关闭就不见了,但是我们重新刷新页面,会重新出现 本质:让元素在页面中隐藏或者显示出来。 1.display显示隐藏 2.visibility显示隐藏 3.overflow溢出显示隐藏 1.display属性(…...
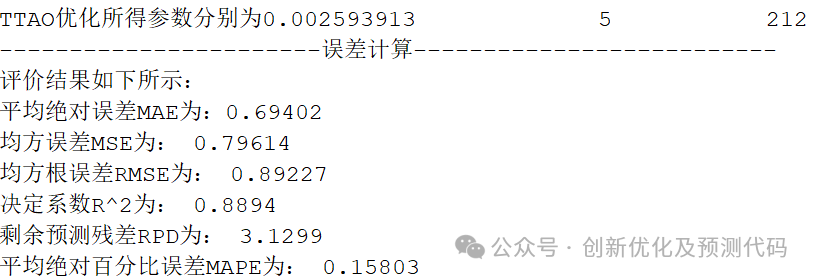
最新!2024顶级SCI优化!TTAO-CNN-BiGRU-MSA三角拓扑聚合优化、双向GRU融合注意力的多变量回归预测程序!
适用平台:Matlab 2023版及以上 TTOA三角聚合优化算法,将在2024年3月正式发表在中科院1区顶级SCI期刊《Expert Systems with Applications》上。 该算法提出时间极短,目前以及近期内不会有套用这个算法的文献。新年伊始,尽快拿下…...
)
Flink SQL Client 安装各类 Connector、组件的方法汇总(持续更新中....)
一般来说,在 Flink SQL Client 中使用各种 Connector 只需要该 Connector 及其依赖 Jar 包部署到 ${FLINK_HOME}/lib 下即可。但是对于某些特定的平台,如果 AWS EMR、Cloudera CDP 等产品会有所不同,主要是它们中的某些 Jar 包可能被改写过&a…...
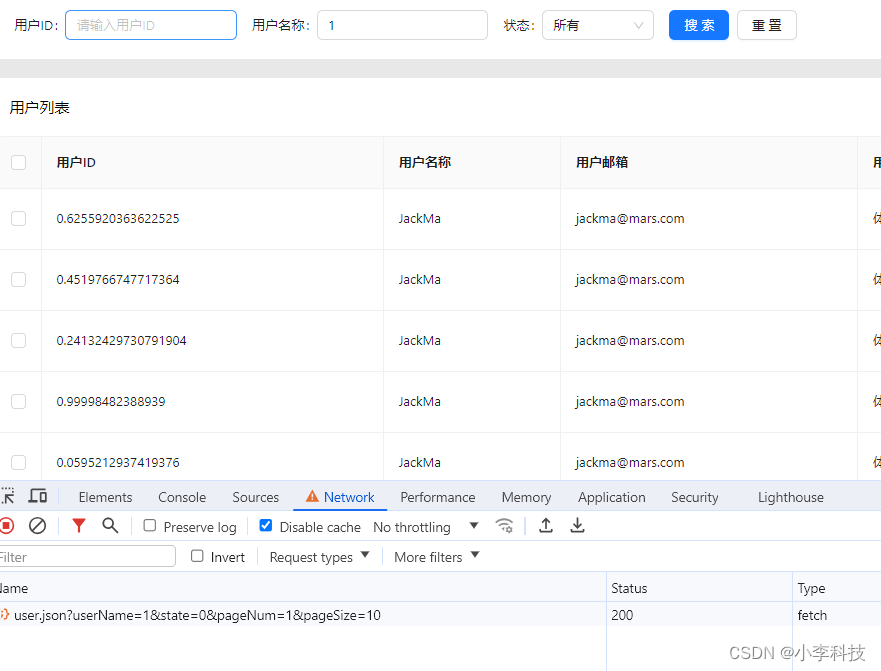
React18-模拟列表数据实现基础表格功能
文章目录 分页功能分页组件有两种接口参数分页类型用户列表参数类型 模拟列表数据分页触发方式实现目录 分页功能 分页组件有两种 table组件自带分页 <TableborderedrowKey"userId"rowSelection{{ type: checkbox }}pagination{{position: [bottomRight],pageSi…...

MySQL查询数据(十)
MySQL查询数据(十) 一、SELECT基本查询 1.1 SELECT语句的功能 SELECT 语句从数据库中返回信息。使用一个 SELECT 语句,可以做下面的事: **列选择:**能够使用 SELECT 语句的列选择功能选择表中的列,这些…...
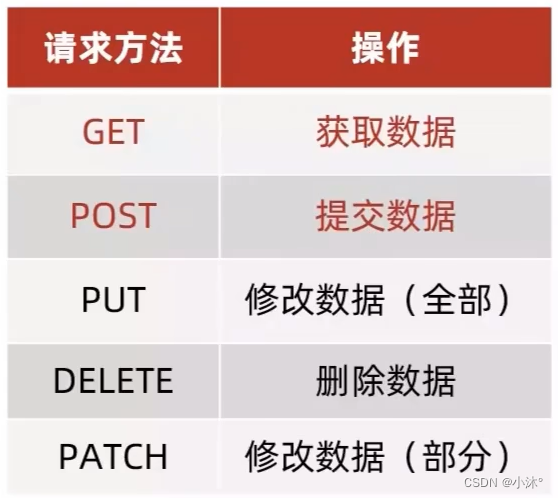
AJAX-常用请求方法和数据提交
常用请求方法 请求方法:对服务器资源,要执行的操作 axios请求配置 url:请求的URL网址 method:请求的方法,如果是GET可以省略;不用区分大小写 data:提交数据 axios({url:目标资源地址,method…...
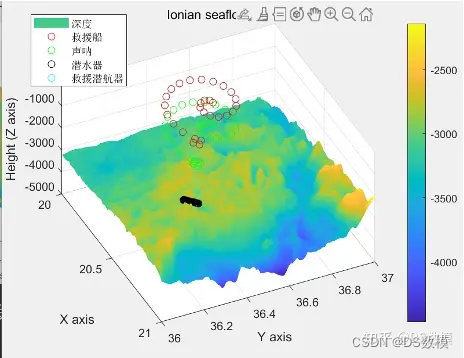
2024美国大学生数学建模竞赛美赛B题matlab代码解析
2024美赛B题Searching for Submersibles搜索潜水器 因为一些不可抗力,下面仅展示部分代码(很少部分部分)和部分分析过程,其余代码看文末 Dthxlsread(C:\Users\Lenovo\Desktop\Ionian.xlsx); DpDth(:,3:5); dy0.0042; dx0.0042; …...

【DouYing Desktop】
I) JD 全日制大专及以上学历; 2. 3年以上的IT服务支持相关工作经验 3. 有较强的桌面相关trouble shooting与故障解决能力,能够独立应对各类型桌面问题; 4. 具备基础的网络、系统知识,能够独立解决常见的网络、系统等问题…...
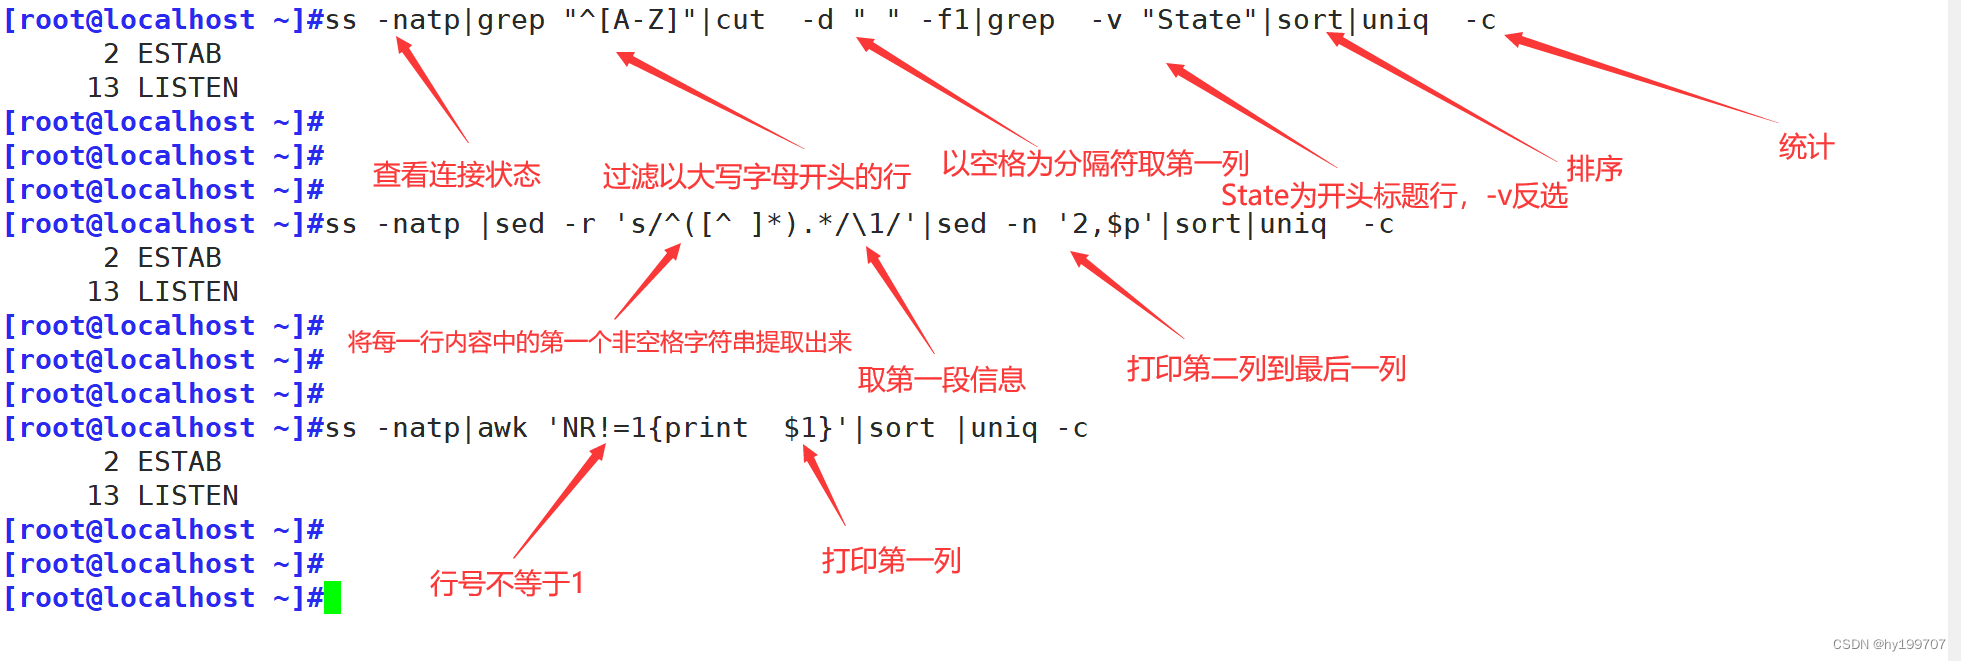
正则表达式与文本处理工具
目录 引言 一、正则表达式基础 (一)字符匹配 1.基本字符 2.特殊字符 3.量词 4.边界匹配 (二)进阶用法 1.组与引用 2.选择 二、命令之-----grep (一)基础用法 (二)高级用…...
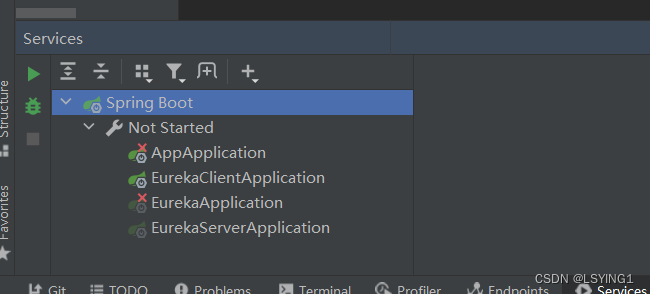
IDEA中的Run Dashboard
Run Dashboard是IntelliJ IDEA中的工具【也就是View中的Services】,提供一个可视化界面,用于管理控制应用程序的运行和调试过程。 在Run DashBoard中,可以看到所有的运行配置,以及每个配置的运行状态(正在运行…...

AI净界RMBG-1.4使用技巧:让抠图效果更完美的几个小方法
AI净界RMBG-1.4使用技巧:让抠图效果更完美的几个小方法 1. 为什么抠图效果有时不够理想? 即使是目前最先进的RMBG-1.4模型,在某些特殊情况下也可能出现边缘不够完美的情况。这通常不是模型本身的问题,而是由于输入图片的特性导致…...

算法工具箱之前缀和
前缀和概念:前缀和(Prefix Sum)是一种重要的预处理技术,能够在O(1)时间内快速计算数组任意区间的和。核心思想:对于数组nums,我们预先计算一个前缀和数组prefix,其中:prefix[i]表示n…...
函数整数溢出漏洞 分析)
PHP5.2下chunk_split()函数整数溢出漏洞 分析
受影响系统: PHP PHP < 5.2.3 不受影响系统: PHP PHP 5.2.3 描述: -------------------------------------------------------------------------------- BUGTRAQ ID: 24261 CVE(CAN) ID: CVE-2007-2872PHP是一种流行的WEB服务器端编程语言…...

百川2-13B-4bits量化模型+OpenClaw:自动化测试报告生成器
百川2-13B-4bits量化模型OpenClaw:自动化测试报告生成器 1. 为什么需要自动化测试报告生成 每次代码提交后,看着CI/CD流水线里密密麻麻的JUnit测试报告,我都会陷入一种"数据过载"的焦虑。特别是当测试用例失败时,需要…...

UE5第三人称相机避障实战:SpringArmComponent参数调优与常见Bug修复
UE5第三人称相机避障实战:SpringArmComponent参数调优与常见Bug修复 在虚幻引擎5(UE5)开发第三人称游戏时,相机系统的表现直接影响玩家的游戏体验。一个优秀的第三人称相机应该既能跟随角色流畅移动,又能智能避开场景障…...

【PyJIT 3.14权威调优白皮书】:基于37个生产级微服务压测数据的6类典型劣化模式诊断图谱
第一章:PyJIT 3.14 JIT编译器调优核心原理与演进脉络PyJIT 3.14 是 Python 生态中首个支持多层热路径识别与跨函数内联优化的生产级 JIT 编译器,其核心突破在于将传统基于计数器的热点检测升级为基于执行轨迹(Execution Trace)的动…...

2026好用的企业知识库汇总:11款工具实测与建议
本文将深入对比11款企业知识库管理工具:PingCode、亿方云、ShowDoc、Baklib、语雀、Notion、蓝凌、HelpLook、印象笔记、Bloomfire、沃丰科技知识库 在信息爆炸的办公环境下,企业知识库已成为团队沉淀资产、提升协作效率的核心工具。面对市面上琳琅满目的…...

数码管字符对照表
...

第6章 黎曼流形优化与几何方法
第6章 黎曼流形优化与几何方法 6.1 黎曼几何基础 6.1.1 复Stiefel流形与单位模流形(Unit-Modulus Manifold)度量 6.1.2 指数映射(Exponential Mapping)与平行移动(Parallel Transport) 6.1.3 测…...

前端加密的隐秘陷阱:Crypto-JS与JSEncrypt常见误用与解决方案
前端加密的隐秘陷阱:Crypto-JS与JSEncrypt常见误用与解决方案 1. 密钥管理的致命疏忽 在项目评审中,我经常发现开发者将加密密钥直接硬编码在JavaScript文件里。这种看似方便的做法实际上让加密形同虚设——攻击者只需查看源代码就能获取密钥,…...